Standalone Receiver Setup for Cisco WLC
The data receiver can be set up in standalone mode to work as a proxy. In addition it can be configured as a High Availability/Scalable N+1 configuration using zookeeper for group coordination and leader election. These instructions only cover single server/non high available installation.
These instructions are for a single node non-HA receiver.
If required, the receiver can be set up in either an Active/Active (using 3 or more hardware independent nodes) or Active/Passive (using two nodes). Please ask if you need to implement these configurations.
Configuration
Please ensure that the server configuration is completed first - talk to Kloudspot support to get this done.
Proxy VM requirements
OS/Resources:
The VM running the proxy should have the following specification:
- RAM: 8GB
- Disk :50 GB
- 4 core
- OS: Ubuntu 18.04
Firewall:
The following routes should be enabled:
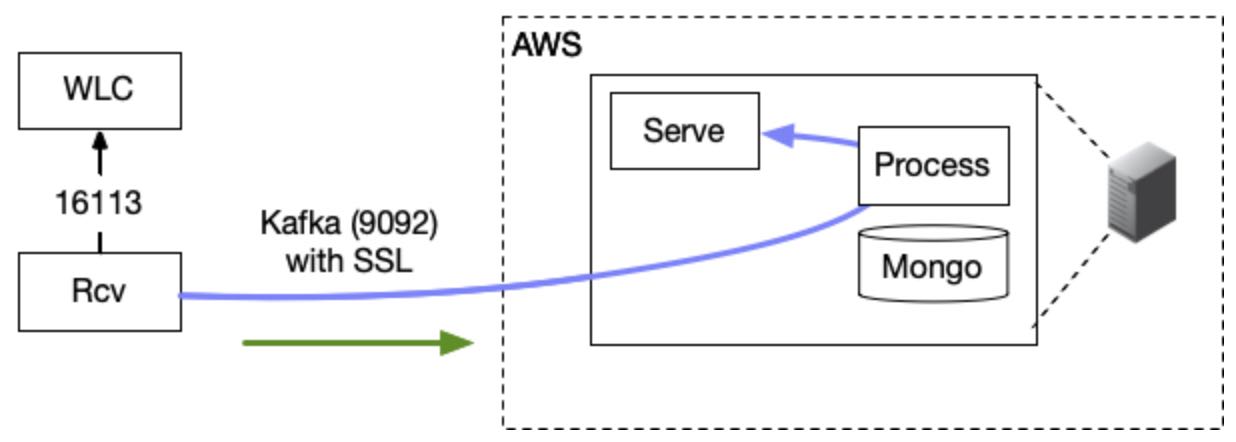
- From VM to WLC : port 16113
- From VM to Kloudspot Analytics Platform : port 9094
Proxy Receiver Setup.
Set up and update/upgrade a clean installation of Ubuntu 18.04 LTS.
When installing from scratch, make sure to install the open SSH server to allow remote access.
Test connectivity to the WLC and the Kloudspot Analytics Server from the VM:
$ nc -w2 -vz <WLC IP> 16113
$ nc -w2 -vz <Kloudspot server IP> 9094
Add Kloudspot’s official GPG public key:
$ curl -fsSL https://registry.kloudspot.com/repository/files/kloudspot.gpg.key | sudo apt-key add -
Verify that you now have the key with the fingerprint 7DD9 F762 BBDB FBC9 3103 4270 0B15 B423 21FA FC35, by searching for the last 8 characters of the fingerprint.
$ sudo apt-key fingerprint 21FAFC35
pub   rsa2048 2019-12-02 [SC] [expires: 2021-12-01]
      7DD9 F762 BBDB FBC9 3103  4270 0B15 B423 21FA FC35
uid           [ unknown] Steve Jerman <steve@kloudspot.com>
sub   rsa2048 2019-12-02 [E] [expires: 2021-12-01]
Use the following command to set up the repository.
$ sudo add-apt-repository \
  "deb [arch=amd64] https://registry.kloudspot.com/repository/kloudspot-apt/  bionic main"
Install the receiver and its required components java, zookeeper
$ sudo apt-get update
$ sudo apt-get install kloudspot-receiver
Start zookeeper
$ sudo service zookeeper start
$ sudo systemctl enable zookeeper
Kloudspot Support will provide a client.truststore.pkcs file and password, copy this to /etc/kloudspot and edit the /etc/kloudspot/receiver.yml configuration to set the password and server address:
kafka:
  servers: <kloudspot server IP>:9094
  ssl: true
  truststore-location: /etc/kloudspot/client.truststore.pkcs
  truststore-password: replace-me
Kloudspot Internal Note: See here for generation instructions
Run receiver to see the connection command.
$ sudo -H -u kloudspot /usr/local/kloudspot/receiver/run.sh
You can stop the script (Cntl C) as soon as you see this:
**************************

Run this command on the WLC
  config auth-list add sha256-lbs-ssc <MAC Address> <SHA256>

********************
Run the specific command shown in program log from the above step on the WLC:
Then edit the /etc/kloudspot/receiver.yml and add the WLC host IP:
    standalone:
        enabled: true
        connections:
        - type: wlc
          host: <WLC IP>
At this point installation should be complete. You can start up the receiver as a service with the following commands:
$ sudo service kloudspot-receiver start
$ sudo systemctl enable kloudspot-receiver
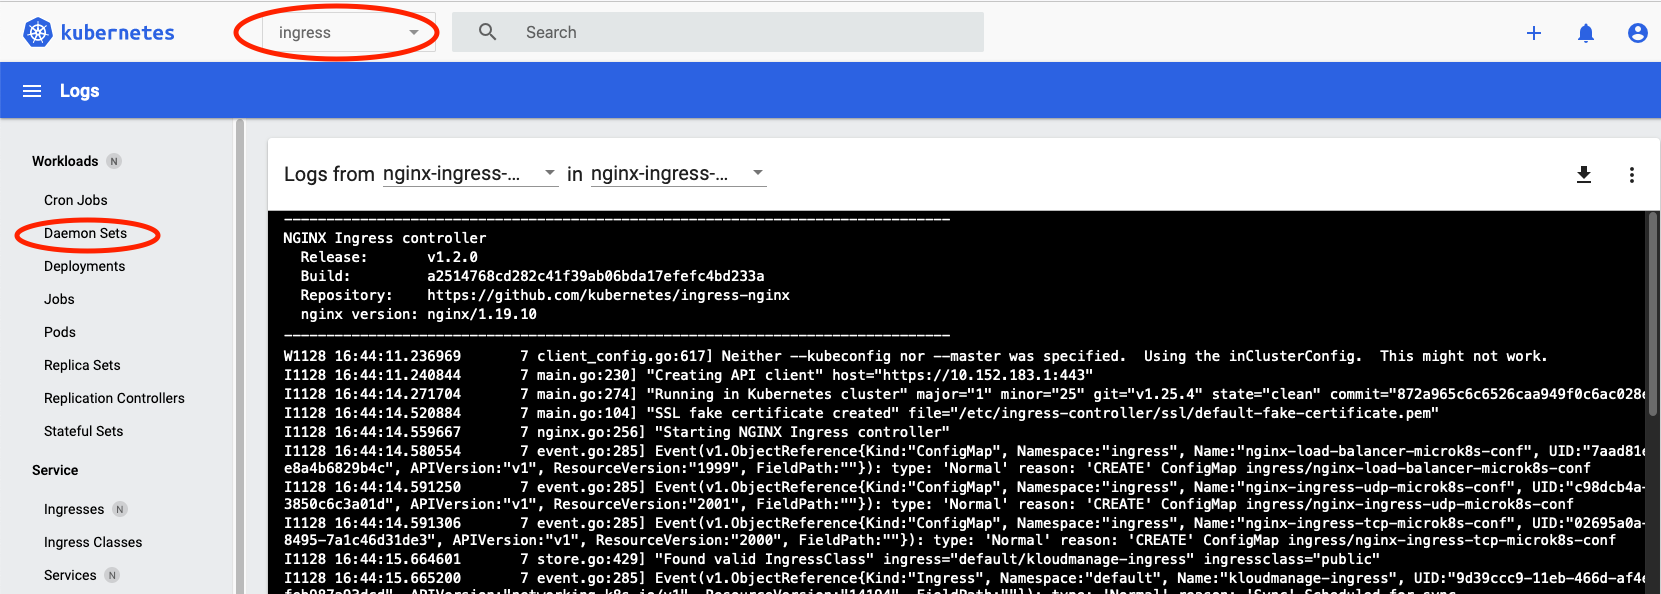
You can see the log using:
$ sudo journalctl -u kloudspot-receiver -f
$ sudo journalctl -u kloudspot-receiver --since "10min ago"
Generating the WLC SSL Connection File
The connection to the WLC is authorized using an MAC address and an SSL file. In order to regenerate this file following the following steps:
- Edit the
/etc/kloudspot/receiver.yml file. Remove the current MAC Address and set the keystore to an empty writeable location, also change the password if desired:
push:
..
   nmsp:
      inputBufferSize: 48768
      macAddress: '50:D3:7B:5B:70:F8'
      keystore:
         password: **erHSbFfpKWLf**`
         file: file:/tmp/wlc-keystore.pks``
- Run receiver to see the connection command.
    $ sudo -H -u kloudspot /usr/local/kloudspot/receiver/run.sh
    ...
    **************************
    Add this values to the config file (push.nmsp.macAddress) :
    MAC: 50:D3:7B:5B:70:F8

    Run this command on the WLC
      config auth-list add sha256-lbs-ssc 50:D3:7B:5B:70:F8 fecb74538bb6be79f33b4dc23951552cd86523c0e563b5ac13070bf4205e0538
    ********************
Stop the receiver as soon as you see the connection command.
- Copy the generated keystore (
/tmp/wlc-keystore.pks) to /etc/kloudspot and edit /etc/kloudspot/receiver.yml as follows:
push:
...
    nmsp:
...
        macAddress: '50:D3:7B:5B:70:F8'
        keystore:
           password: erHSbFfpKWLf
           file: file:/etc/kloudspot/wlc-keystore.pks
Upgrade
The following procedure should be followed to upgrade the proxy receiver. Note that downgrade is not suupported.
Preparation
Prior to doing the upgrade make sure to backup your system.
- Backup VM:
- Ideally, have a snapshot available to restore in case of issues.
- File Backup:
- Take a copy of all files located in
/etc/Kloudspot.
Upgrade Process
- Stop Services:`
   sudo service kloudspot-receiver stop
   sudo service zookeeper stop
-
Update the KloudInsights instance that will be receiving data. This will likely need liason with Kloudspot operations.
-
Update Receiver:
   sudo apt-get update
   sudo apt-get upgrade
   <reboot>
The upgrade process is now complete.
Post-Upgrade Checks
Perform the following checks to ensure the successful completion of the upgrade:
- Check Java Version:
   java  -version
   The version should be 17.
- Check Receiver Logs:
sudo journalctl -u kloudspot-receiver -f
There should be no errors displayed.
Additional Considerations
apt list kloudspot-receiver -a
sudo apt-get install -y kloudspot-receiver=<version>
Questions and Answers
- Can we use the following commands instead?
    apt-get install  -y openjdk-17-jdk
    apt-get install  -y kloudspot-receiver
Because our VPN software might be included in the package list and we don’t want to upgrade any packages except regarding Kloudspot-receiver.
Ans. Yes, that approach is acceptable.
- What version should kloudspot-receiver be upgraded to? Also, how can we confirm the version after upgrading? Will “kloudspot-receiver -version” work?
Ans. Ask Kloudspot for the appropriate version to upgrade to. To confirm the version, use the following command:
apt list kloudspot-receiver -a
Monitoring
For a HA on-prem installation it is a good idea to set up monitoring and alerting so that you can monitor the state of the cluster and get alerts for issues such as memory limits exceeded or low disk space.
Once the kloudspot platform is installed, the necessary files will be installed in /opt/kloudspot/monitoring:
values.yaml : Helm chart configuration.dashboard-config.yaml : Loader for Kloudspot specific dashboard.monitors.yaml : Custom POD and Service monitor configurations to gather prometheus information from Kloudspot components.
Installation
Install the following Helm repo:
helm repo add prometheus-community https://prometheus-community.github.io/helm-charts
helm repo update
Modify the /etc/monitoring/values.yaml file to suit. Typically this will only mean setting the Grafana URL:
  grafana.ini:
    server:
      root_url: https://localhost/grafana
Install the helm chart:
cd /opt/kloudspot/monitoring
helm install mtr  -f values.yaml --create-namespace -n mtr prometheus-community/kube-prometheus-stack
Once started, you can login to the Grafana instance with the following credentials:
- URL:
https:\<server>/grafana/
- Username:
admin
- Password:
prom-operator
You can also access the Prometheus UI using port forwarding:
kubectl port-forward -n mtr service/prometheus-operated 9090:9090
Load Kloudspot Configuration
Next install some POD Monitors and Service monitors specific to the Kloudspot Platform
sjerman@steve-nuc:/opt/kloudspot/monitoring$ kubectl apply -f monitors.yaml
servicemonitor.monitoring.coreos.com/kloudspot-flink-job-metrics created
podmonitor.monitoring.coreos.com/kloudspot-flink-tm-metrics created
servicemonitor.monitoring.coreos.com/kloudspot-web-ui-metrics created
Add a custom dashboard for the Kloudspot Platform:
sjerman@steve-nuc:/opt/kloudspot/monitoring$ kubectl apply -f dashboard-configmap.yaml
configmap/kloudspot-grafana-dashboard created
Enable Kafka Monitoring. Edit /etc/kloudspot/values.yaml:
kafka:
...
    metrics:
       kafka:
          enabled: true
       serviceMonitor:
          enabled: true
          labels:
            release: mtr
Then restart the Kloudspot services:
kloudspot update -u
You can also use the Grafana administration interface to create custome alerts and dashboards as required.
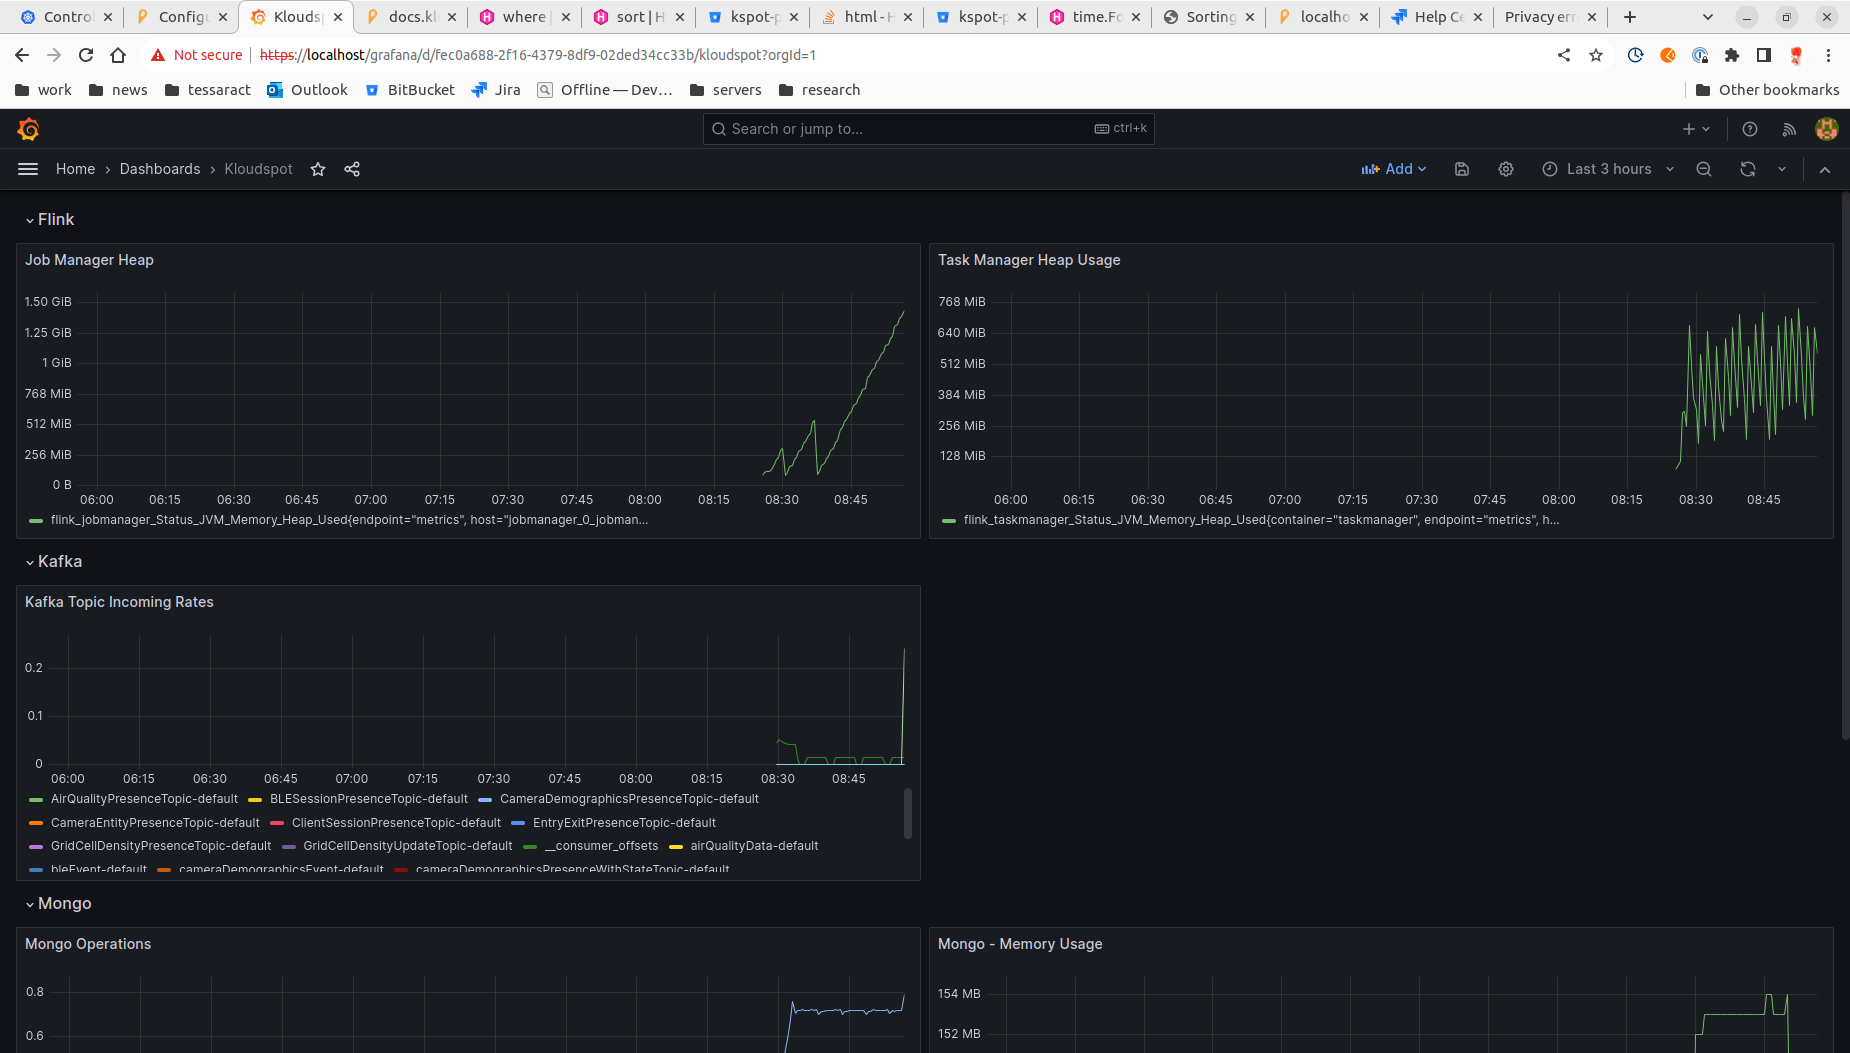
Once you have the monitors and dashboard loaded you will be able to see some data:

Reference