Monitoring
For a HA on-prem installation it is a good idea to set up monitoring and alerting so that you can monitor the state of the cluster and get alerts for issues such as memory limits exceeded or low disk space.
Once the kloudspot platform is installed, the necessary files will be installed in /opt/kloudspot/monitoring:
values.yaml: Helm chart configuration.dashboard-config.yaml: Loader for Kloudspot specific dashboard.monitors.yaml: Custom POD and Service monitor configurations to gather prometheus information from Kloudspot components.
Installation
Install the following Helm repo:
helm repo add prometheus-community https://prometheus-community.github.io/helm-charts
helm repo update
Modify the /etc/monitoring/values.yaml file to suit. Typically this will only mean setting the Grafana URL:
  grafana.ini:
    server:
      root_url: https://localhost/grafana
Install the helm chart:
cd /opt/kloudspot/monitoring
helm install mtr  -f values.yaml --create-namespace -n mtr prometheus-community/kube-prometheus-stack
Once started, you can login to the Grafana instance with the following credentials:
- URL:
https:\<server>/grafana/ - Username:
admin - Password:
prom-operator
You can also access the Prometheus UI using port forwarding:
kubectl port-forward -n mtr service/prometheus-operated 9090:9090
Load Kloudspot Configuration
Next install some POD Monitors and Service monitors specific to the Kloudspot Platform
sjerman@steve-nuc:/opt/kloudspot/monitoring$ kubectl apply -f monitors.yaml
servicemonitor.monitoring.coreos.com/kloudspot-flink-job-metrics created
podmonitor.monitoring.coreos.com/kloudspot-flink-tm-metrics created
servicemonitor.monitoring.coreos.com/kloudspot-web-ui-metrics created
Add a custom dashboard for the Kloudspot Platform:
sjerman@steve-nuc:/opt/kloudspot/monitoring$ kubectl apply -f dashboard-configmap.yaml
configmap/kloudspot-grafana-dashboard created
Enable Kafka Monitoring. Edit /etc/kloudspot/values.yaml:
kafka:
...
    metrics:
       kafka:
          enabled: true
       serviceMonitor:
          enabled: true
          labels:
            release: mtr
Then restart the Kloudspot services:
kloudspot update -u
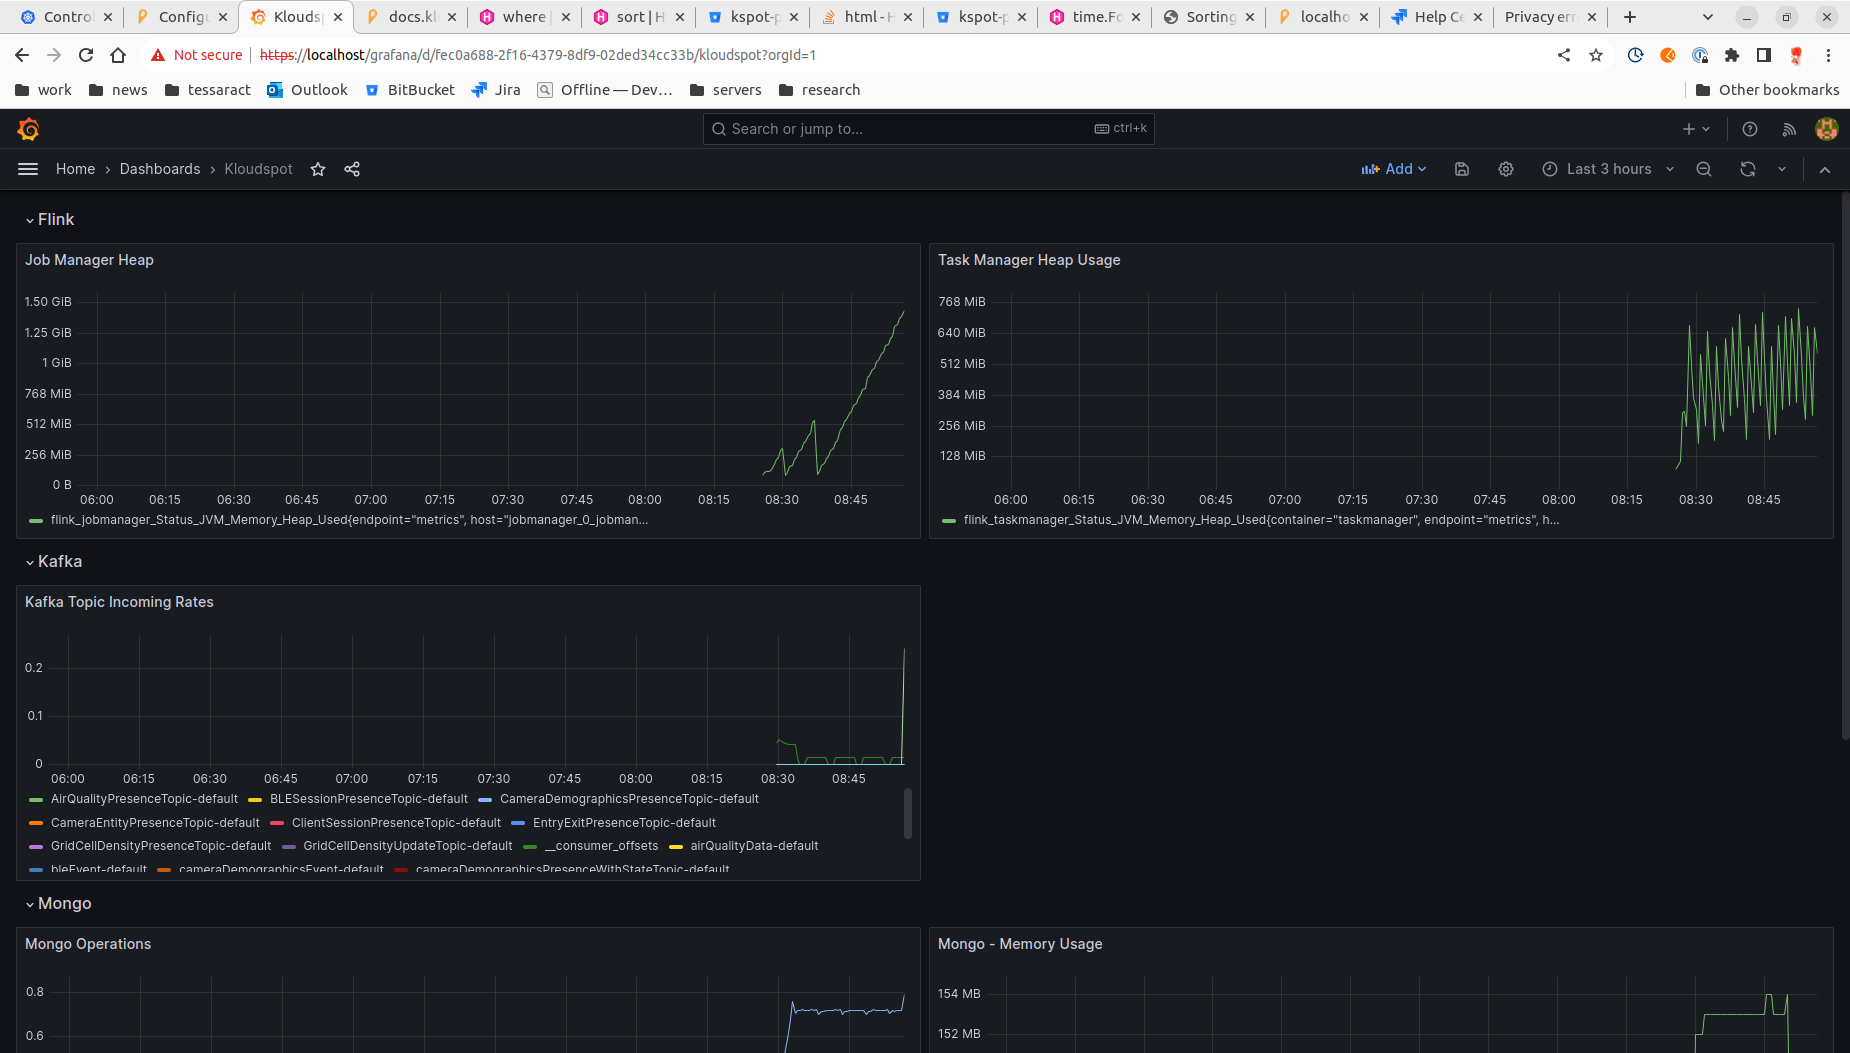
You can also use the Grafana administration interface to create custome alerts and dashboards as required.
Once you have the monitors and dashboard loaded you will be able to see some data: