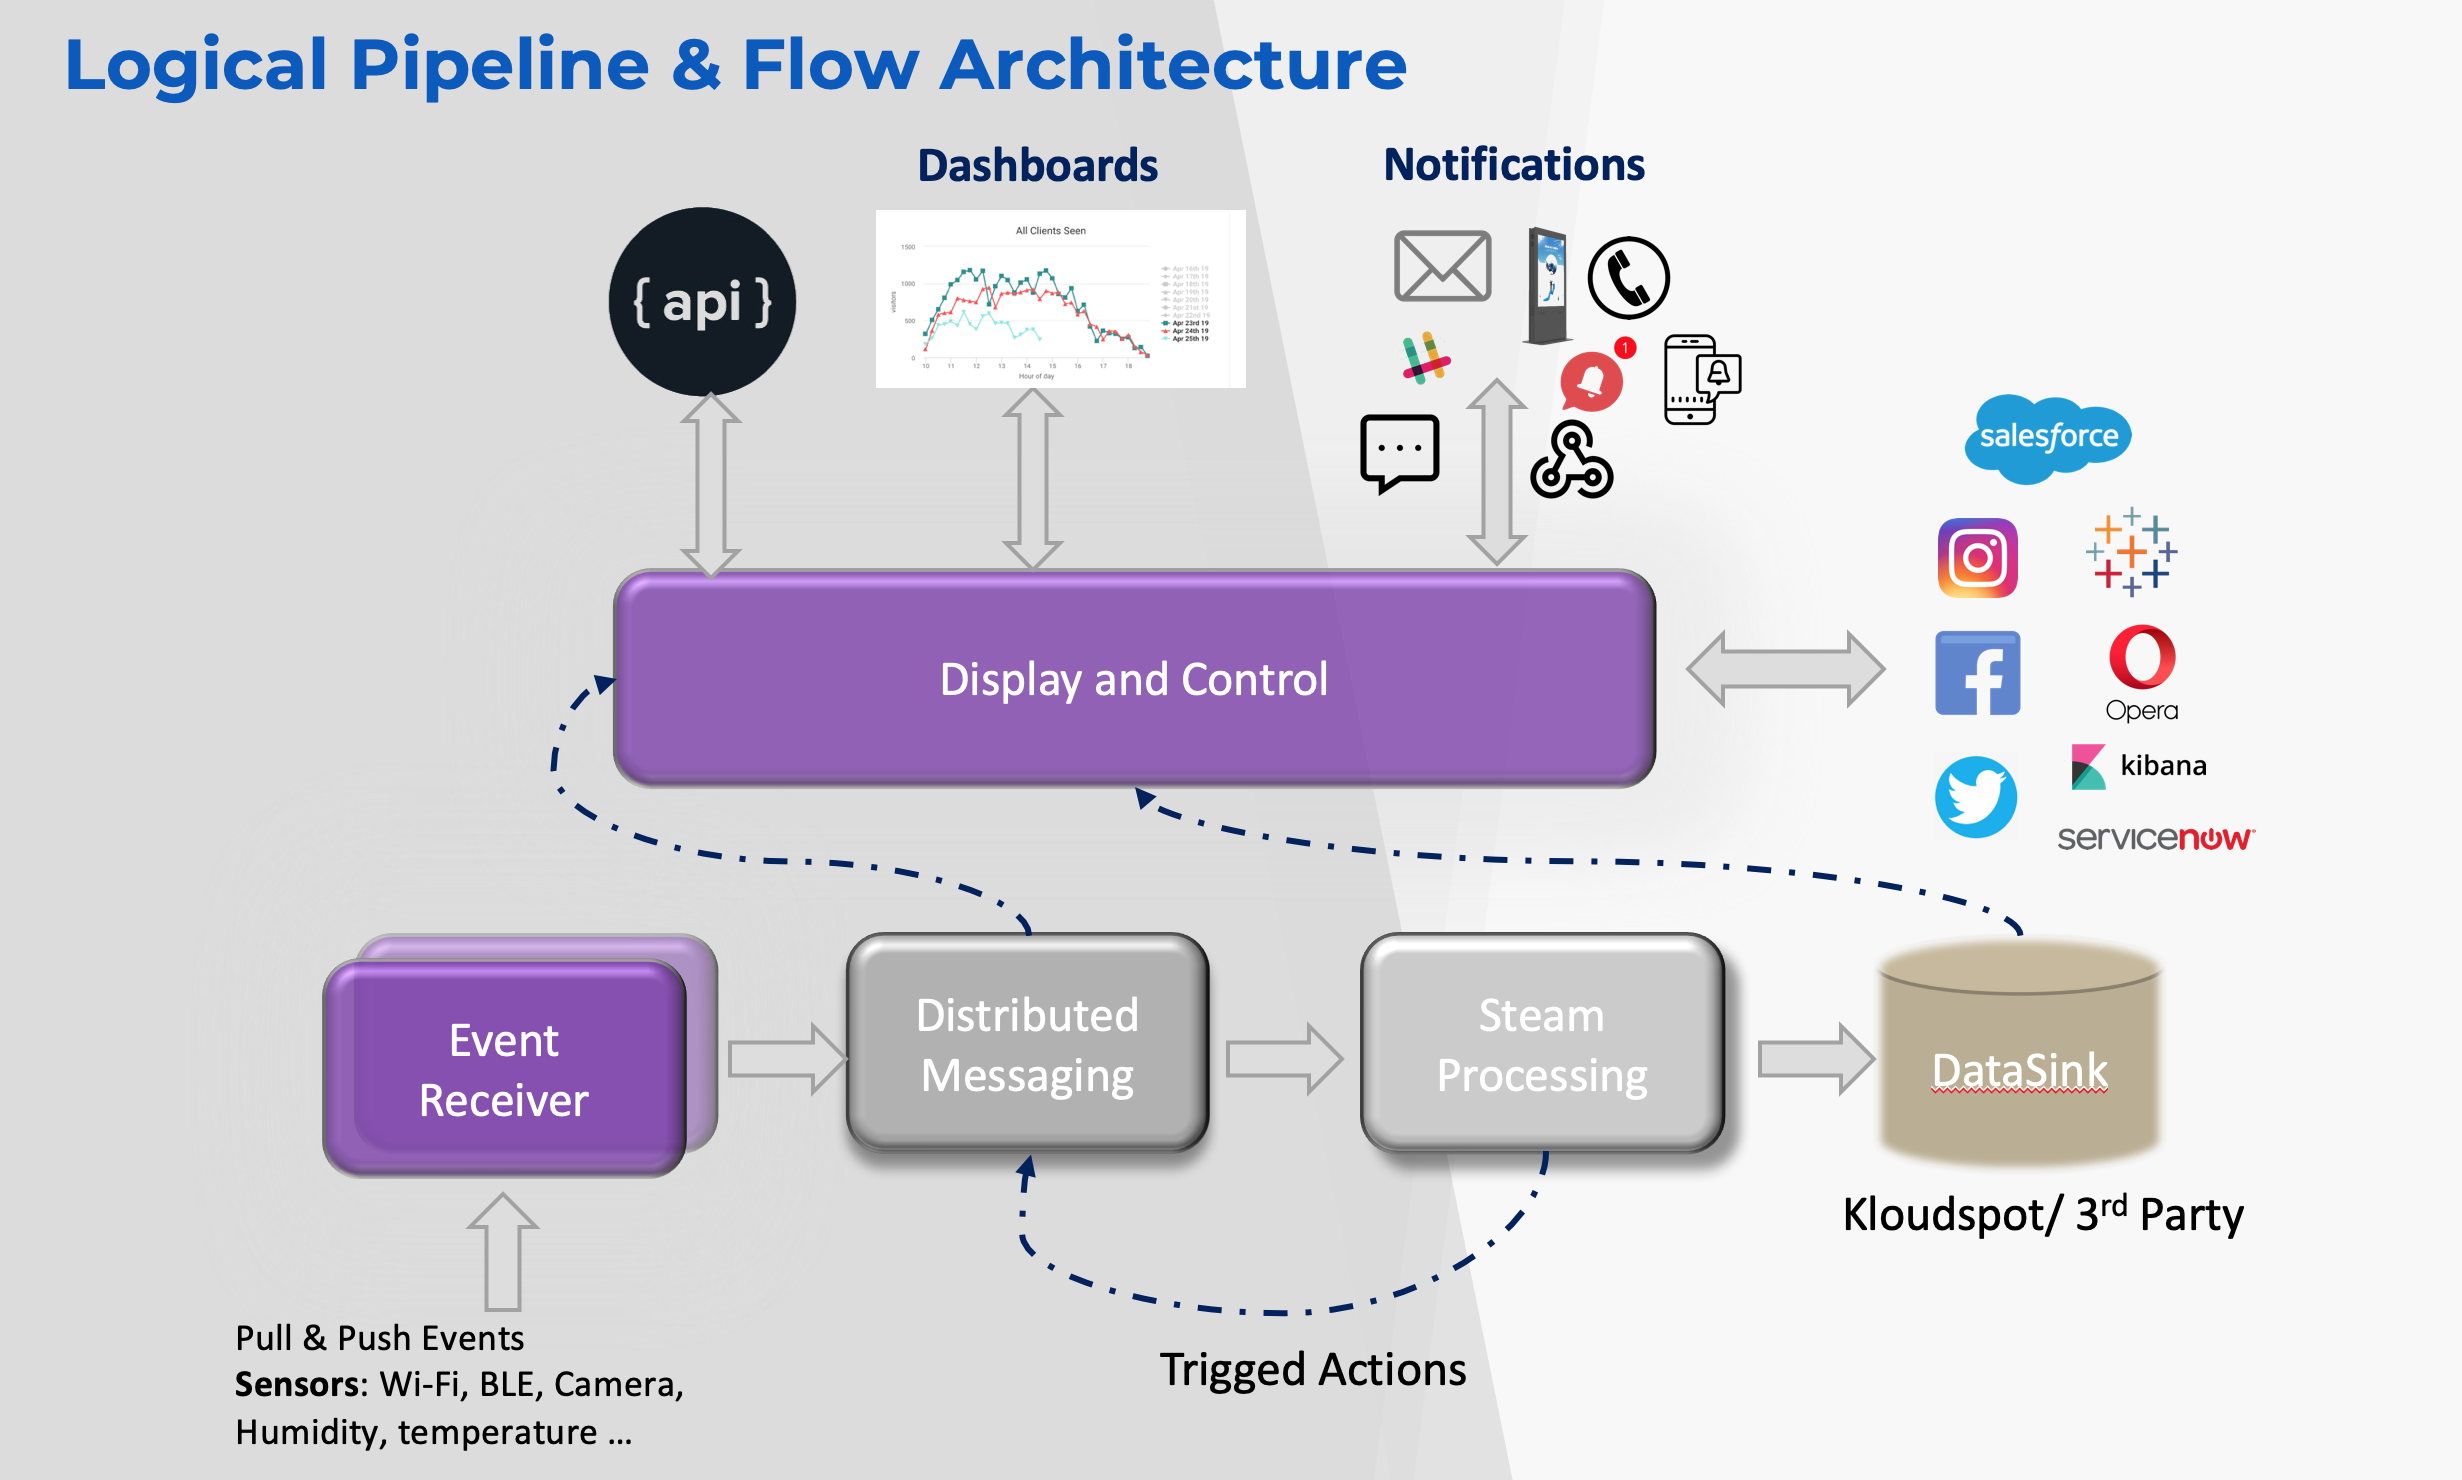
The Kloudspot Analytics Platform provides a high-speed scalable stream
processing focused on analysis streams of BLE/WiFi client location and
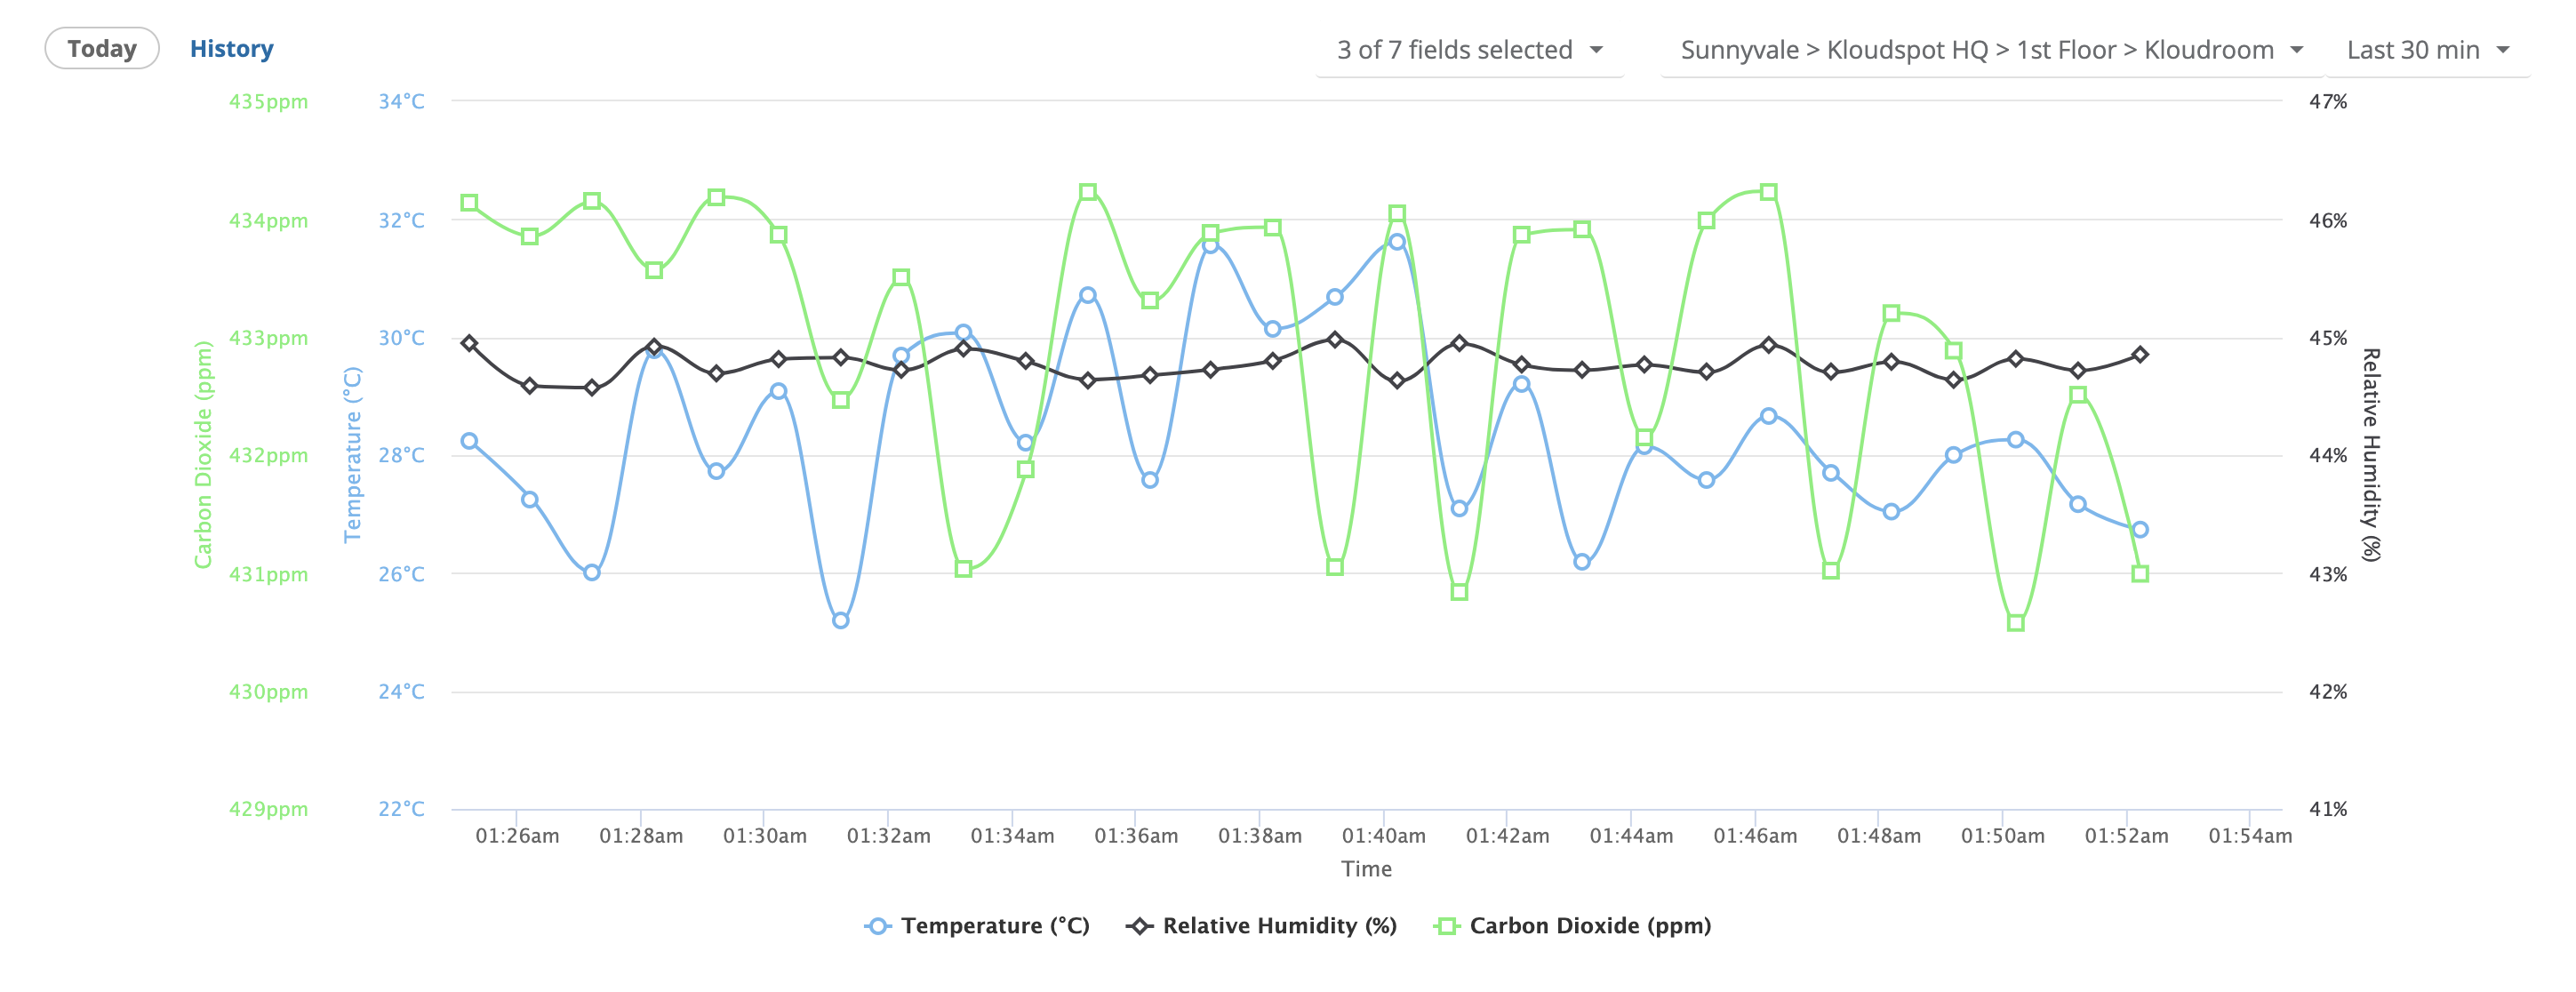
presence data, IoT sensors including CO2, humidity, temperature, in
combination with other data sources such as guest portal registrations.
The main flow is as follows:
The Event Receivers take in event data from the configured Kloudspot or third-party data sources. The received events are transformed from the, normally, proprietary formats used to a consistent internal format that is then sent to the stream processing Job.
The Stream Processing Job is where all the high-performance processing in our system is performed. We use Apache Flink due to its ability to scale to handle massive loads. The job does the following main things:
Convert the events into a set of ‘sessions’ - one per client.
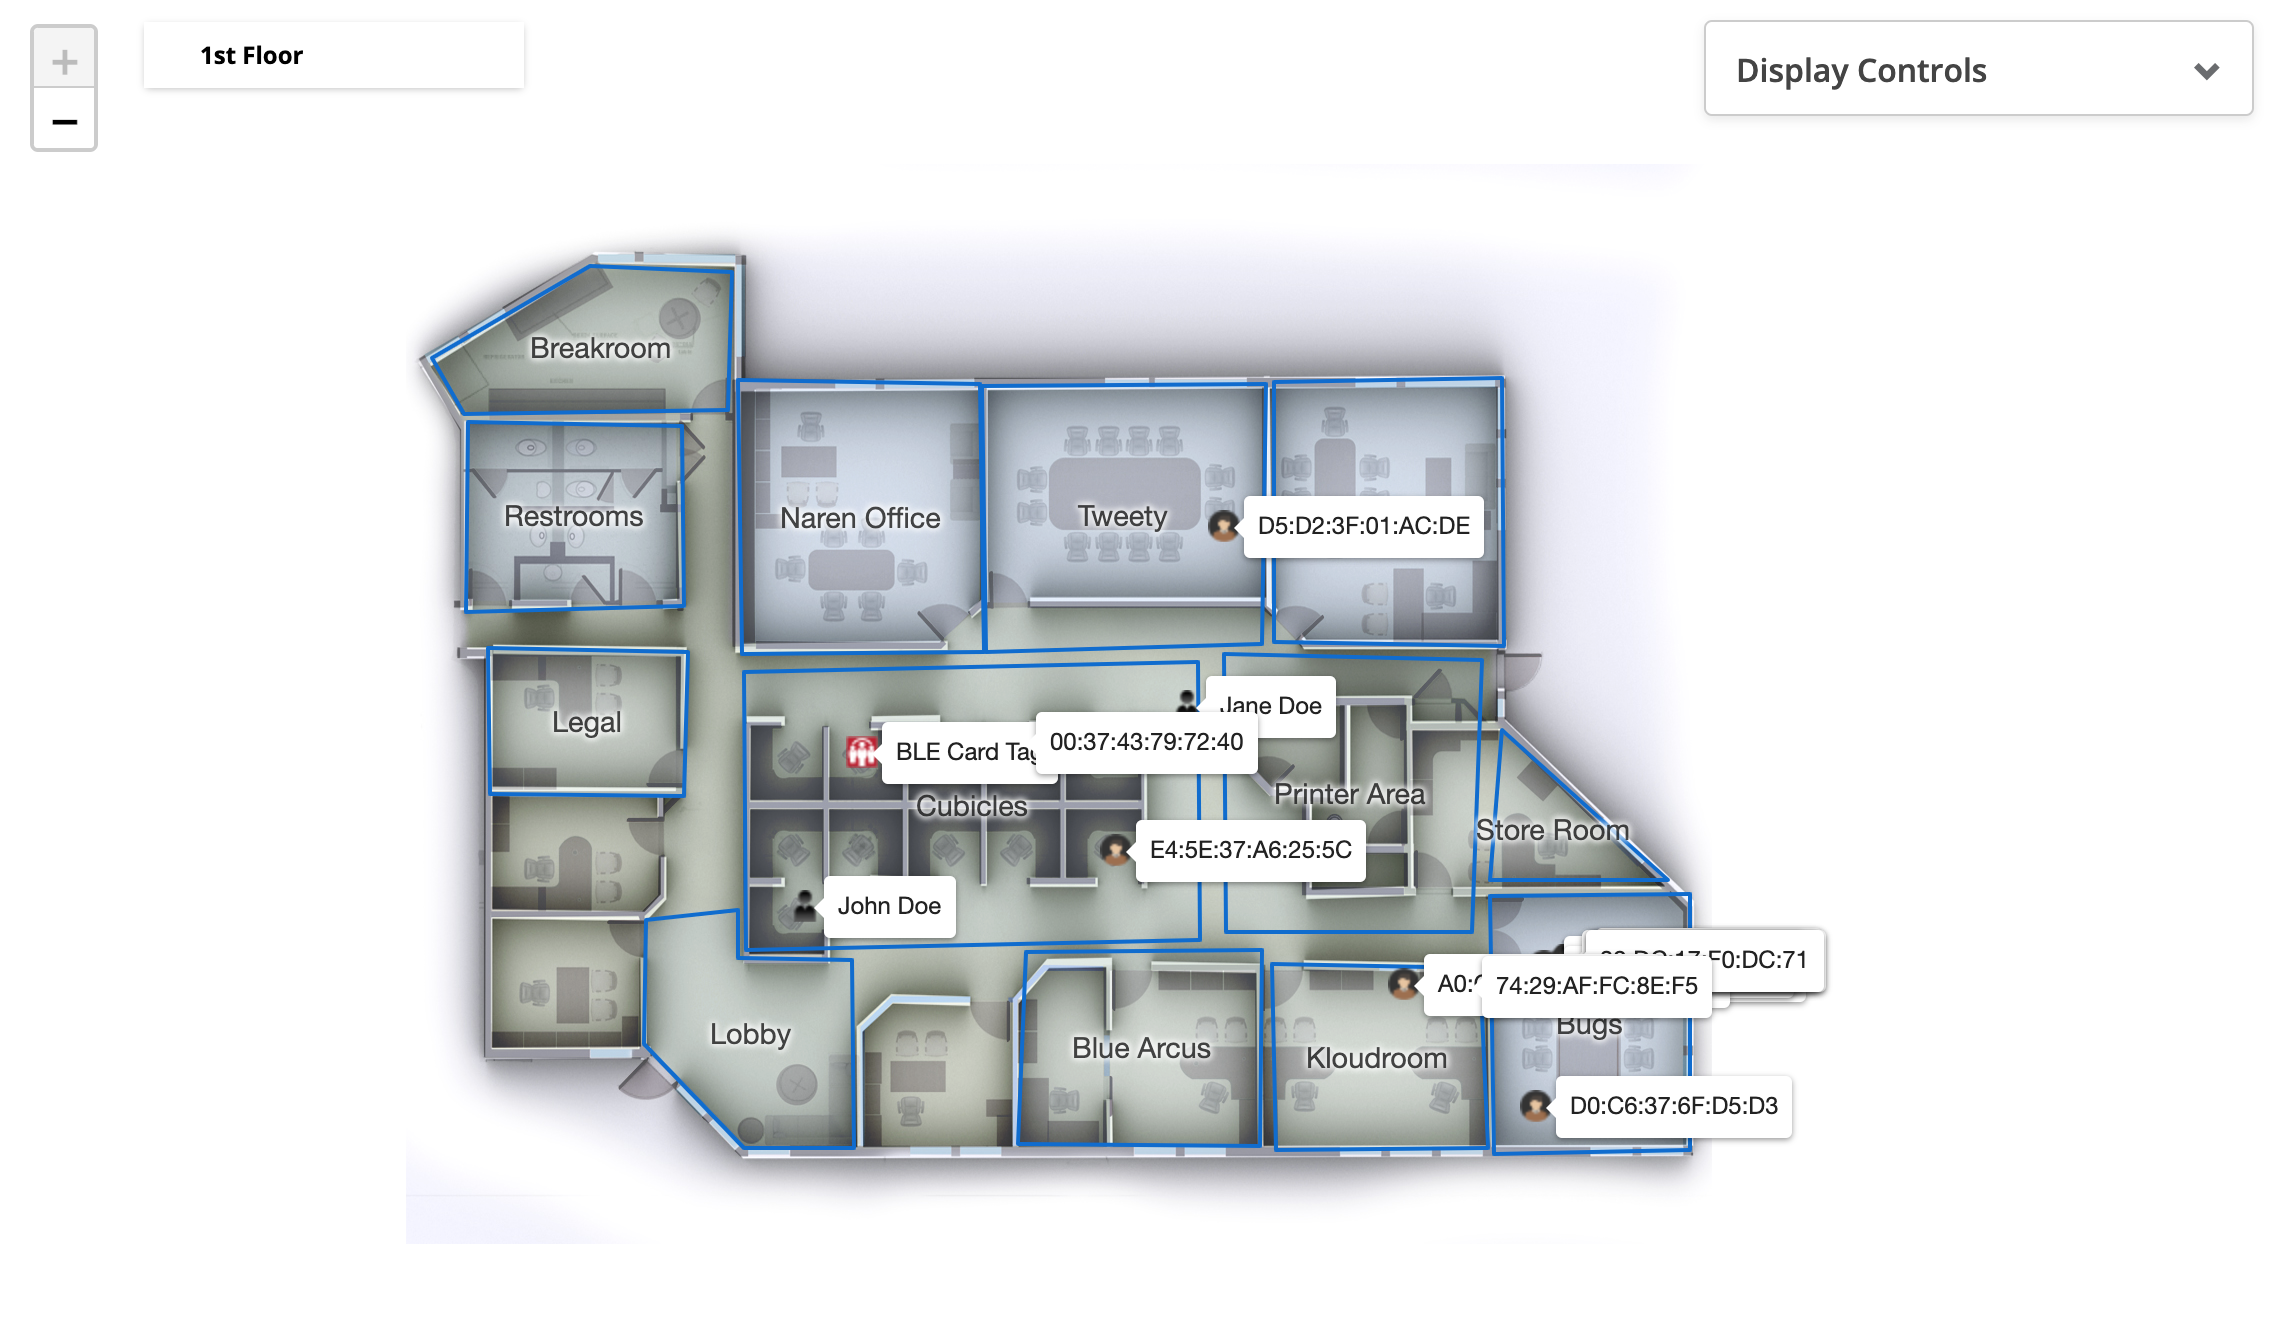
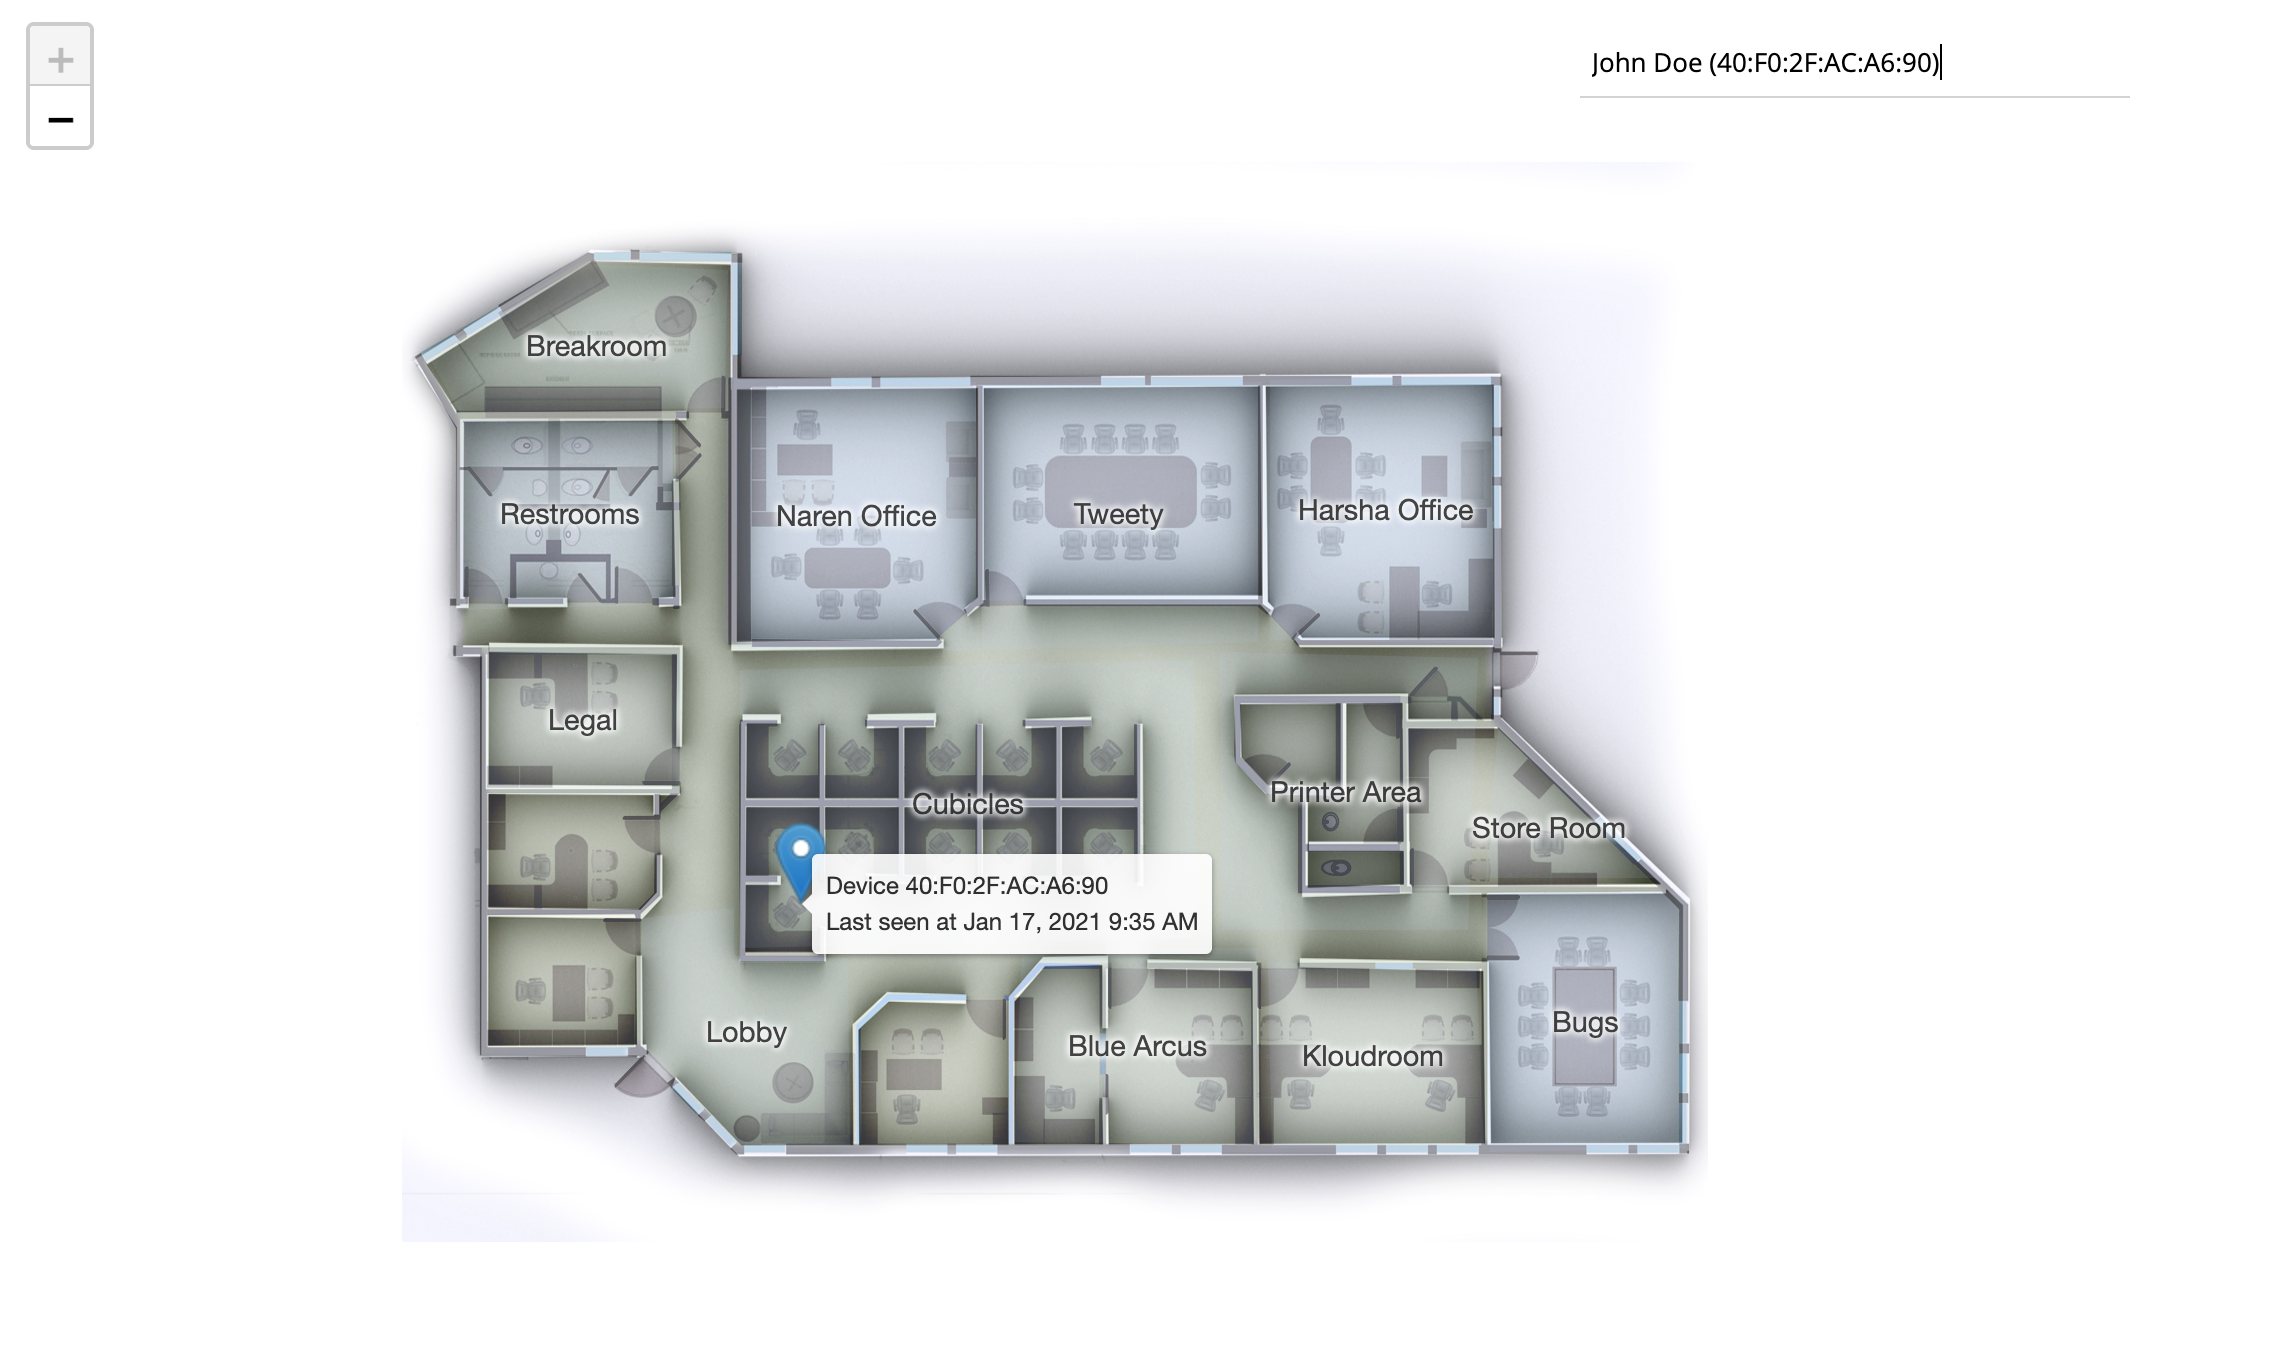
Locate each client in real-time using one of several techniques:
Presence, where the client is located in a zone based on single strength to nearby Access Points.
Trilateration, where multiple signal strength measurements are used to locate a client to a specific X/Y or geo coordinate.
Aggregate the client information to provide time series counts based on various attributes.
Perform path-movement analysis on the clients.
Look for matches against the rules.
The main application provides
Flexible data presentation.
Rule creation and editing.
Sending notifications (for example SMS, or Email).
Unlock the full potential of KloudInsight, from login to third-party integration, action template creation, rule setup, and dashboard design, with this comprehensive Admin guide.
This comprehensive manual will teach you how to gain valuable insights from your data. Whether you’re familiar with KloudInsights or new to the platform, this guide has everything you need: from the platform’s features and functionalities to its best practices. This will help you make informed decisions based on your data.
Here, you’ll find step-by-step instructions, tips, and detailed explanations to help you navigate through KloudInsights effortlessly. From creating customized dashboards to setting up powerful rules and generating reports, we’ve got you covered.
To access KloudInsights, you’ll need a URL, username, and password. These details are provided at the time of product purchase. If you’re unsure about this process, refer to the “Kloudspot Product Purchase Options and Provisioning Process” section for a comprehensive guide on how to acquire a Kloudspot product. Then follow the steps outlined below:
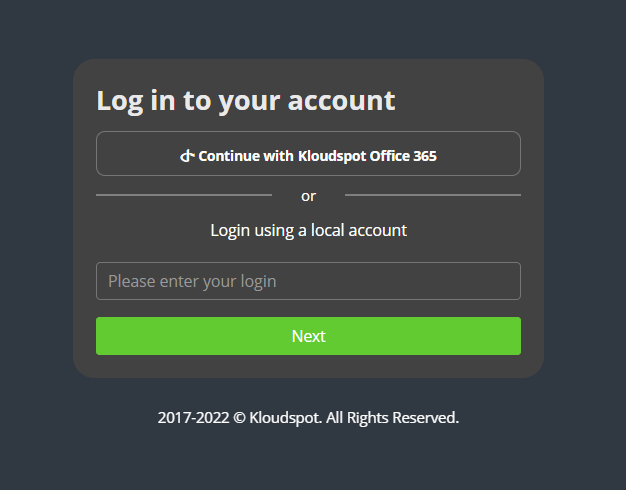
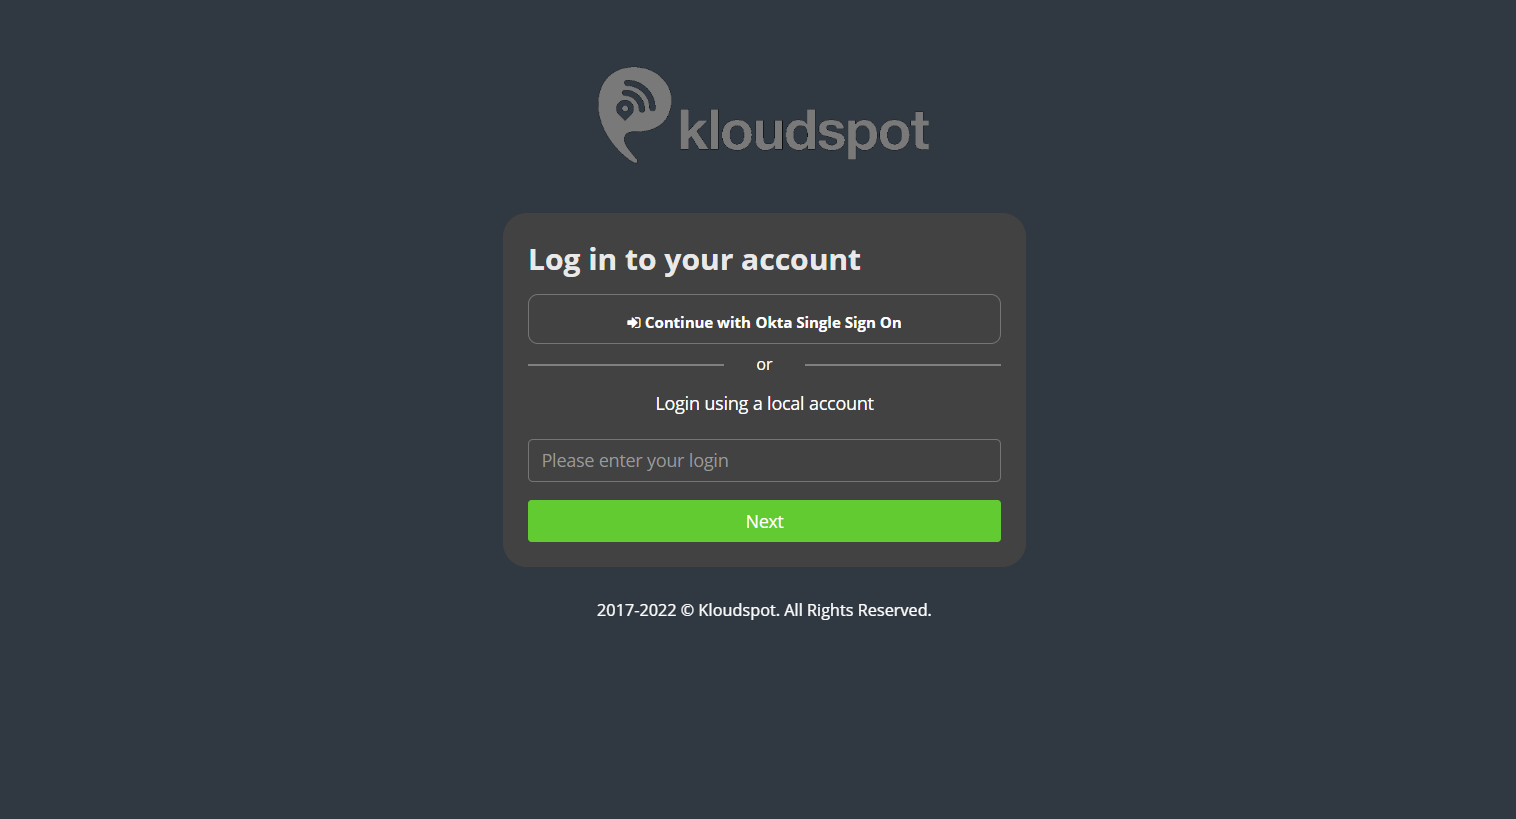
Open your web browser.
In the address bar, type the URL provided to you upon purchase, and press Enter. This URL will lead you to the KloudManage login page.
On the login page, you will need to enter your username and password. These credentials should have been provided to you upon purchase. If you haven’t received them or have trouble logging in, please contact Kloudspot support for assistance.
Once you’ve entered your username and password, click the “Log In” button to access the KloudInsights dashboard.
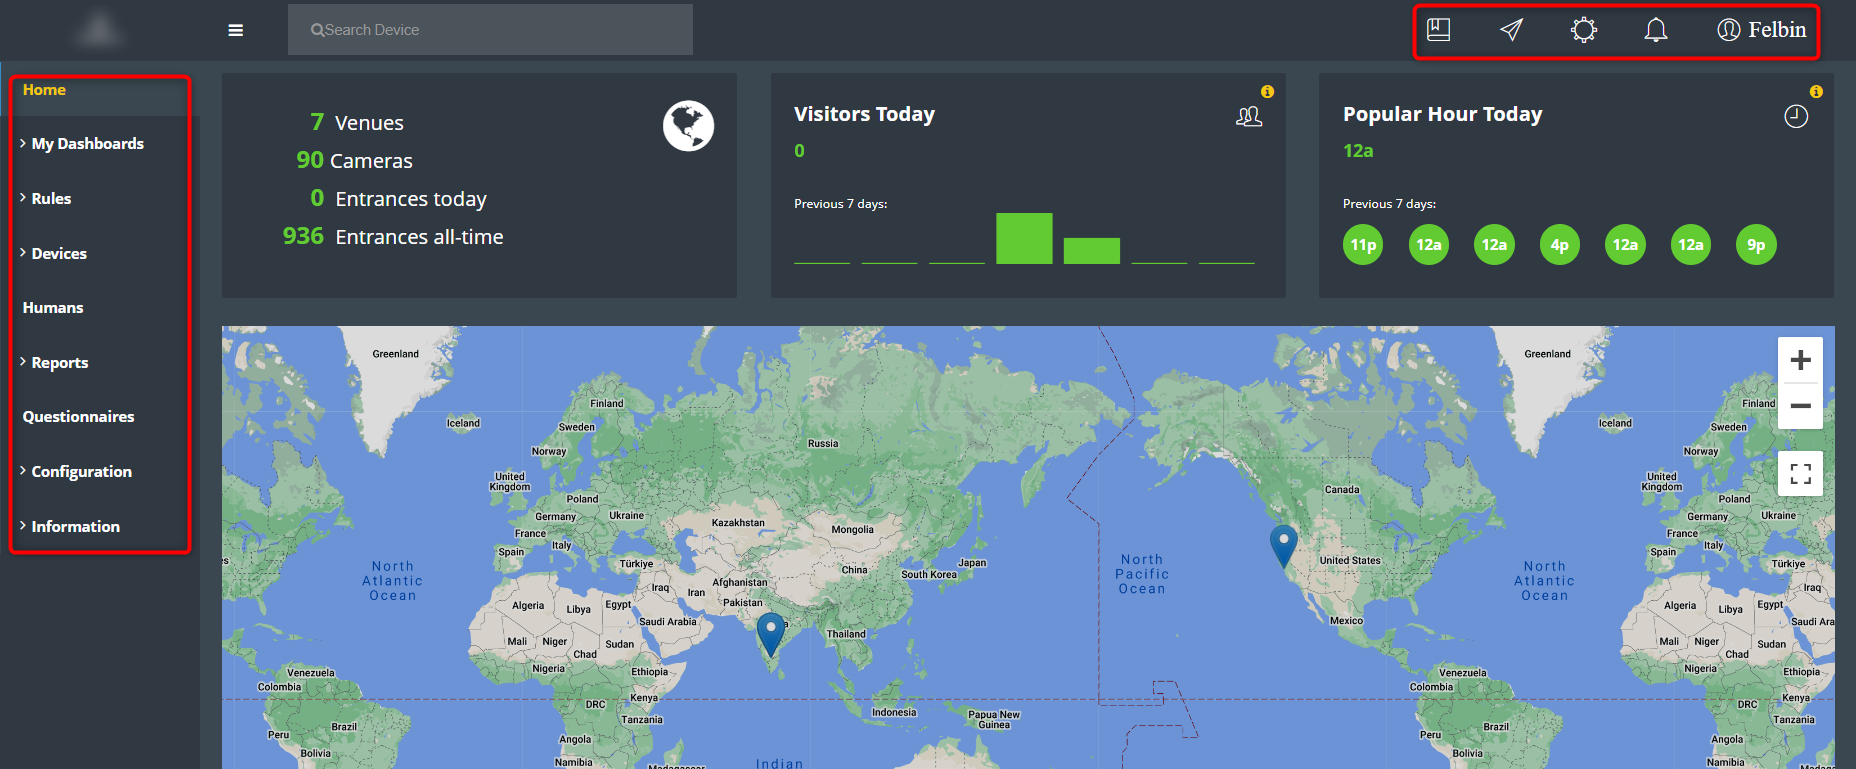
Home Page Overview
Immediately after logging in, you will reach the home page of KloudInsights. Here you can see different dashboards and menu buttons.
The KloudInsights Dashboard provides a centralized hub for accessing and managing key features of the platform. The user interface is designed for intuitive navigation, with an expandable menu on the left and essential buttons at the top-right corner of the screen.
Top Menu Buttons
Access to Online Documentation
Provides direct access to the web-based documentation for KloudInsights. This resource offers detailed information, guides, and tutorials to help users navigate the platform effectively.
Feedback to Product Team
Allows users to provide direct feedback to the product team regarding any encountered bugs or suggested features. This feature promotes user involvement in the ongoing development and improvement of the platform.
User Settings
Enables users to manage their account settings, including updating their email address and password. This section ensures that users have control over their account information.
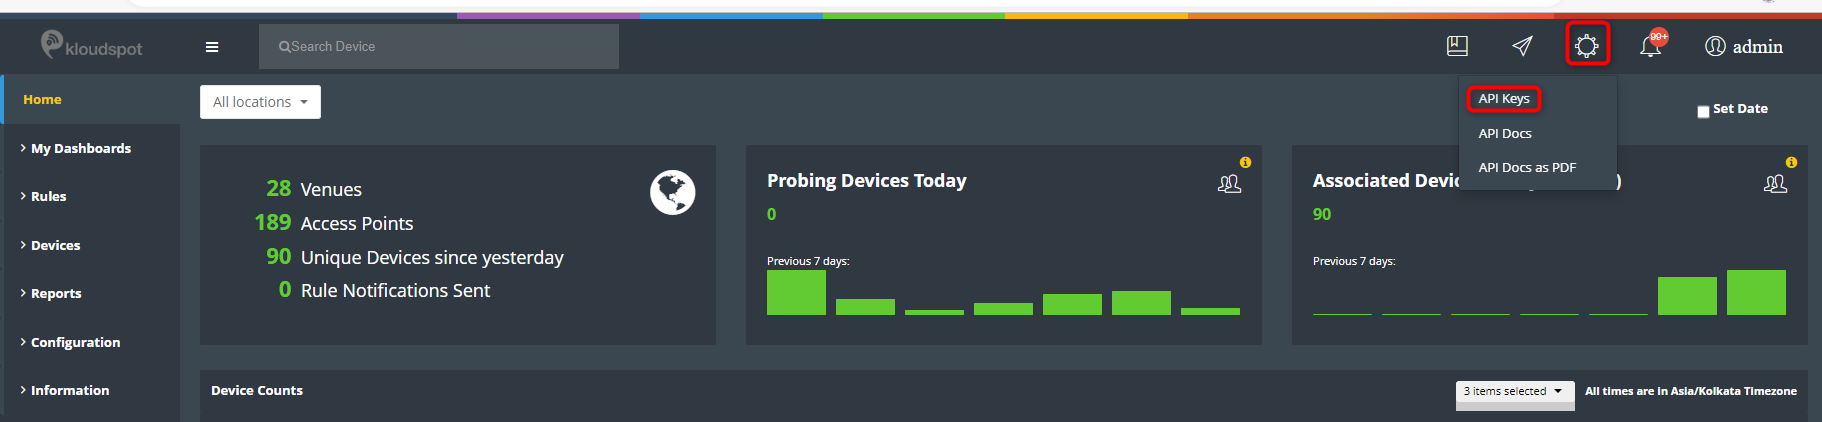
REST API Documentation and Access Keys
Offers access to the documentation and access keys for the platform’s RESTful API. This feature allows for integration with external systems and custom development.
Notification
Enables instant alerts and updates for critical events.
Side Menu Features
Home
The main overview page provides a snapshot of essential information and statistics. This page serves as a starting point for users to get an instant overview of the platform’s current status.
Dashboards
Allows users to create and customize their own data views. Dashboards can be configured to display specific information and metrics tailored to individual preferences and needs.
Rules and Actions
It enables users to configure rules that trigger specific actions within the platform. For instance, setting up a rule to send an SMS notification when an unknown user is detected.
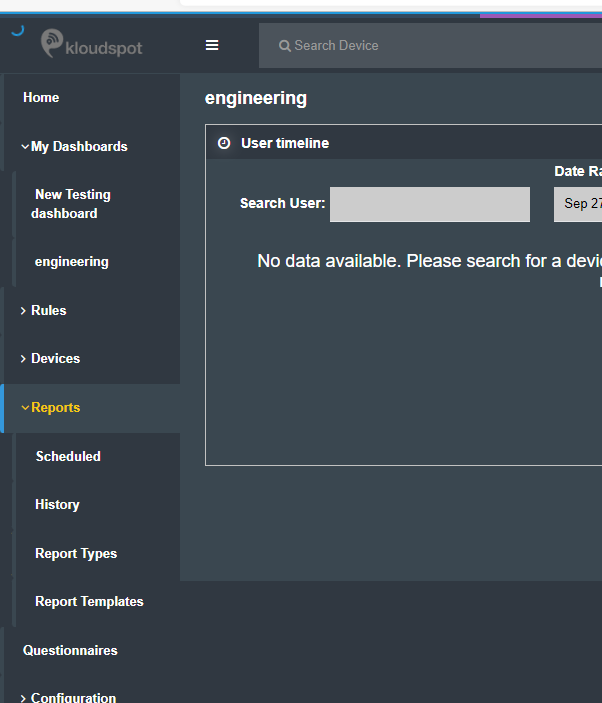
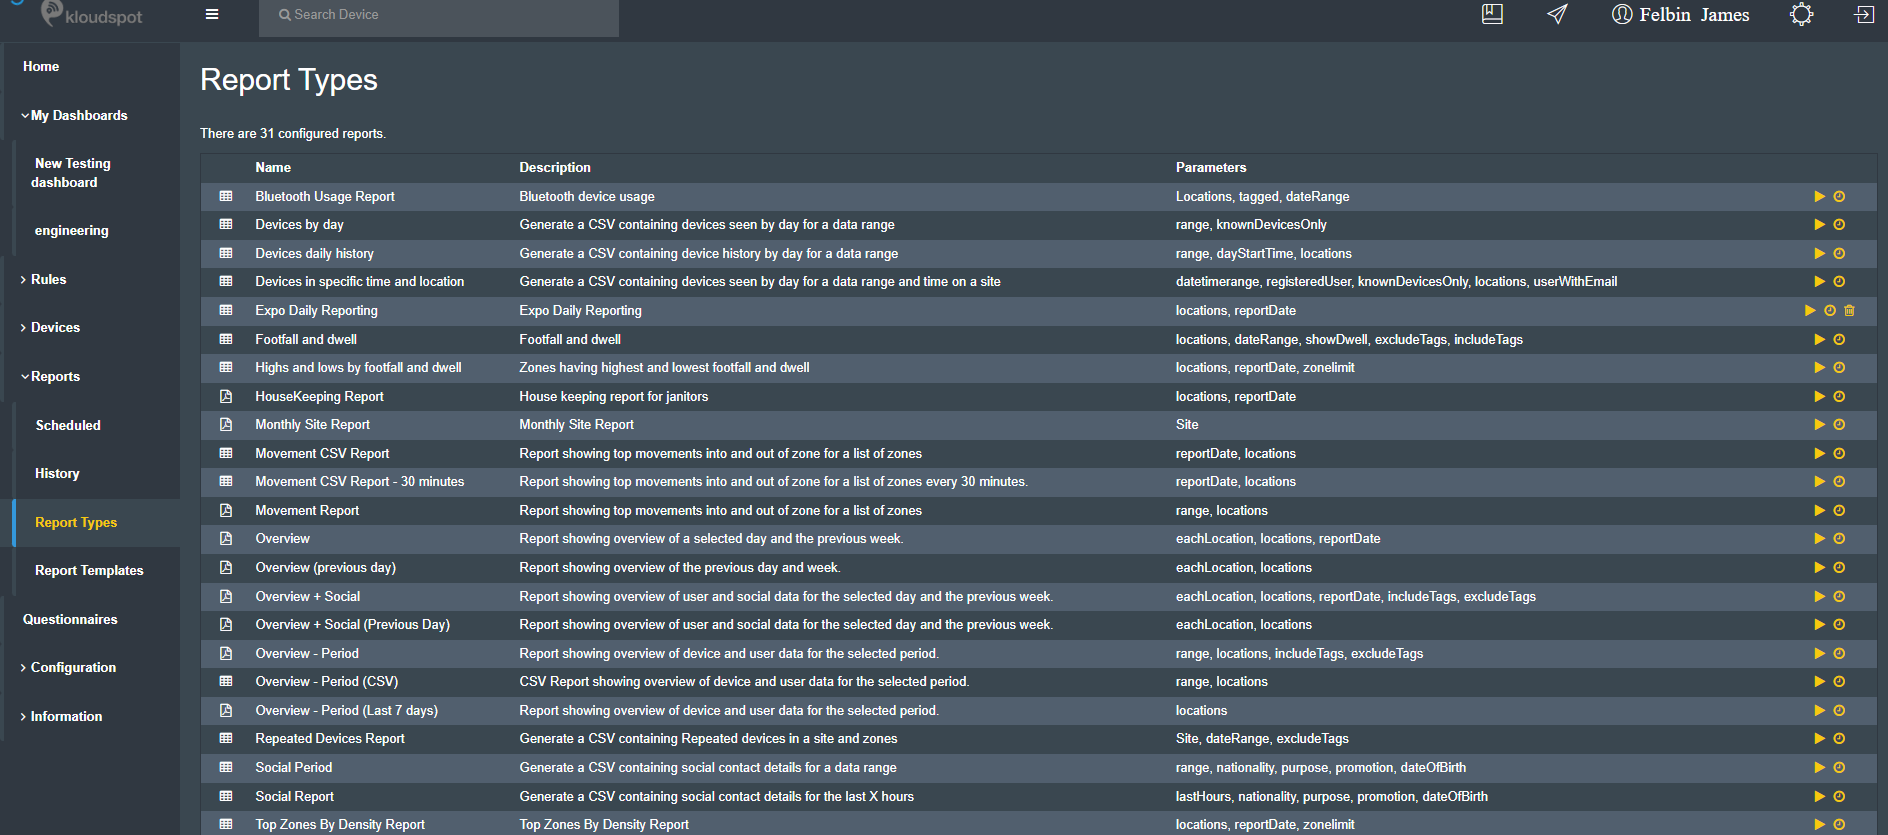
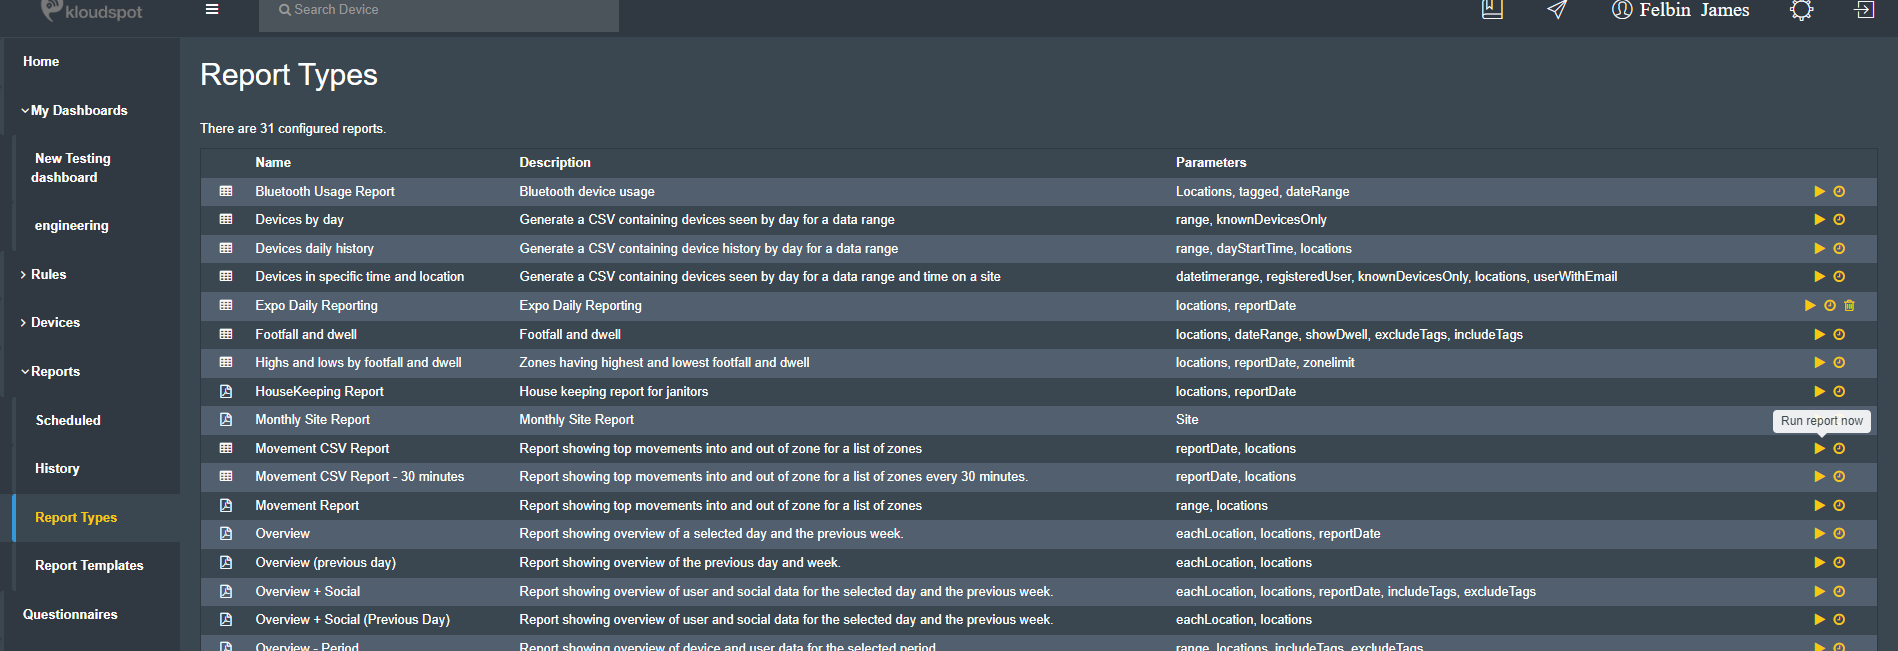
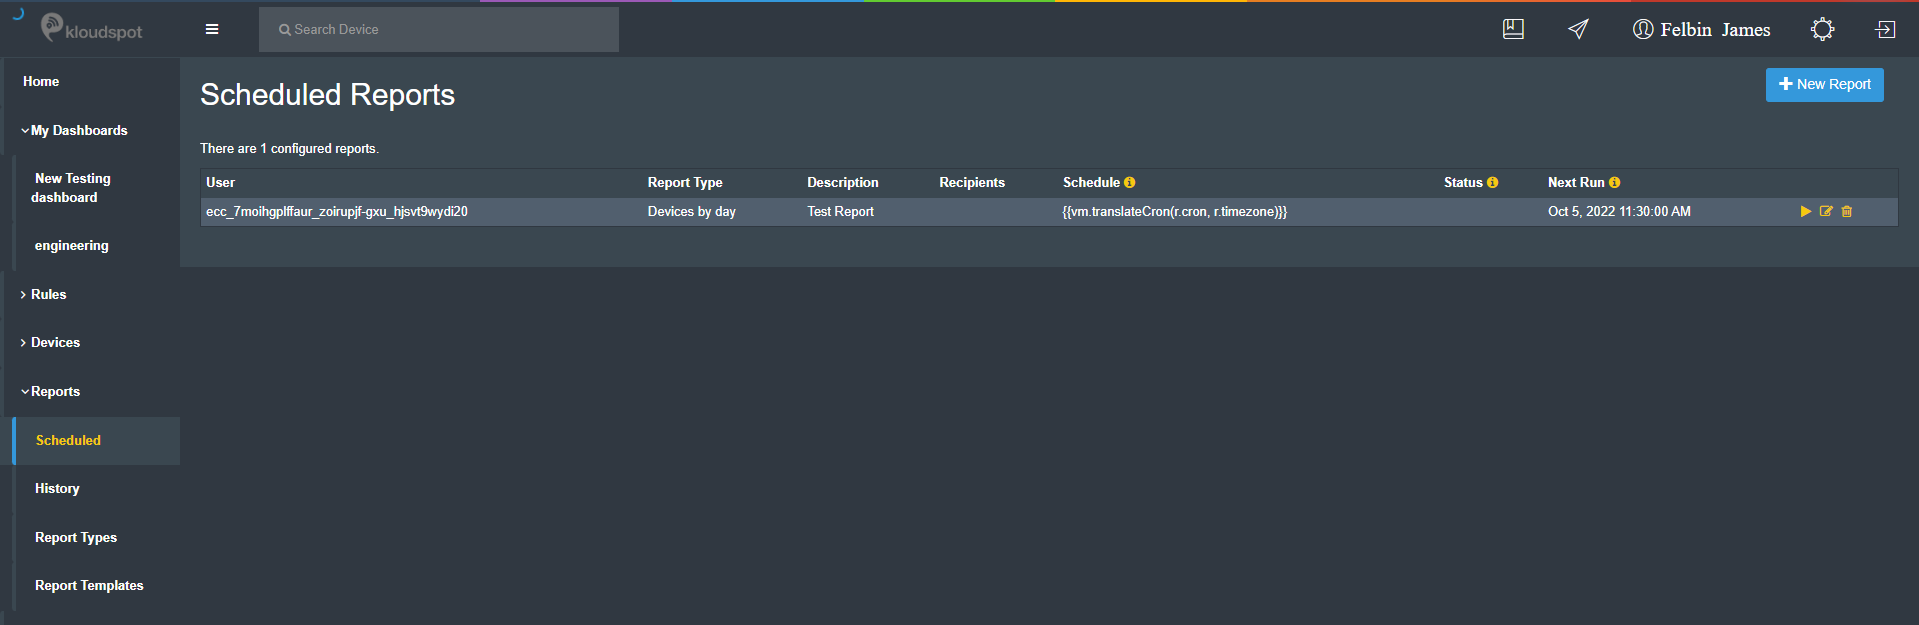
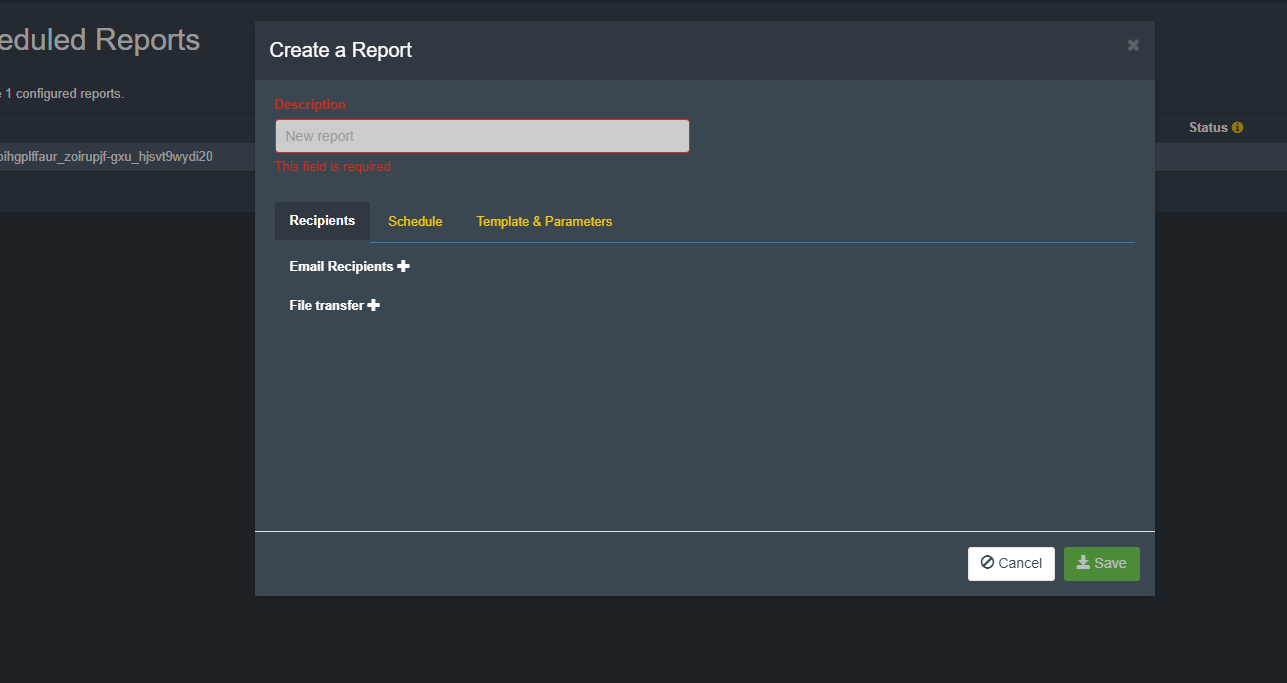
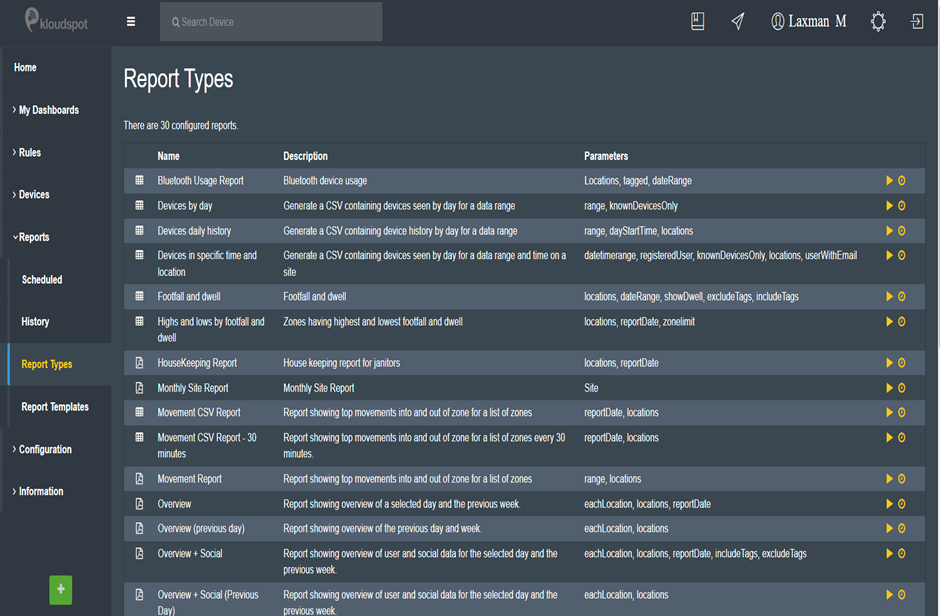
Reports
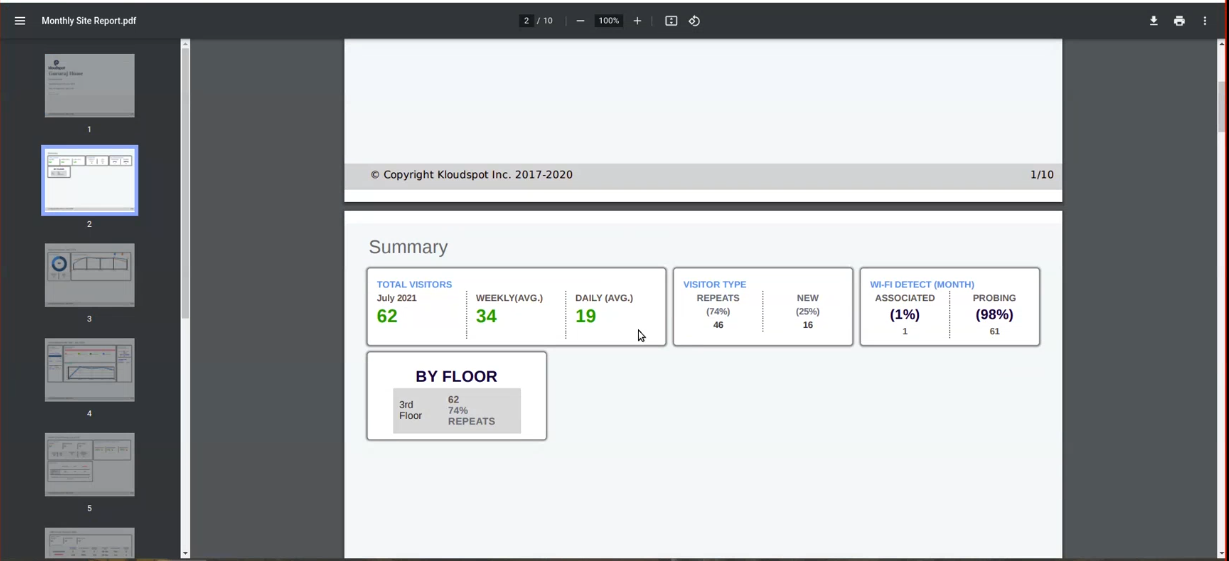
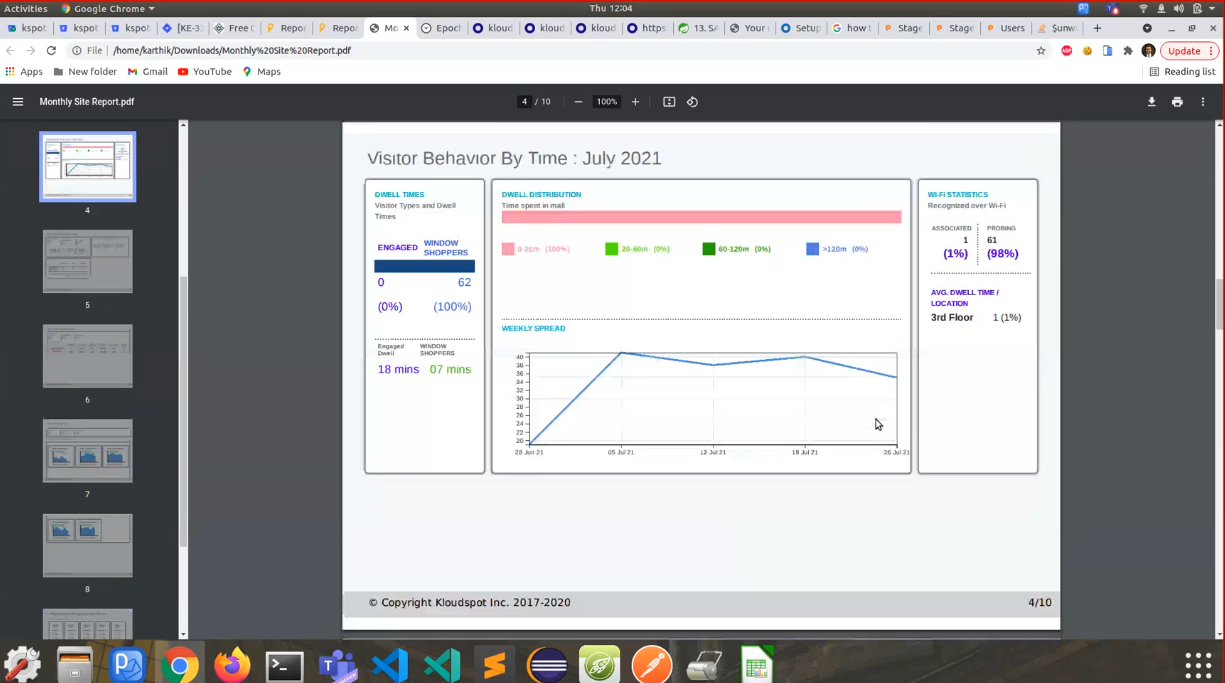
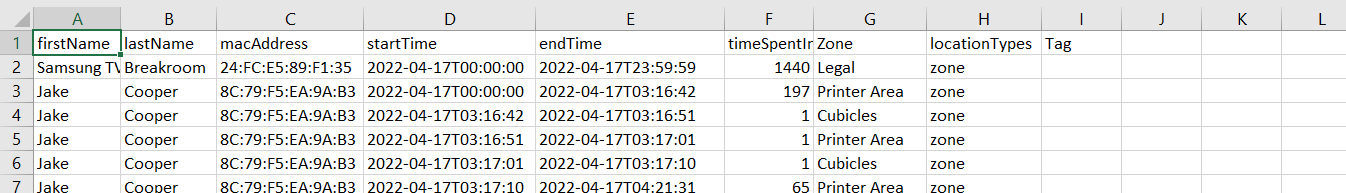
Facilitates the generation and scheduling of reports in both PDF and CSV formats. Reports provide valuable insights and summaries of platform data for further analysis and decision-making.
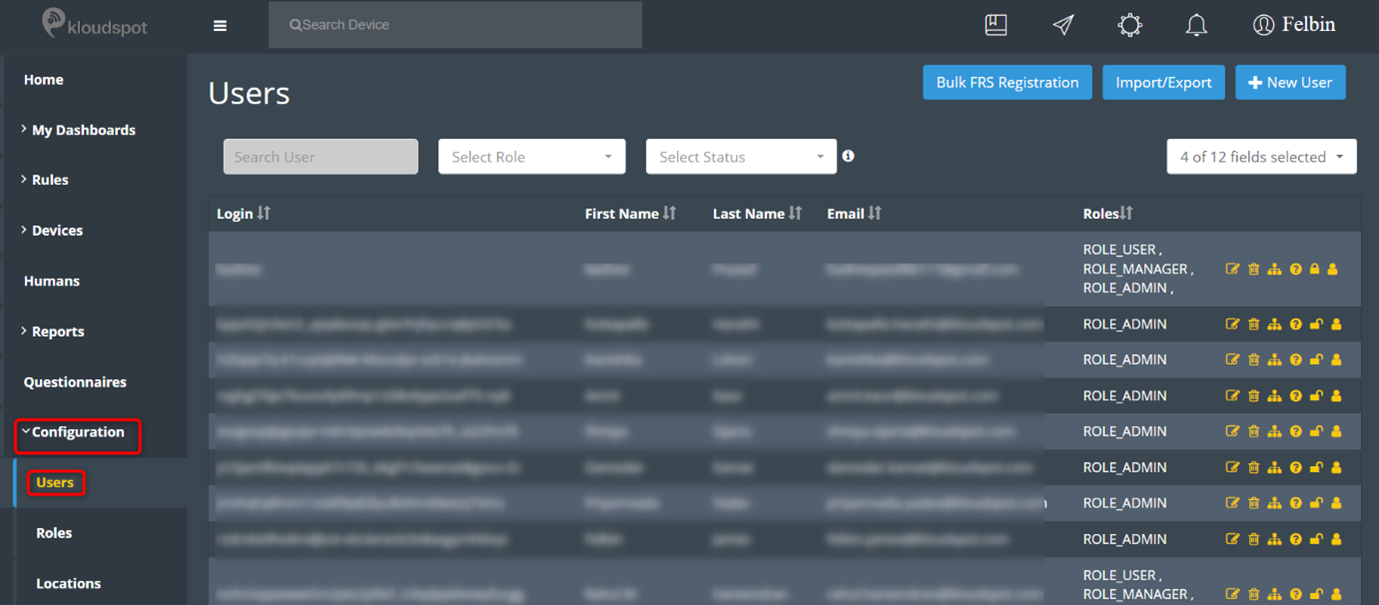
Configuration
Provides access to system configuration settings. This section allows users to customize and fine-tune the platform to suit their specific requirements and preferences.
Information
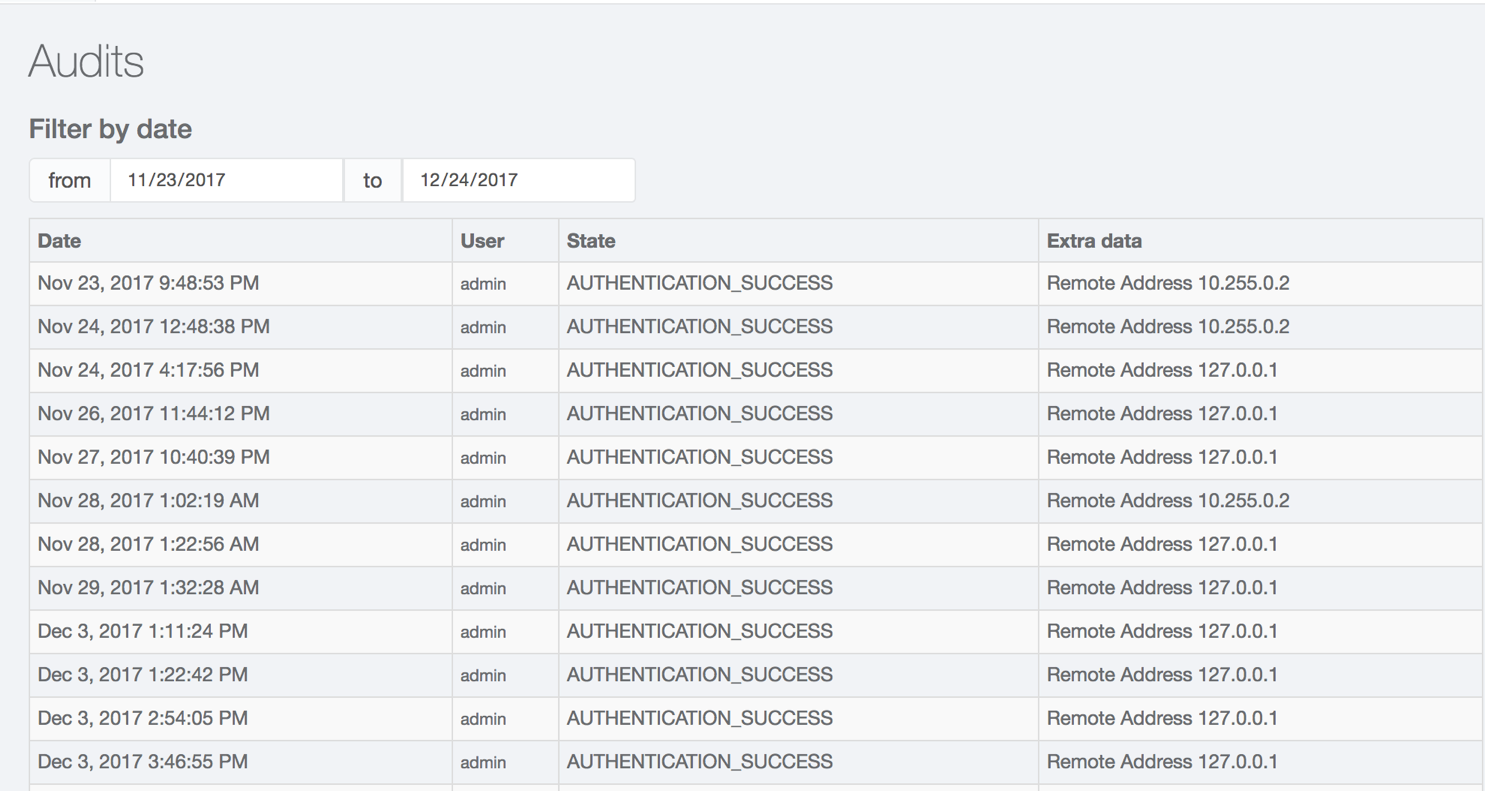
Offers access to system information, including audit logs and other pertinent details. This section provides transparency and visibility into system activities and events.
Next, you can integrate other applications to Kloud Insights as per your needs. Check out the Integrations section to learn how to do this.
Integrations
This section provides a detailed guide on how to integrate a range of technologies, from WiFi and BLE devices to IoT sensors and management applications, ensuring a cohesive and efficient ecosystem for your organization. Explore the integration options available and unlock the full potential of KloudInsights for optimizing your network performance and data analysis.
Once you’ve logged into KloudInsights, the next step is to integrate it with KloudManage. To do this, please refer to the Integrating with Kloudmanage section.
Please refer to the API documentation to understand how to create a new API for integration.
KloudInsights provides an easy way to connect with third-party applications through its Application Programming Interface (API). This documentation will guide you through the process of creating and testing APIs in KloudInsights.
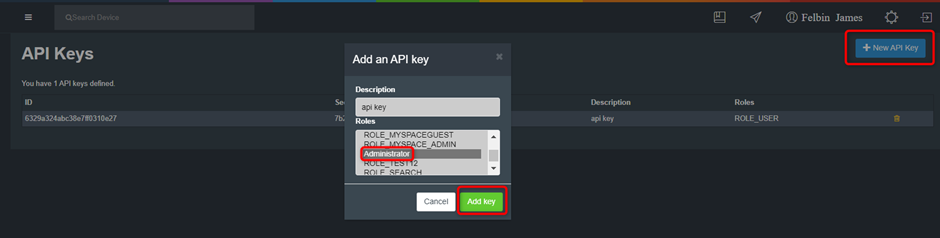
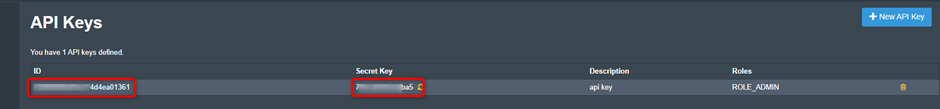
Create a new API key on KloudInsights.
Log in to the KloudInsights.
Navigate to Settings > API keys
To create a new API key, click on the +New API Key button and enter
a description in the ensuing popup window. Next, select the appropriate roles
and click on the Add key button to finalize the process.
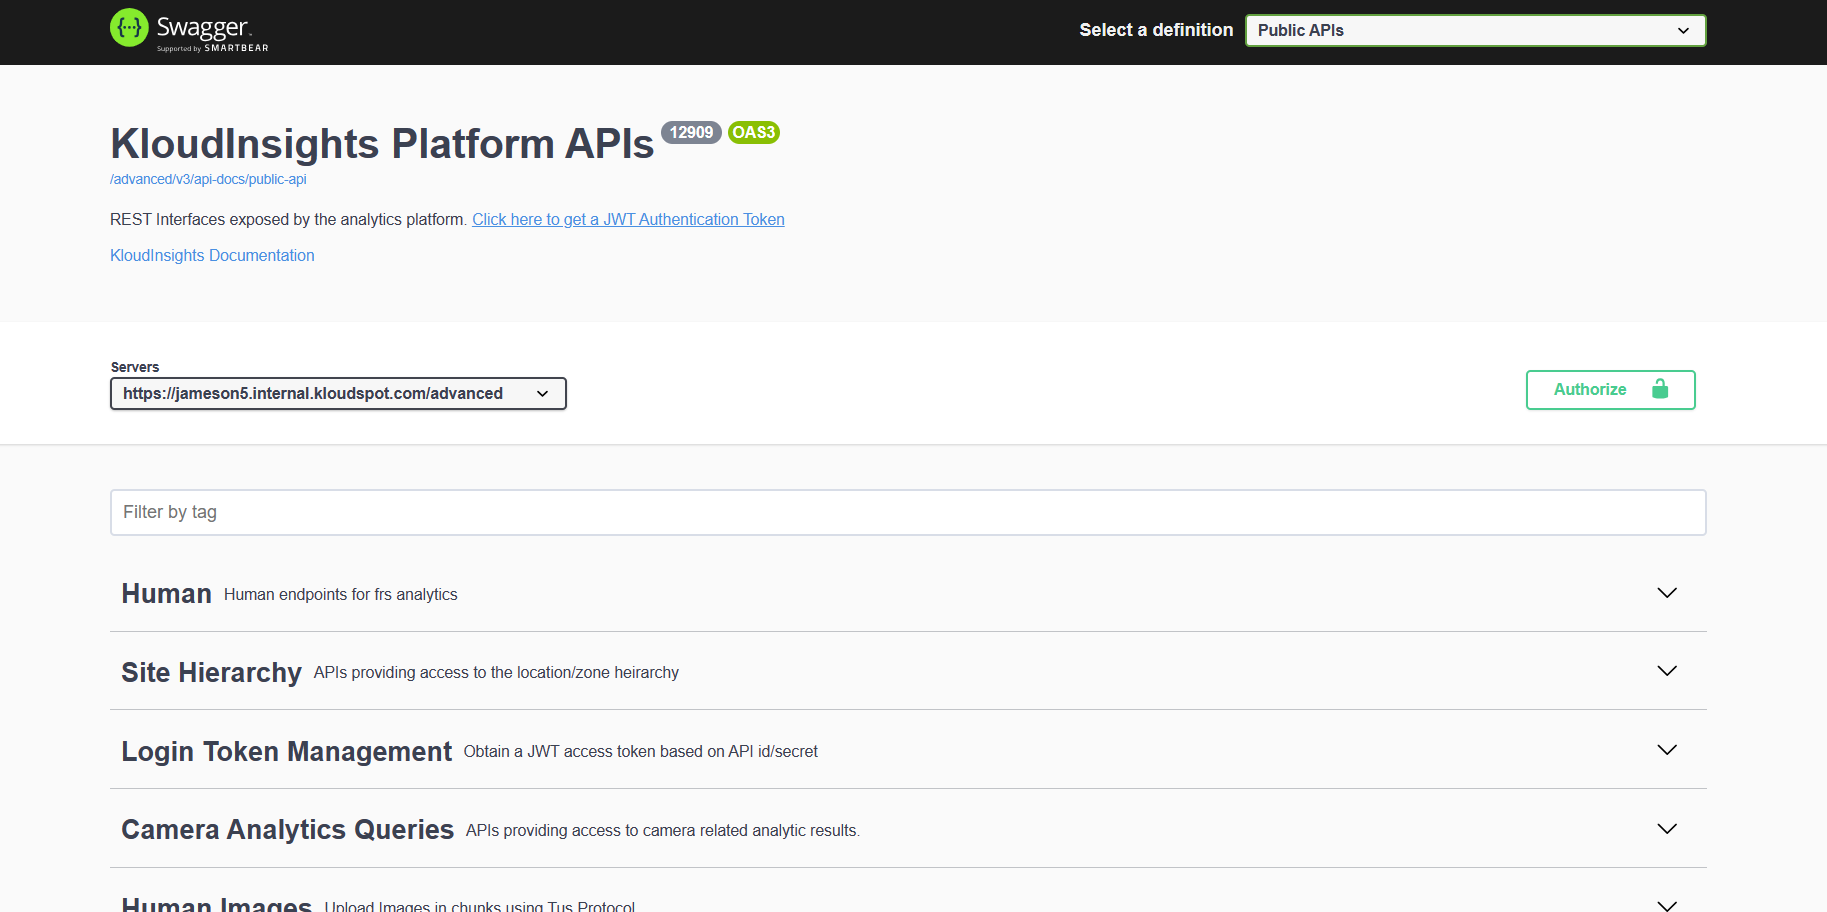
Test your API
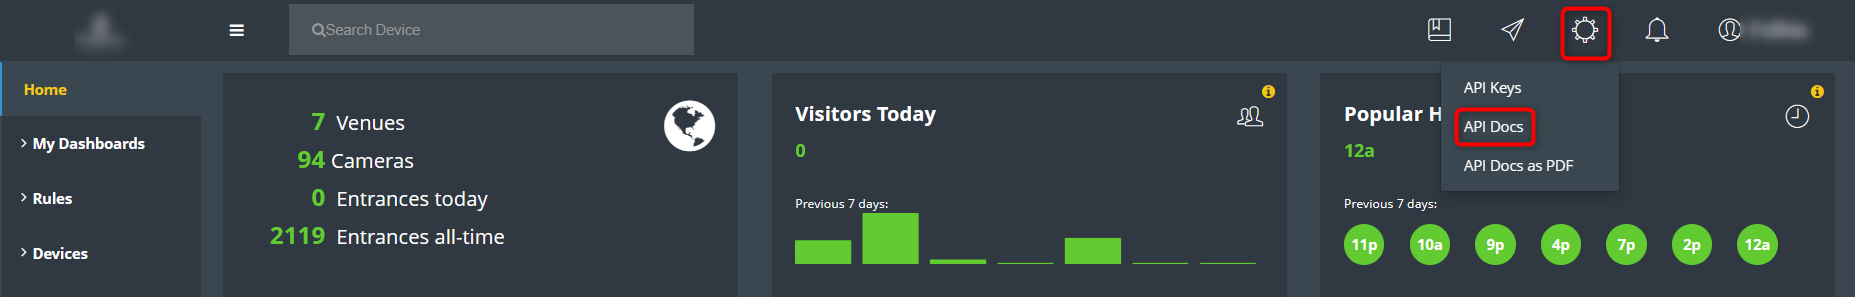
Click on the API Docs button located in the API section.
In the window that opens, you can test the API you have created using the relevant tag.
You have successfully created and tested an API in KloudInsights. This API can now be used to connect KloudInsights with other third-party applications, enhancing its functionality and integration capabilities.
Integrating with KloudManage
Step 1: Create a new API key on KloudInsights.
Refer the API document to know how to create and test an API.
Step 2: Integrate KloudInsights into the KloudManage
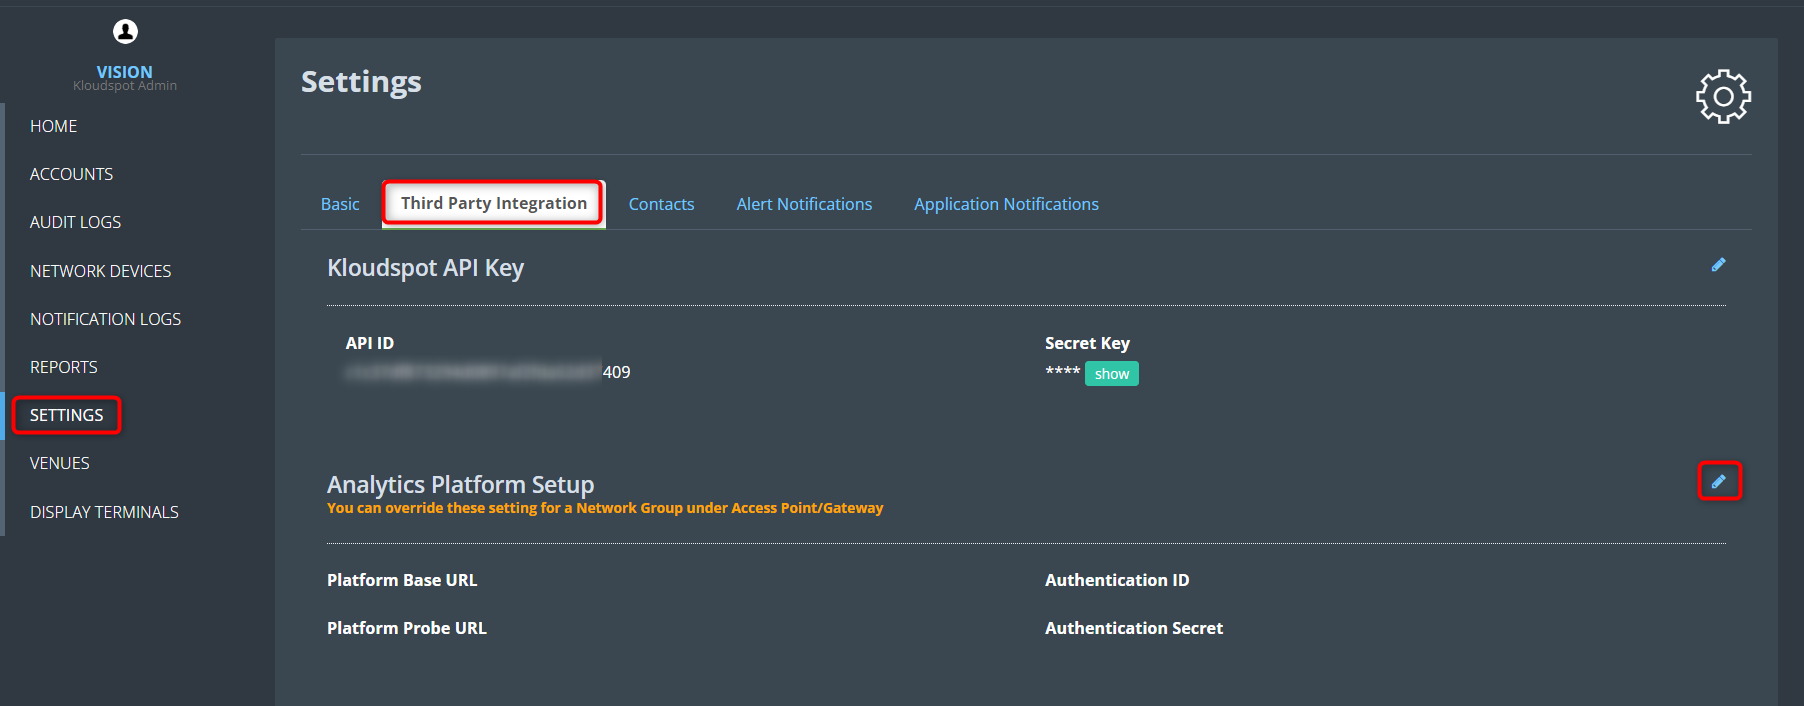
Log in to KloudManage.
Navigate to Settings > Third Party Integration.
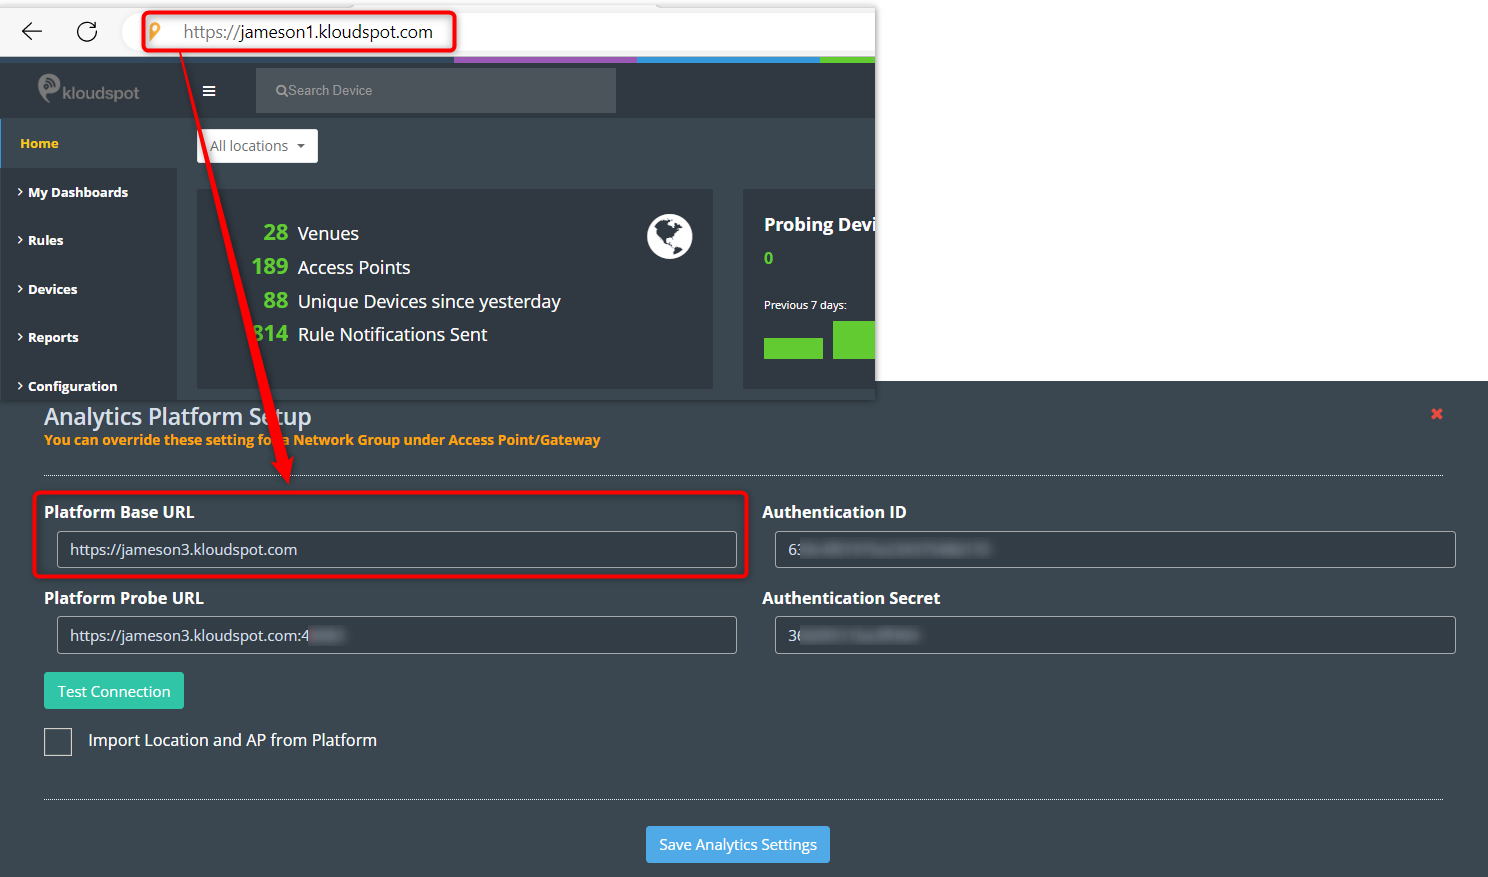
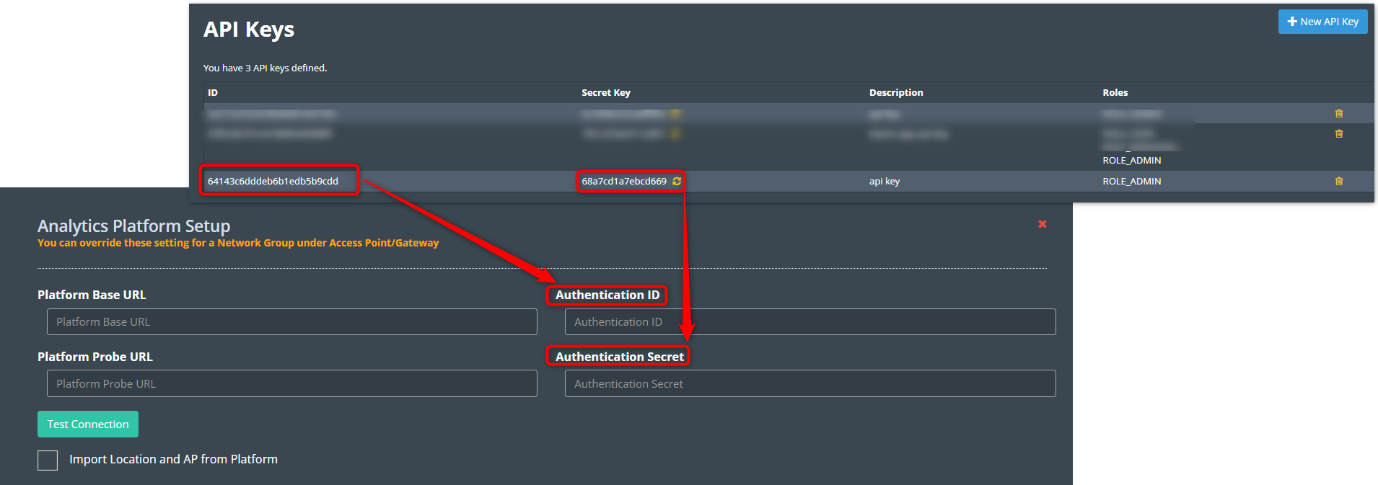
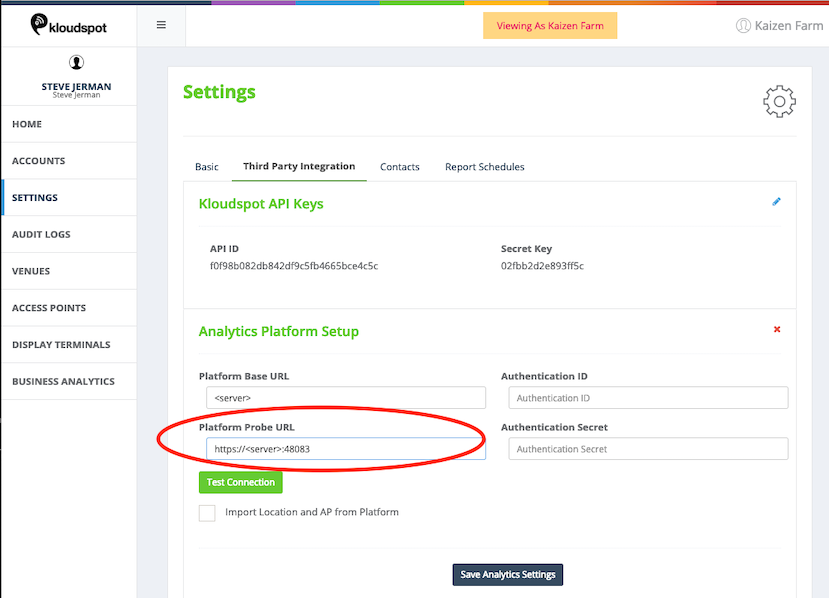
In the window that opens, click on the edit button next to Analytics Platform Setup. Then fill in the following.
Platform Base URL: Enter your company’s KloudInsights URL here.
Platform Probe URL: Enter your company’s KloudInsights URL and port code.
The port code is available from the admin.
Authentication ID: The authentication ID can be obtained from the
Insights API key section.
Authentication Secret: The authentication secret also be obtained
from the Insights API key section.
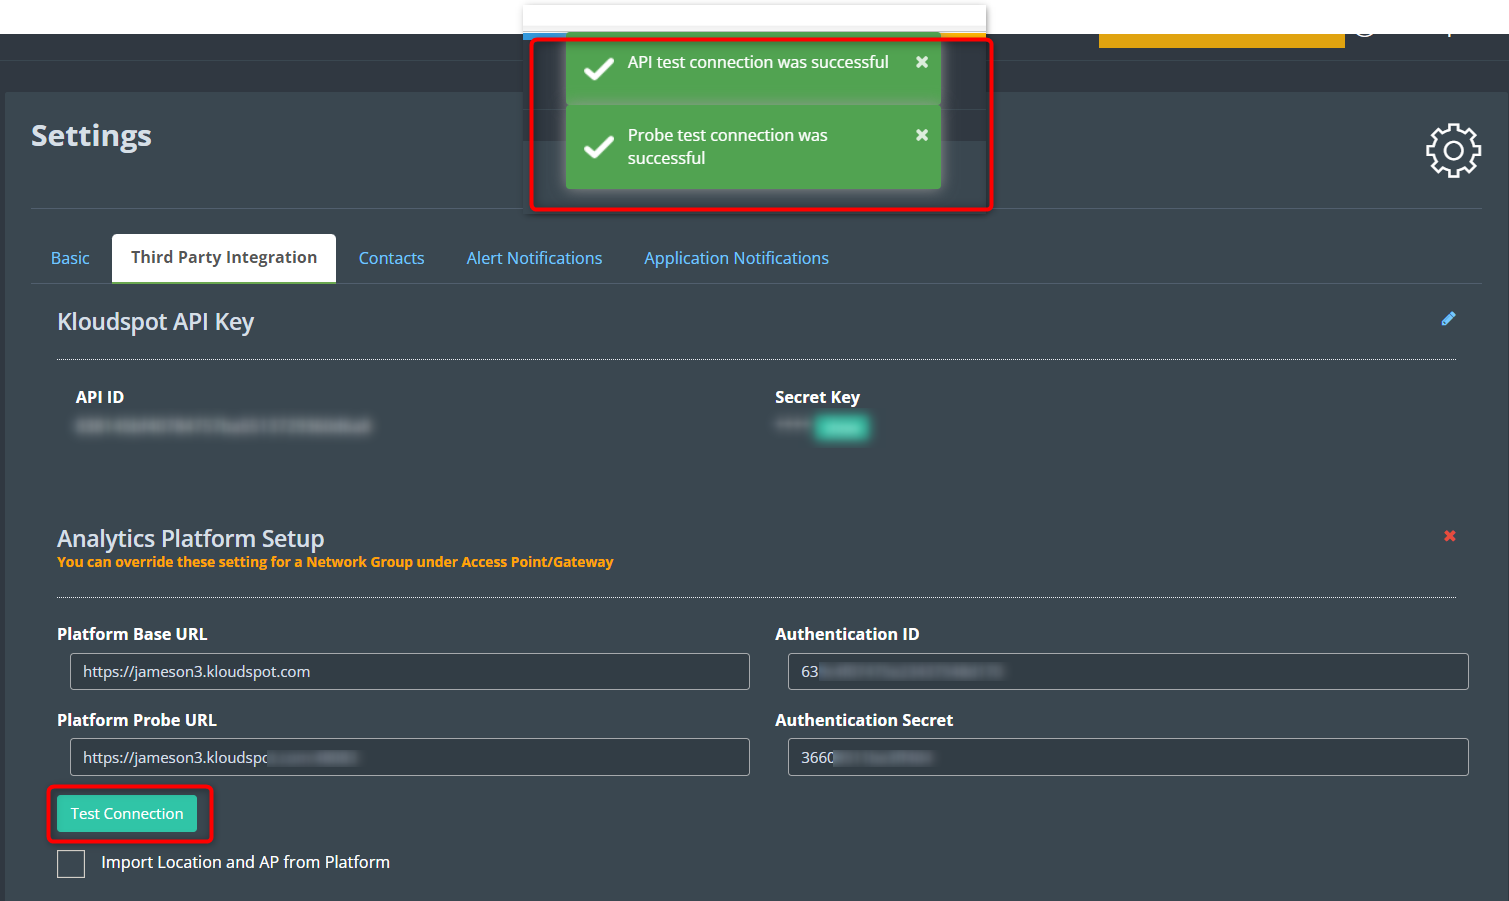
4. In the event of a successful connection, you will receive a notification
confirming the same. However, if the connection is not successful, please
recheck Step 3 for verification.
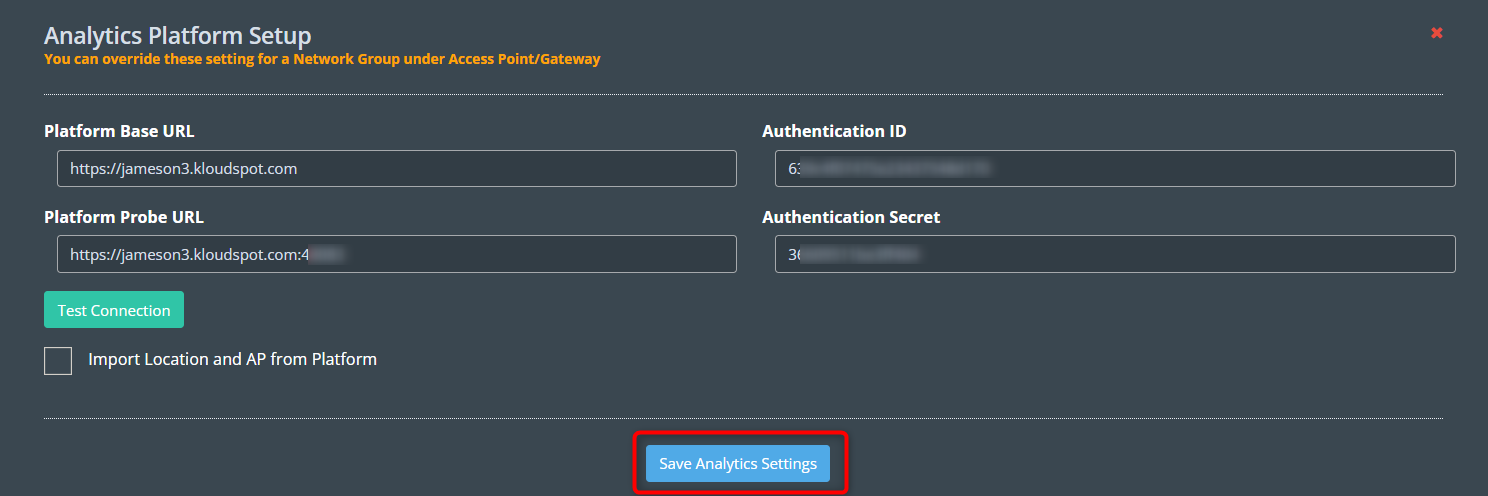
5. Finally, click the Save Analytics Settings button to save the changes.
Step 3: Integrate KoludManage into the KloudInsights
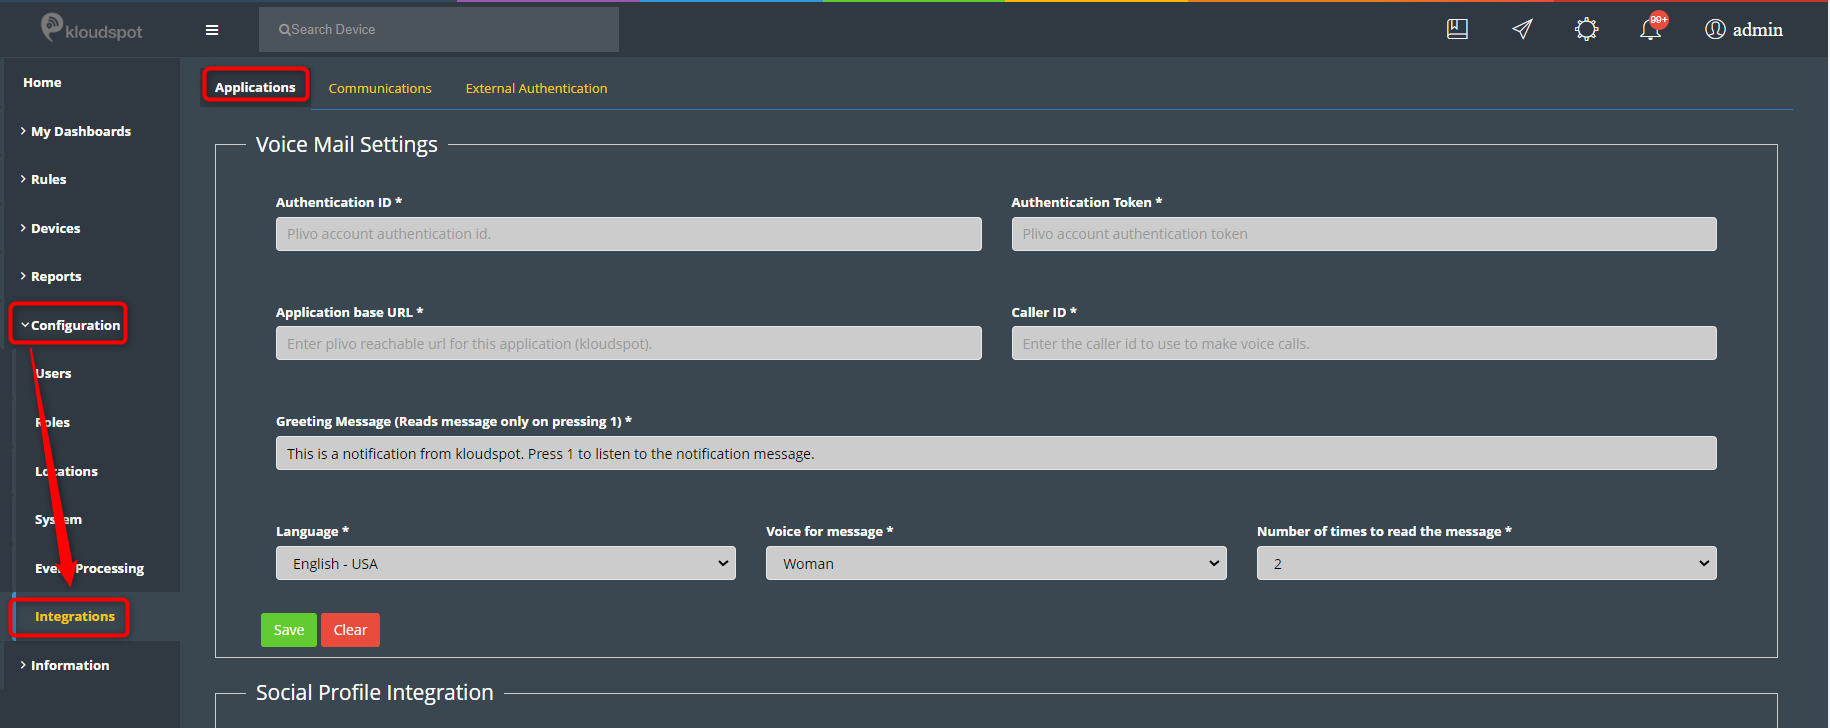
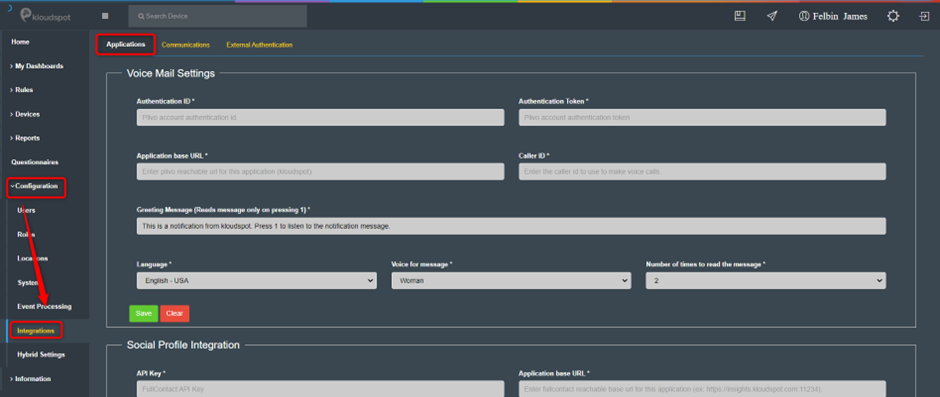
1. Log in to KloudInsights.
2. Navigate to Configuration > Integration > Application.
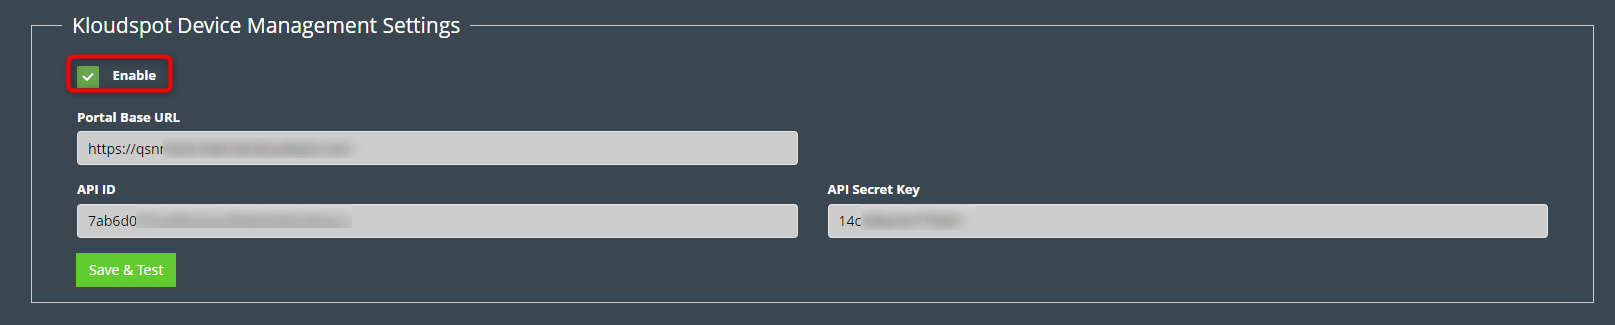
3. Then scroll down and find the Kloudspot Device Management Settings
section.
4. Then check the Enable button and enter the following:
Portal Base URL: Enter your company’s KloudManage URL here.
API ID: The API ID can be obtained from the Vision’s “ Third Party Integration” tab.
API Secret Key: The API Secret Key can also be obtained from the Vision’s “ Third Party Integration” tab.
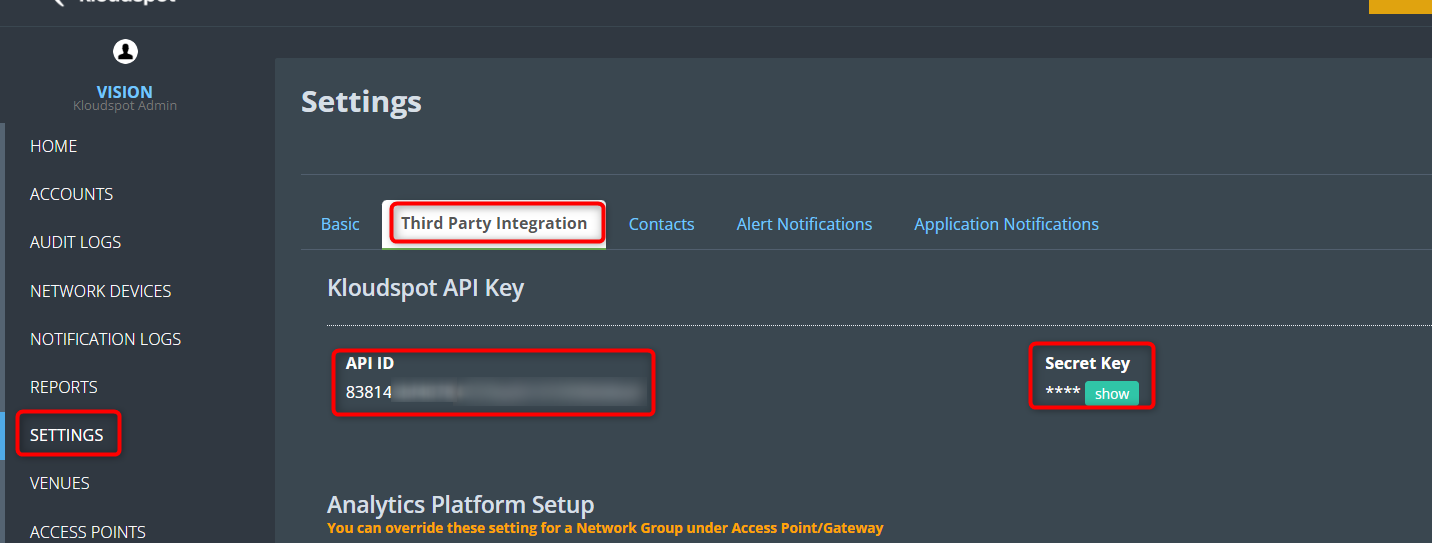
5. To get an API ID and Secret Key follow the steps below.
Log into KloudManage.
Then navigate to Settings > Third Party Integration. Here you can find the API ID and API Secret Key.
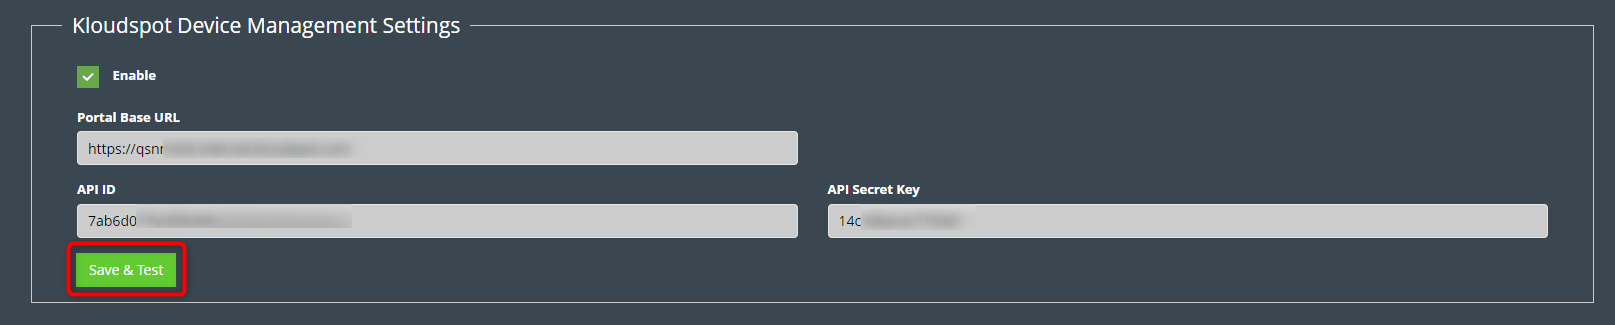
6. Finally, click the Save and Test button to save and test the
connection.
7. In the event of a successful connection, you will receive a notification
confirming the same. However, if the connection is not successful, please
recheck Step 4 for verification.
Meraki Integration
About this Document
The purpose of this document is to display how these various solutions offered
by Kloudspot can be integrated with Meraki.
It covers the following Kloudspot solutions that can be integrated.
KloudPortal - Wi-Fi Guest Portal
KloudCampaign - Campaign management
KloudVision- Camera Integration
KloudInsights - Event Wi-Fi & BLE receivers
Guest Portal and Campaign Management
Guest Portal
Captive Portals or Guest Portal is a multi-channel platform that enables you
to connect and engage with visitors on your premises.
Guest portal screen page allows to create and design a customizable portal
from scratch.
A sample of templates will be given as an option to choose to create a portal,
layout will be available as a part of the template.
Following are the steps to configure the Guest Portal.
Captive Guest Portal Configuration
The captive portal is designed with following terms that are described below:
Social Authentication
Needs authentication using social platforms as Facebook, Twitter, Linked,
Google and Instagram.
Email Authentication
It will ask the user for their Name and Email address to be able to
Authenticate.
SMS Authentication
It asks the user for their contact number and authenticate over a SMS.
Multi device Token
A token is generated by the admin. User can use this token for authentication.
One or multiple devices can be configured to use a single token.
Username/Password
A guest user can be created by generating a unique username and password which
is used for authentication. One or multiple devices can be configured using
individual username/password combination.
Third party
Kloudspot can integrate with various third-party applications such as,
ERP
PMS
POS
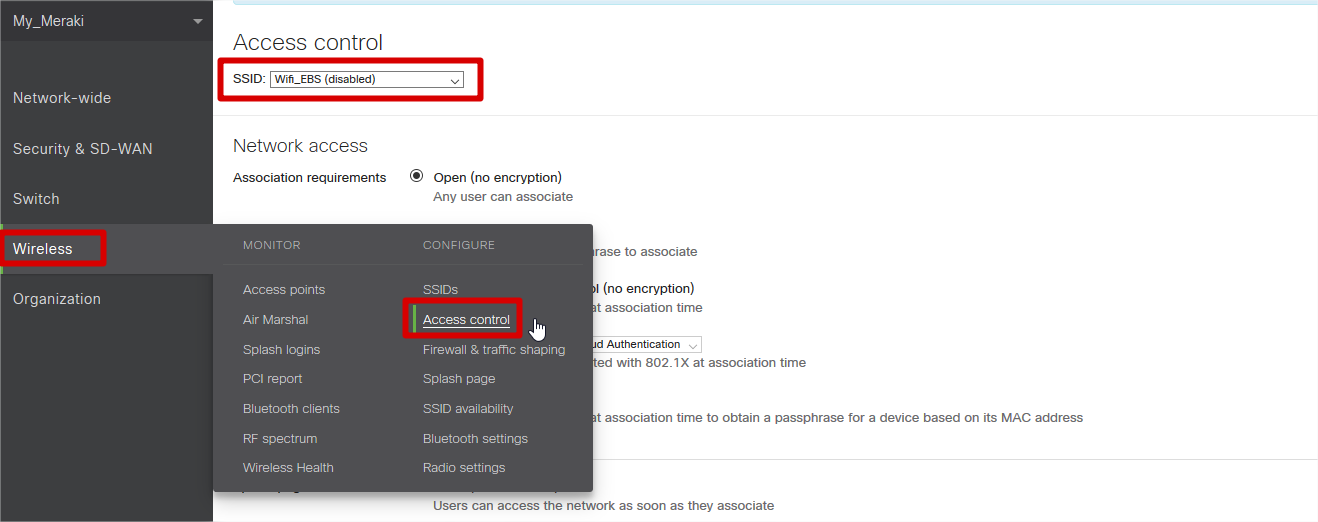
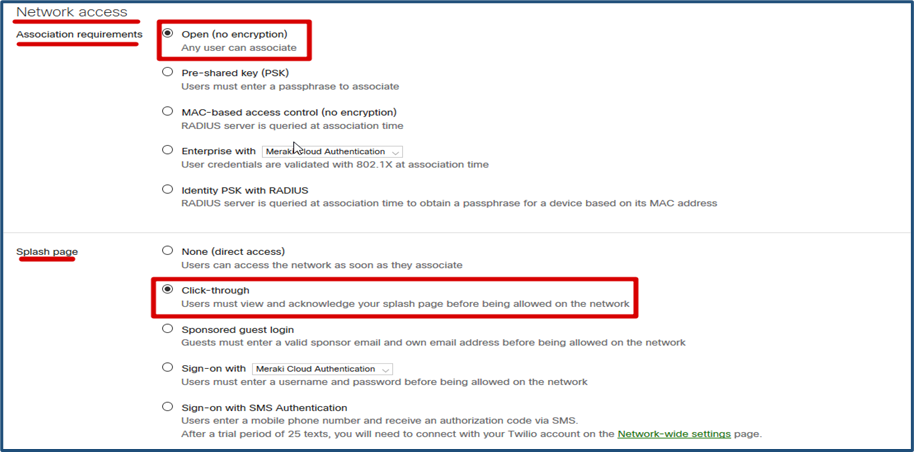
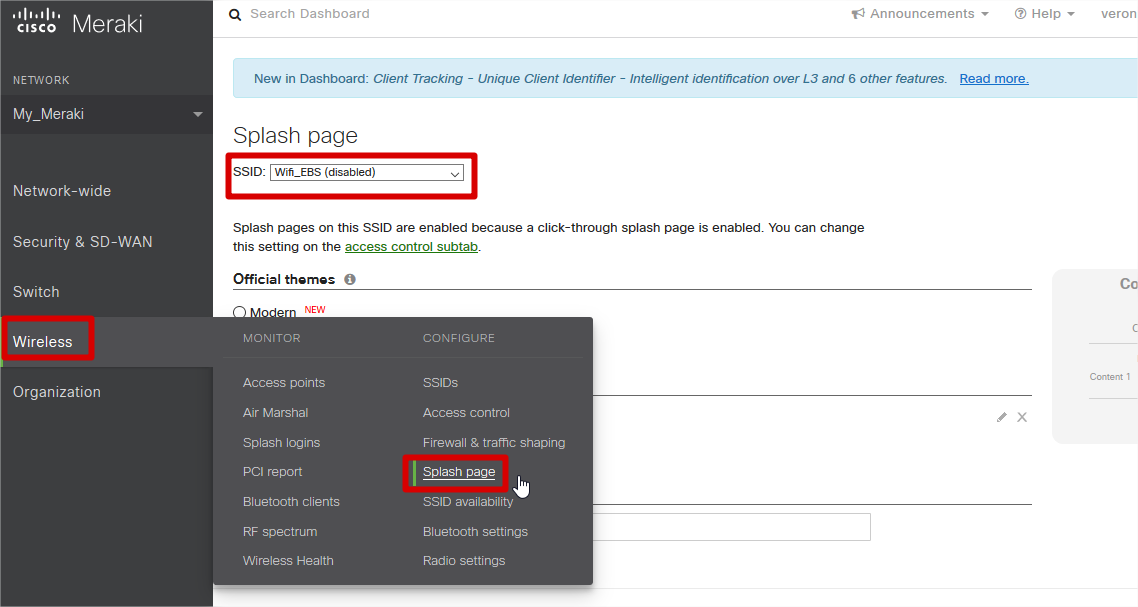
Enter ‘Wireless’ à ‘Access Control’
Choose the SSID to which the Captive portal will be configured.
In Network Access, Association requirement, Select ‘Open (no encryption)’.
In Network Access, Splash page, Select ‘Click-through’.
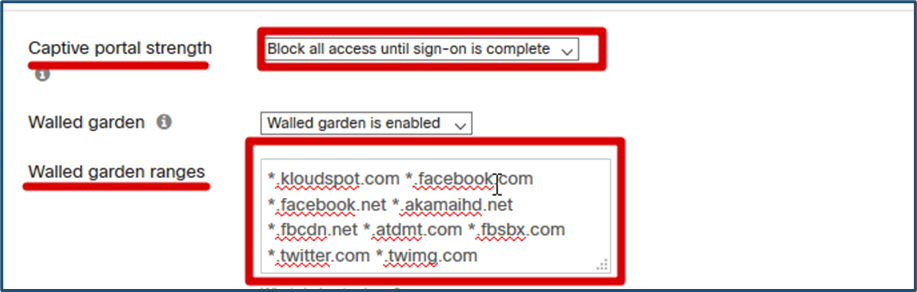
In Network Access, Captive portal strength, Select ‘Block all access until sign-on is complete’
In Network Access, Walled garden ranges, Enter the following domains:
Kloudspot has a powerful workflow and policy driven campaign management
solution centered mostly around Wi-Fi which offers both online and offline
campaigns. These online campaigns can be created and managed using Captive
Guest Portals. Creation of Captive guest portals is extremely easy using one
of many templates supported by KloudCampaign Editor. KloudCampaign Editor can
help guide the user to create a captive portal for the hardware they have
deployed on the network.
For more details on how to create Campaigns, resources and configure dynamic
policies and workflows, please refer to relevant Kloudspot documentation.
Meraki WiFi and BLE Event Receivers
The Kloudspot Analytics Engine can receive events from many types of Meraki
Wi-Fi network.
One or more of event sources can be configured in the ‘Configuration - >
System -> System Configuration’ screen.
Validate the Receiver URLs
Most of the receivers below ‘push’ to a specific URL. The protocol
(HTTP/HTTPS) used varies depending on the source. We support both HTTP and
HTTPS protocols using port 48082 and 48083. Refer to the specific data source
below to determine the correct one to use.
If you have set a SSL certificate for the UI, that will be used instead of the
self-signed one.
You can check access to both the HTTP and HTTPS urls with a ‘ping’:
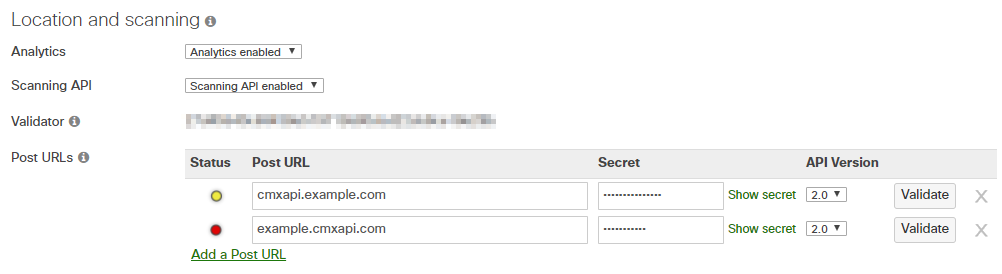
Meraki Location Scanning API
To enable, the Meraki scanning API feed, follow the following steps:
When enabling the API, set the following parameters:
API Version : 2
Post URL : https://{server}:48083/meraki/{name}
Secret : for example - kloudspot12345678
For ‘{name}’ use a friendly alphanumeric label for the account.
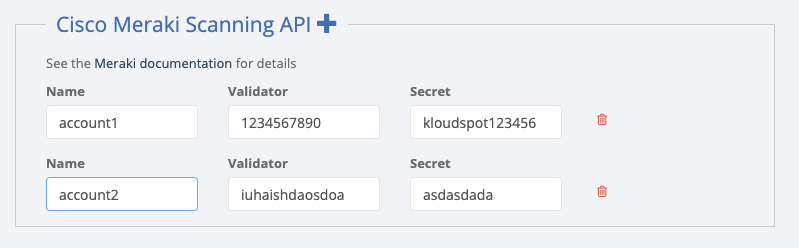
Next go to the Kloudspot Web UI and select ‘Cisco Meraki’ source in the Event Sources.
Add an entry for each account (one is enabled by default) by clicking the ‘+’ sign.
Enter the ’name’, ‘validation’ and secret’ from above for each account and click ‘Save’.
Restart the stream processing job.
Integrating Meraki Cameras
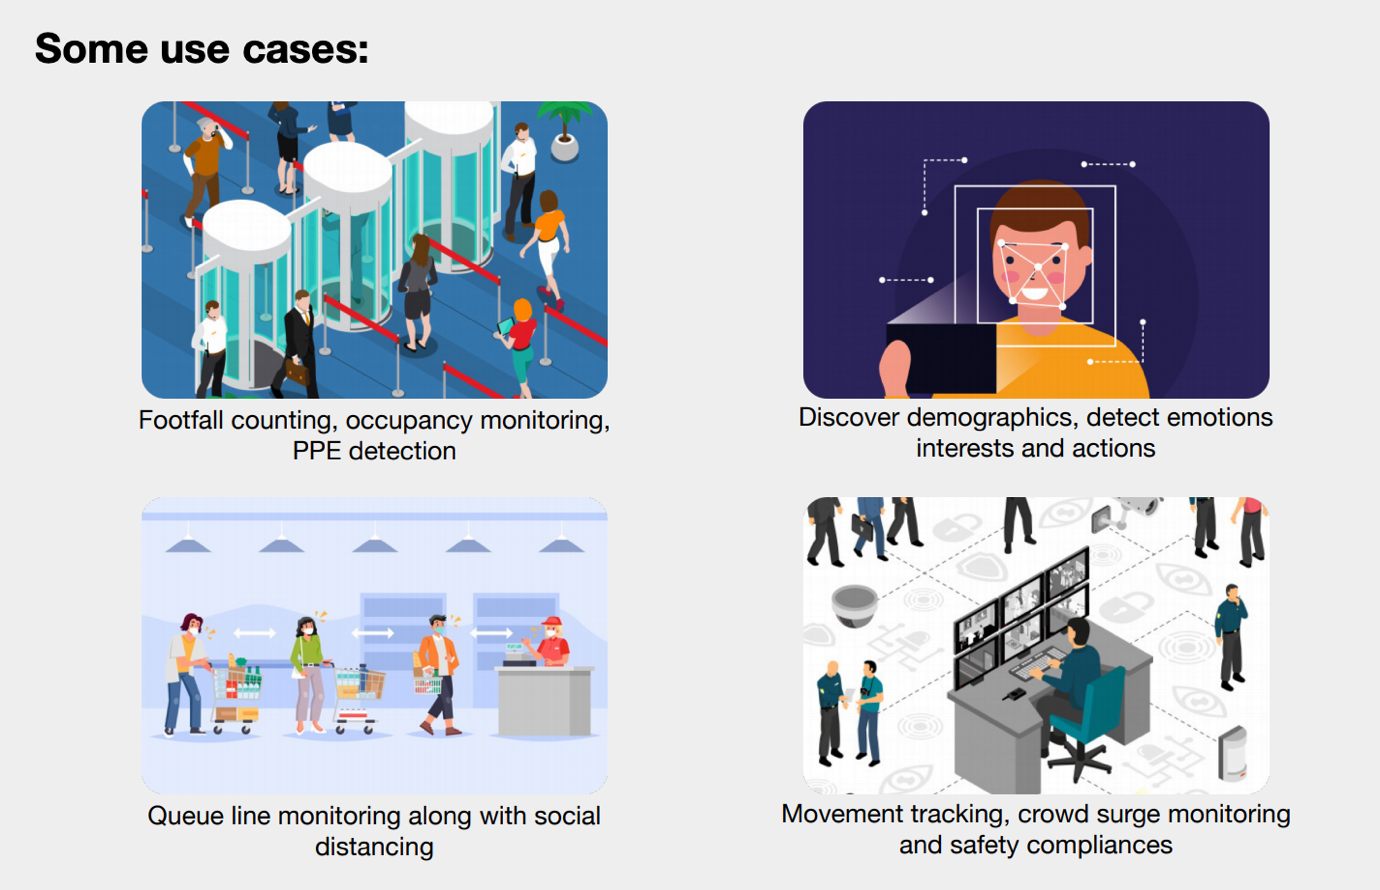
Kloudspot supports integration with both RTSP (MV*2 cameras only) and MV Sense
APIs. RTSP video stream from Meraki second generation camera’s can be streamed
on-prem to Kloudspot vision controller for complex actionable use cases
including Object detection, PPE, Mask, Social distancing, capacity counts and
management, demographics, and fingerprinting.
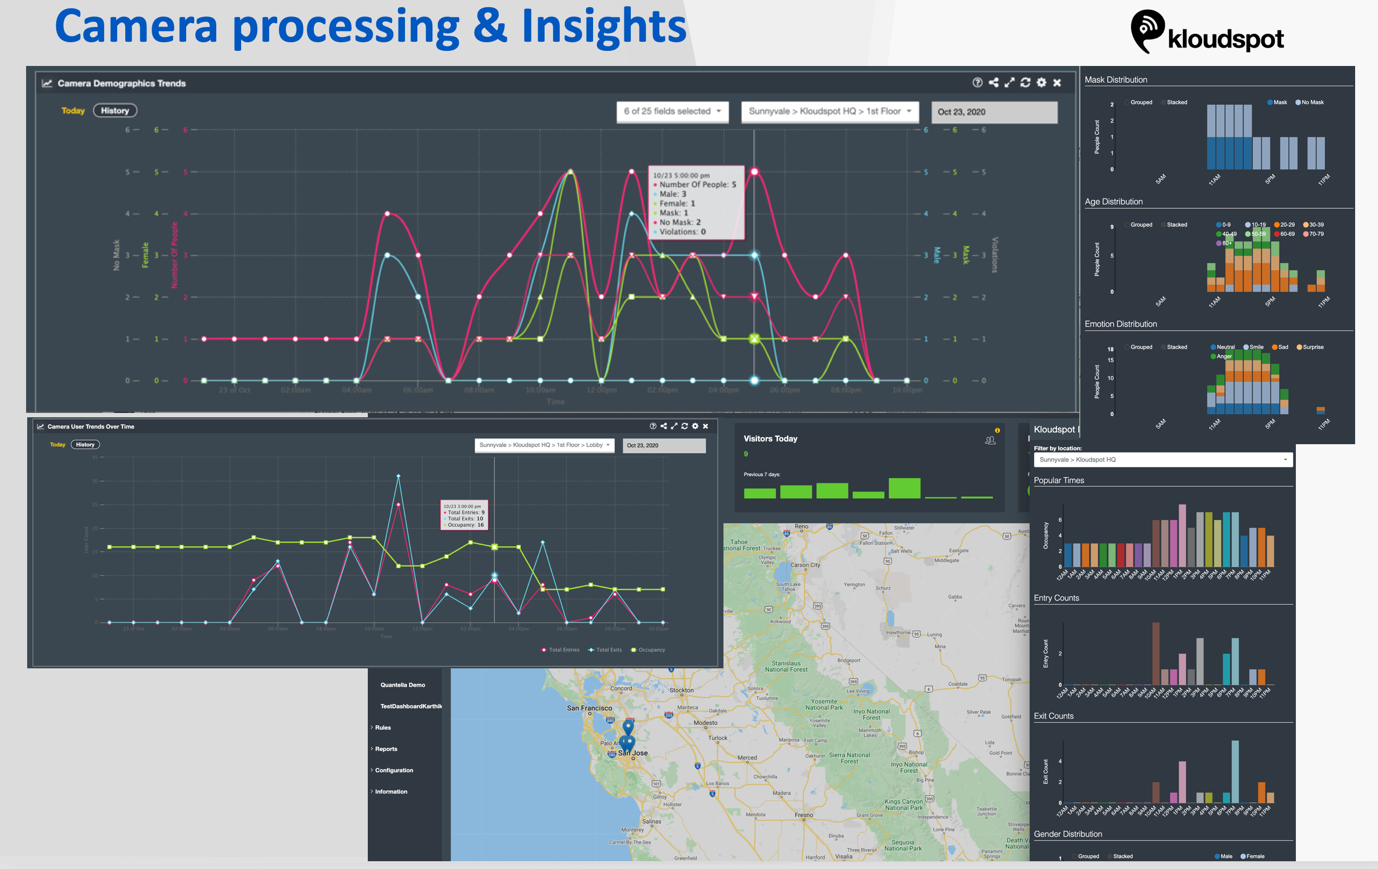
Insights inferred from RTSP stream
For more details on KloudVision __ please check out the KloudVision document.
RTSP Integration
Please refer to Meraki documentation on how to setup Meraki RTSP configuration
to stream live video
Step 1: Port number 6666(TCP) should be exposed to send Meraki camera payloads
to the Insights.
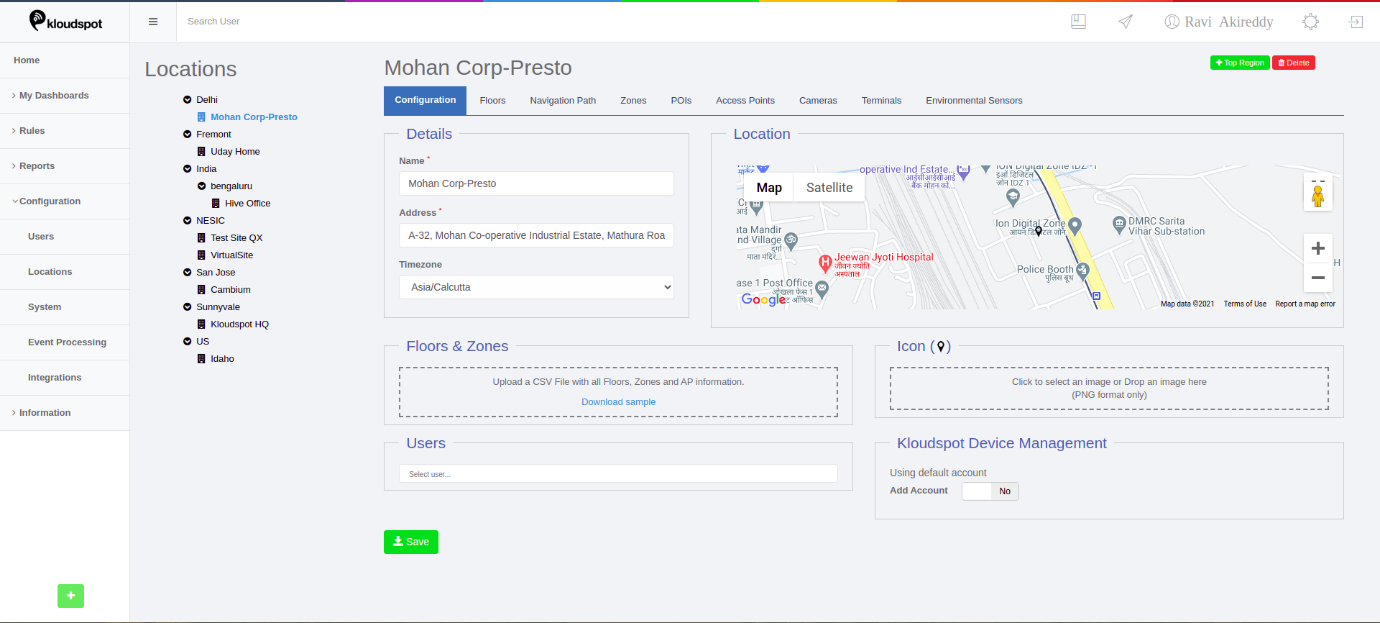
Step 2: On UI, go to configurations and click on locations. Add the location
(Region/site) where the cameras need to be deployed. Then navigate to the
‘Cameras’ section.
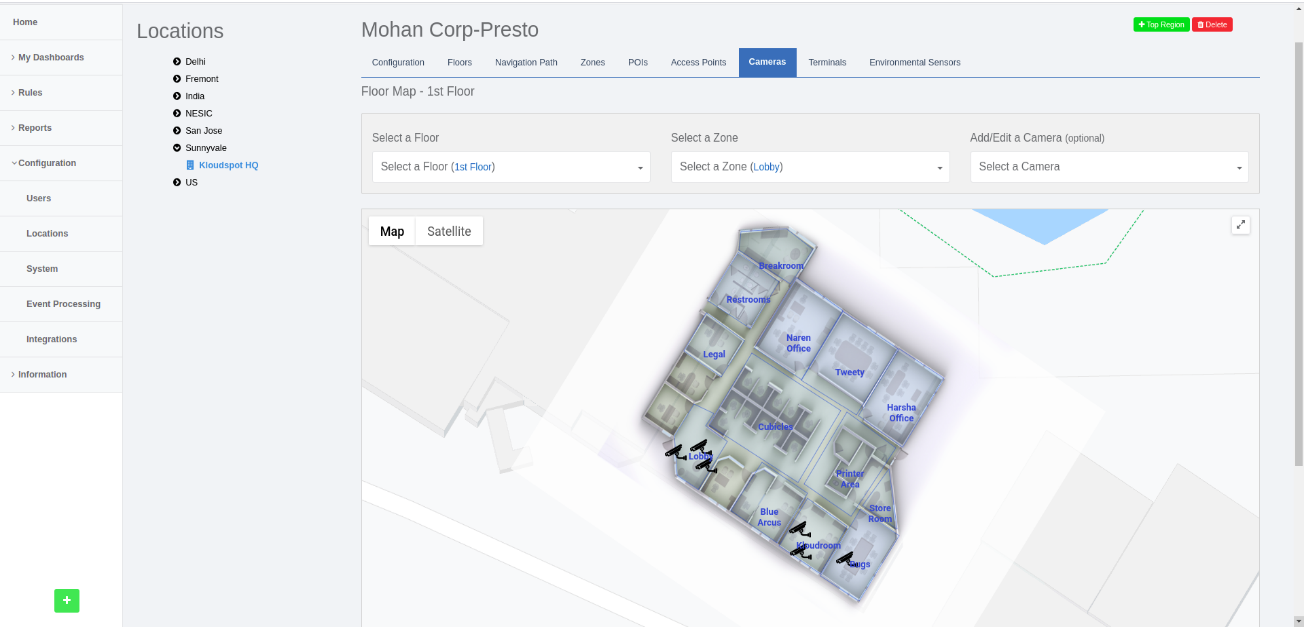
Step 3: Click on the ‘Cameras’, select the floor and the zone to which you
want to add the camera and click on ‘add/edit a camera’ and then click on “Add
a Camera” as shown in figure below.
Step 4: ‘Add/Update Cameras’ dialogue box needs to be filled with following
information.
Choose the vendor as ‘Third Party Camera’.
Enter the Unique Id of the Meraki Camera in ‘camera name’ section.
Upload the image that is seen by the camera in “PNG” format in the “camera Image” section (Image size less than 2MB).
Choose the grid resolution for the camera through the slider (default value is 50px) in the advance settings.
Click on ‘Save’ to add the camera.
NOTE: Grid resolution is the resolution of each grid in pixels the image would
be divided for heatmap calculations.
Adding widgets which use Meraki payloads to the dashboard
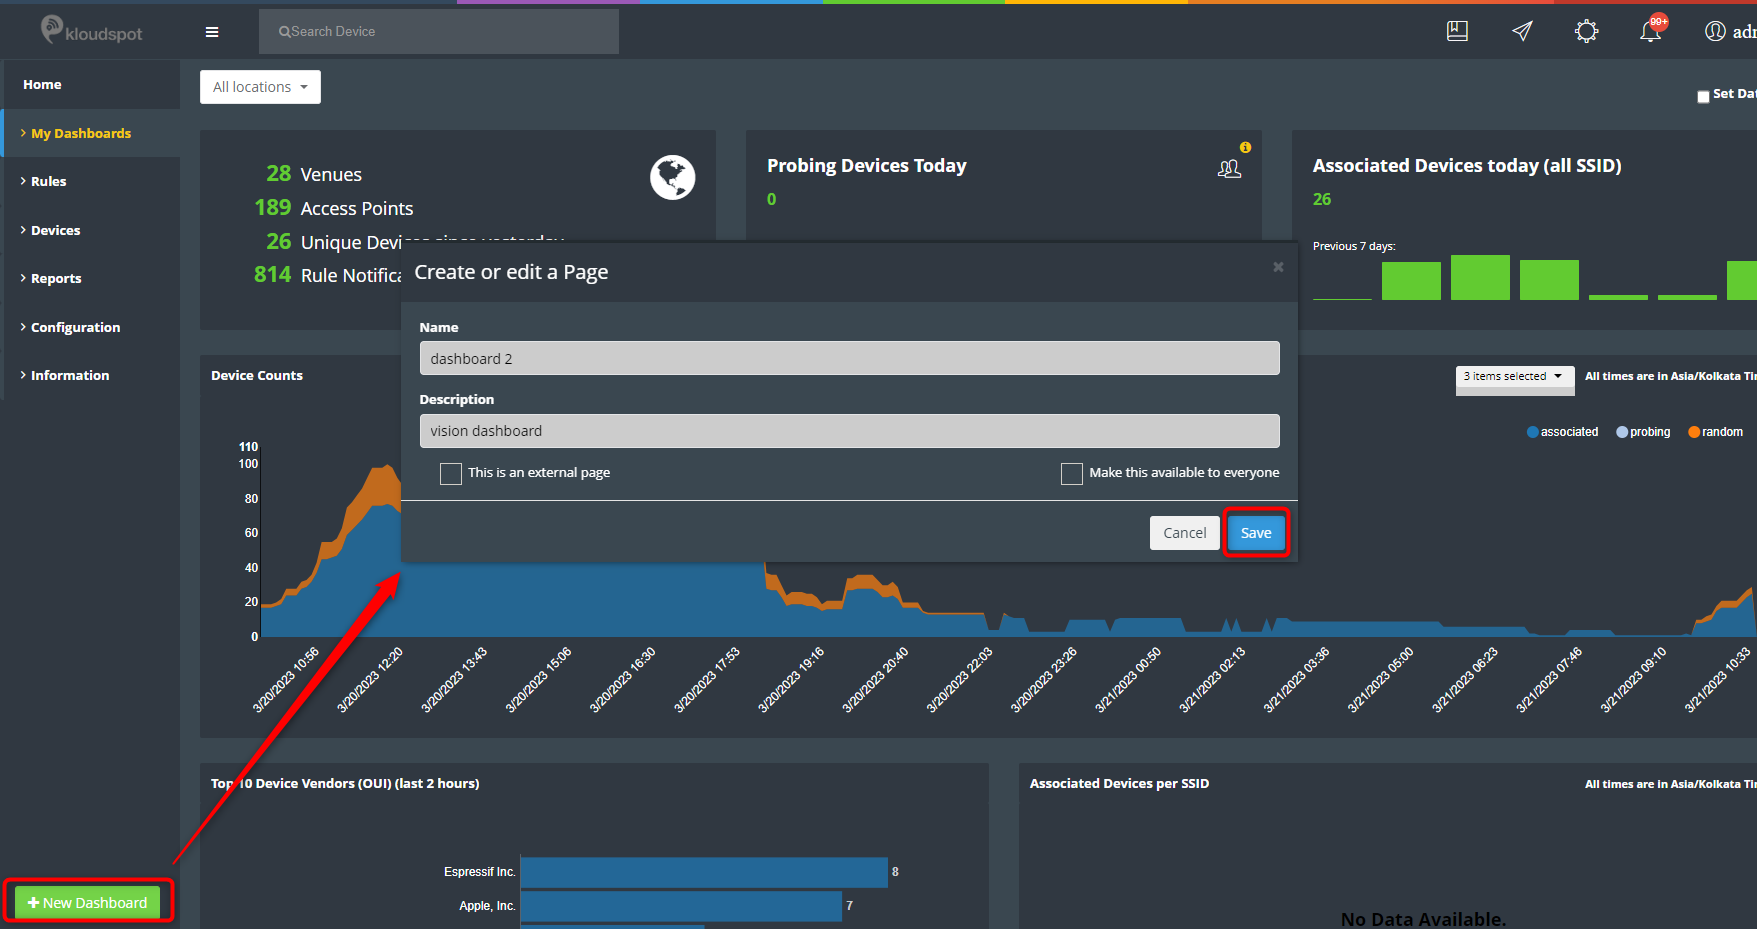
Step 1: On the homepage, navigate to ‘My Dashboards’ and select an existing
dashboard or create a new dashboard.
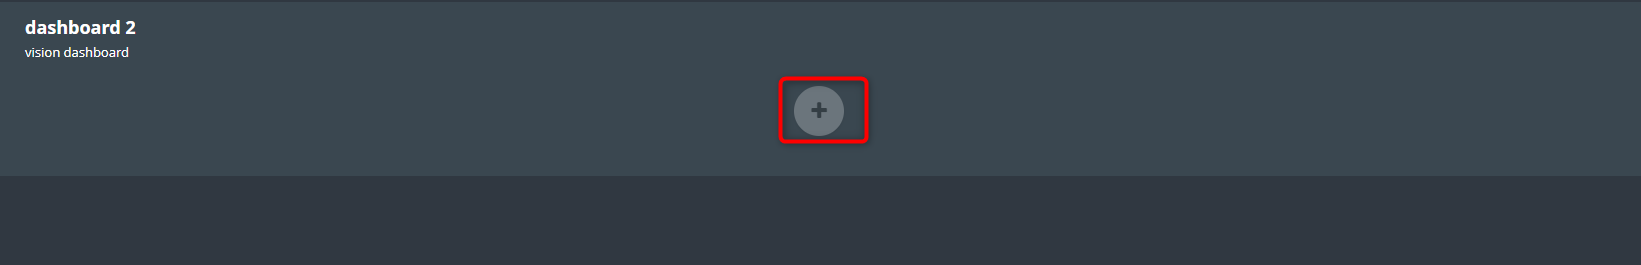
Step 2: On the selected dashboard scroll down to the bottom and click on the
‘+’ symbol to add widgets to the dashboard.
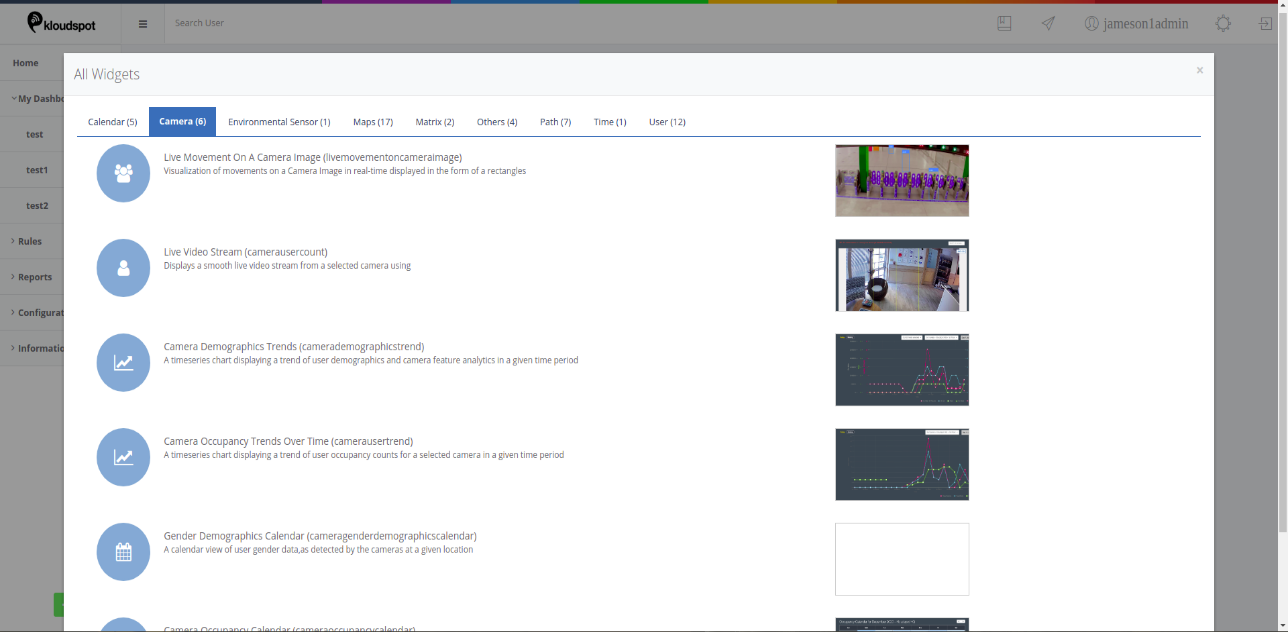
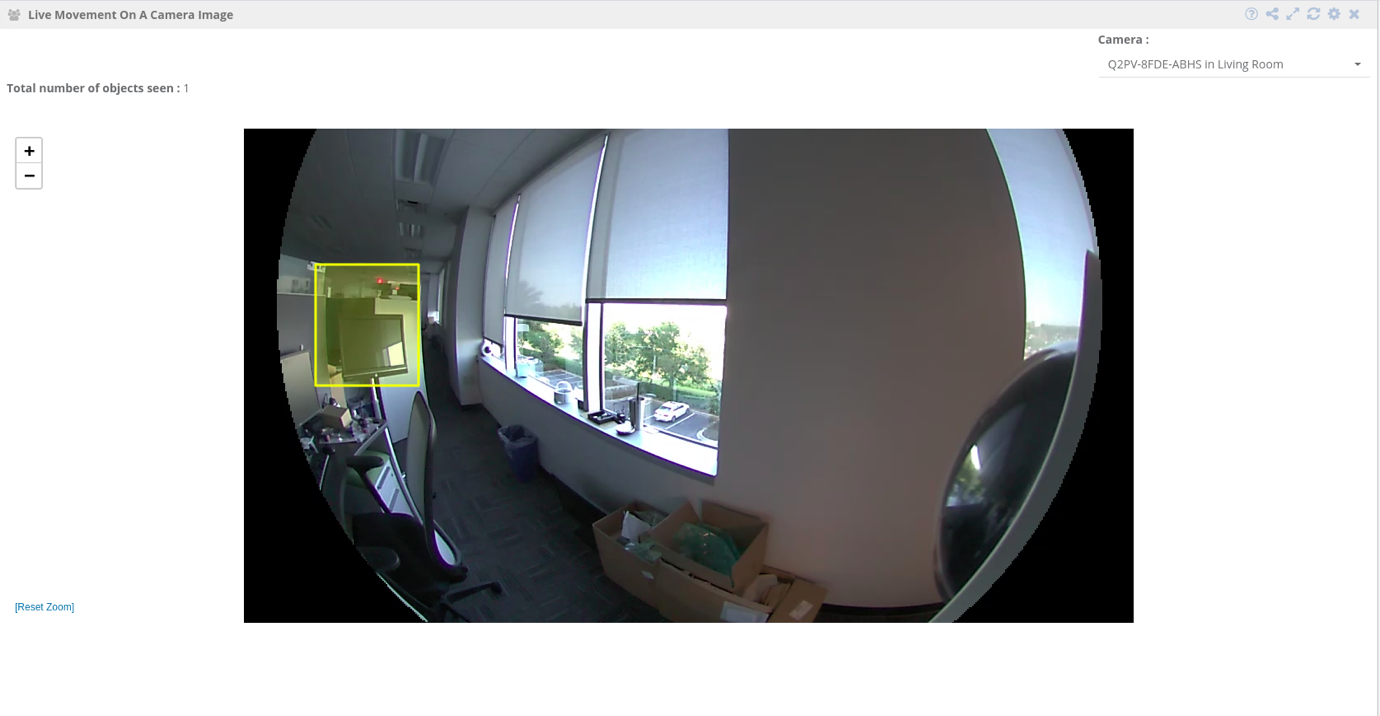
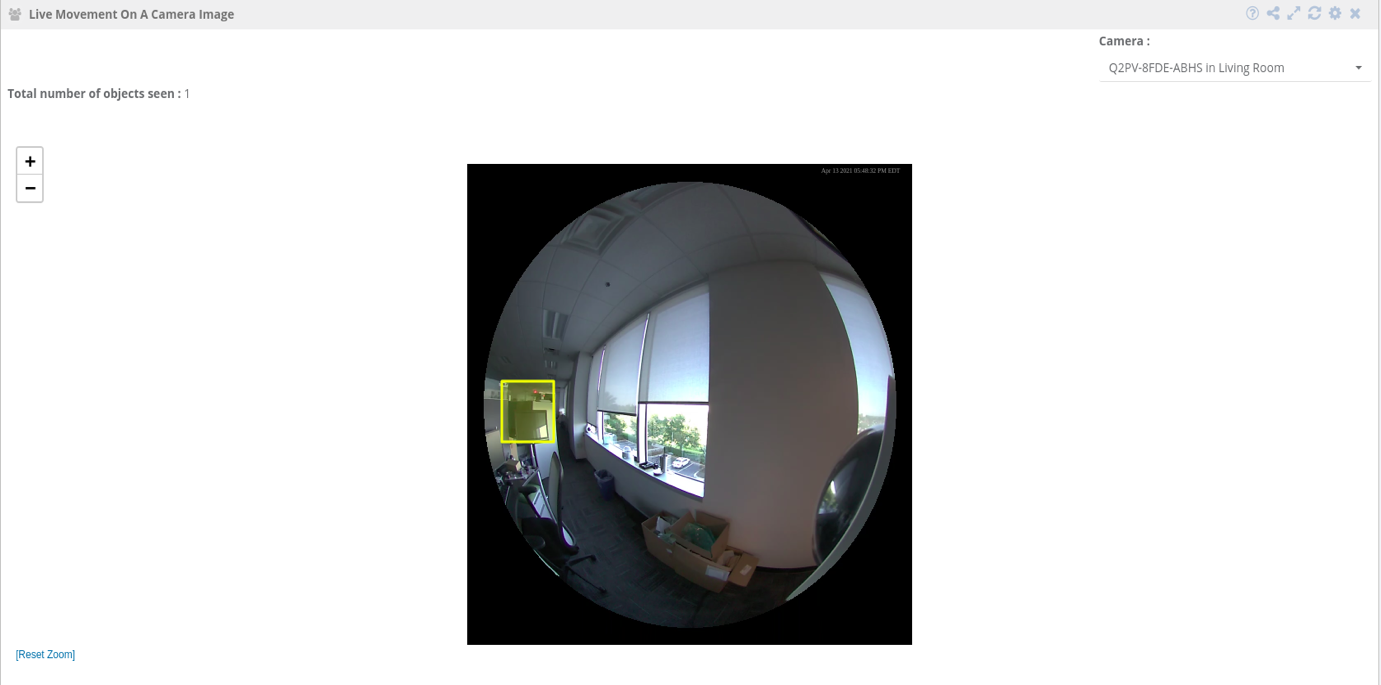
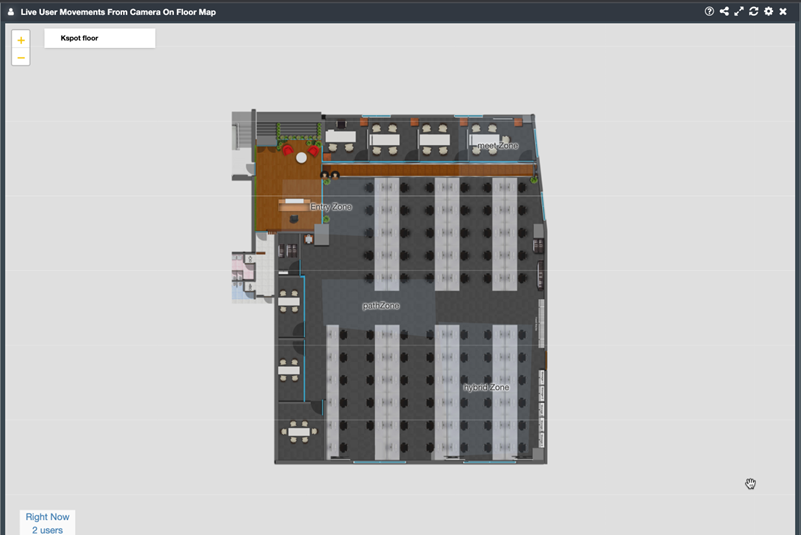
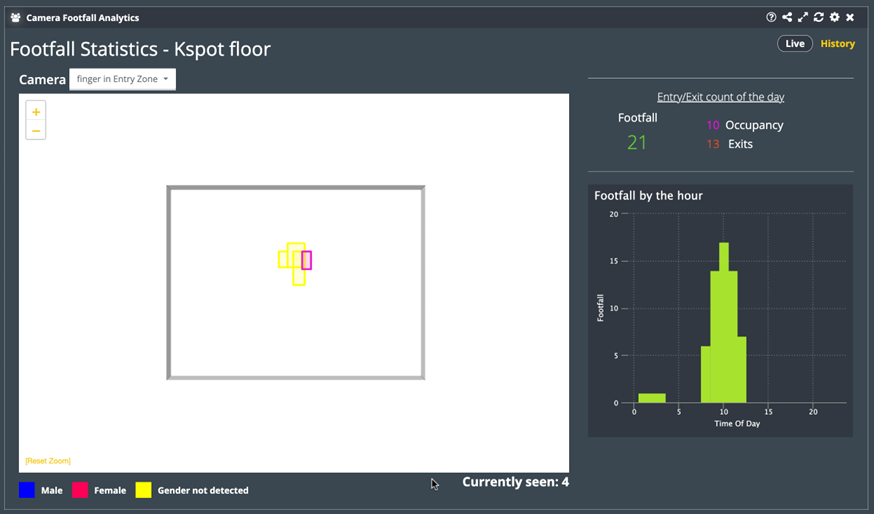
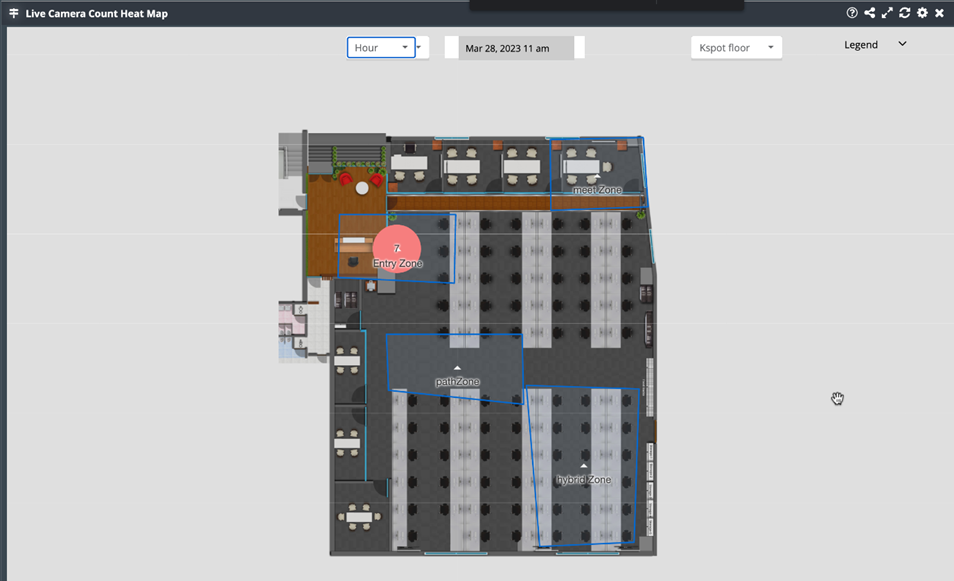
‘Live Movement on a Camera Image’ Widget
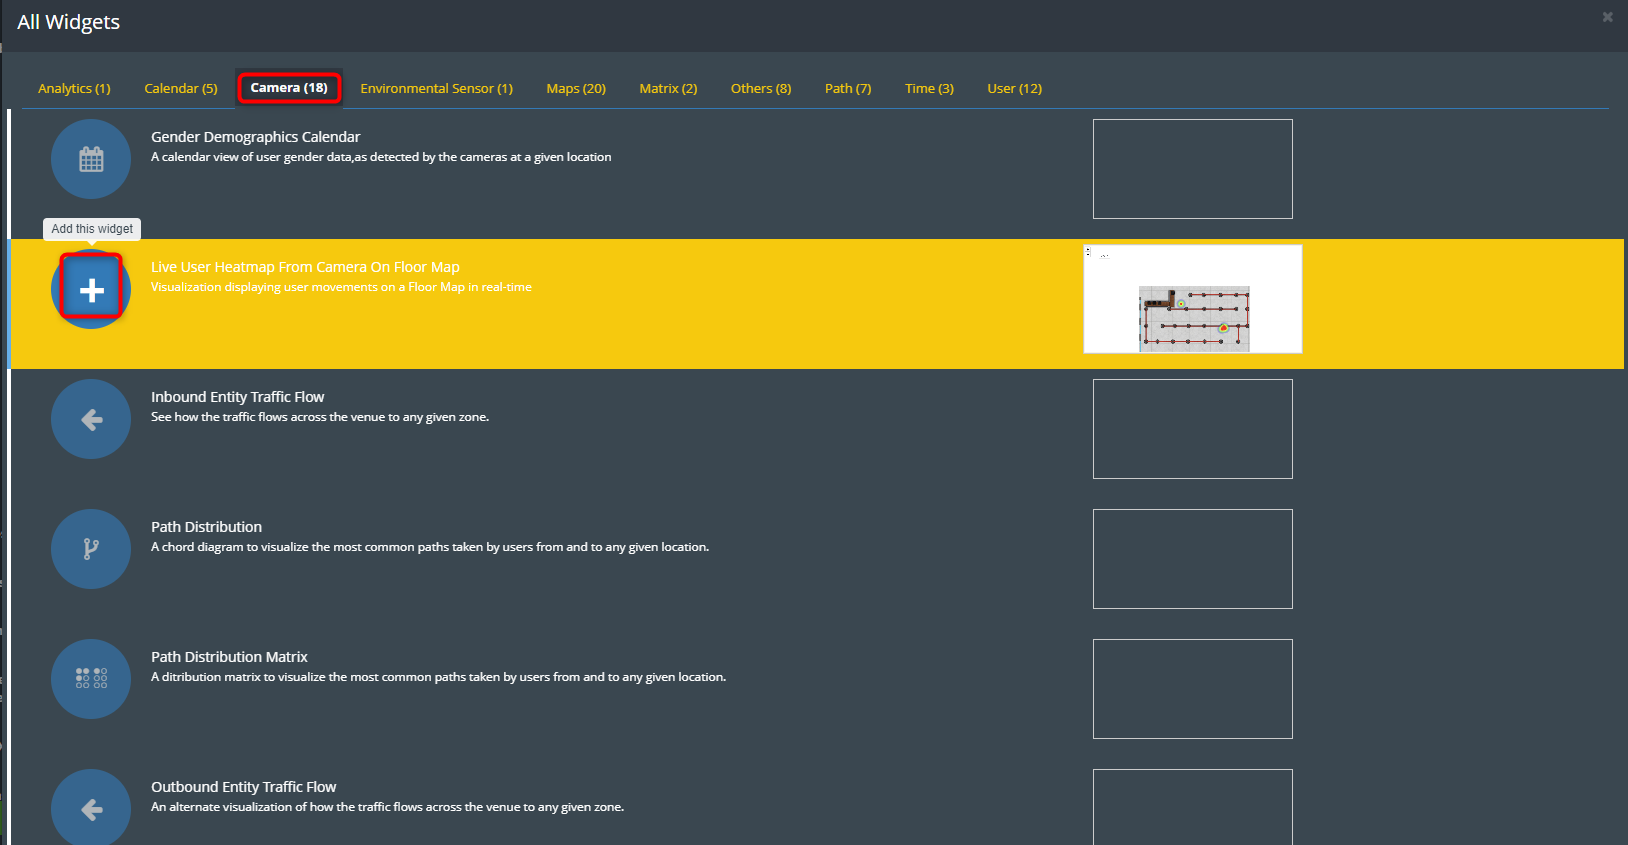
Step 1: To add the ‘Live Movement on a Camera Image’ widget navigate to the
‘Camera’ section and select ‘Live Movement on a Camera Image’ widget.
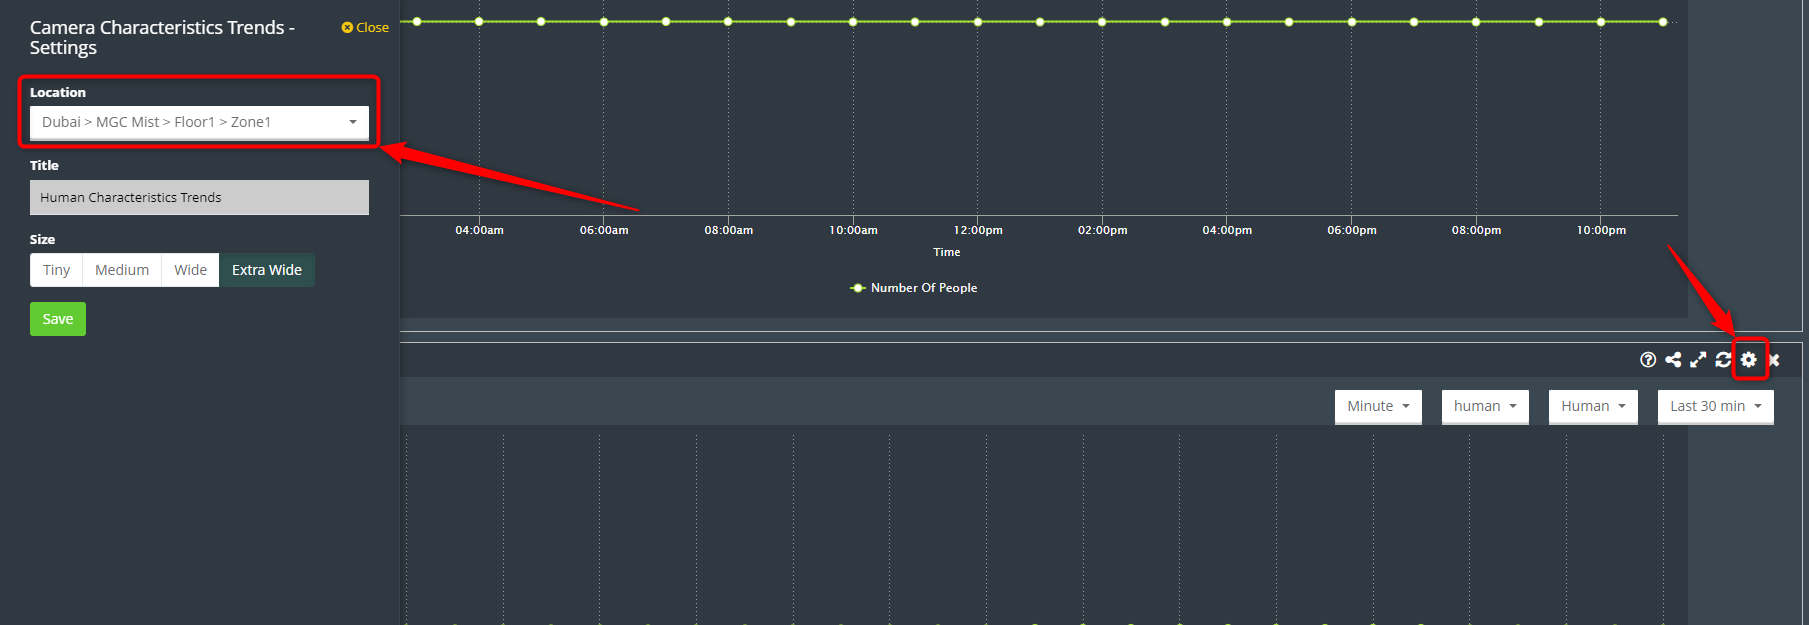
Step 2: Select the location in which the camera is configured through the
‘Settings’ option by clicking on the gear symbol.
Step 3: Select the camera for which you want to see the live movements.
Step 4: Once the camera is selected the live movements of the objects are seen
on the camera image in the form of rectangles. User can hover over the
rectangle to get more details of the object.
NOTE: User can Zoom in and out using the ‘+’ and ‘-‘symbols respectively.
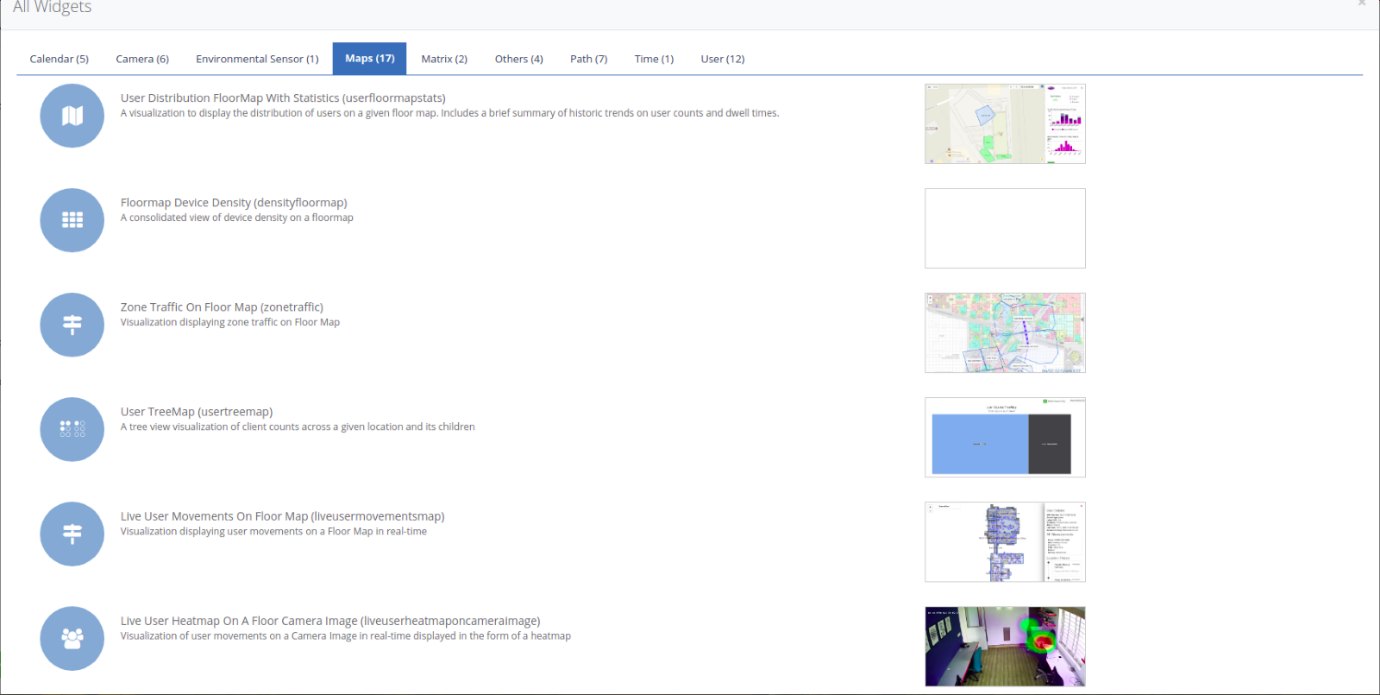
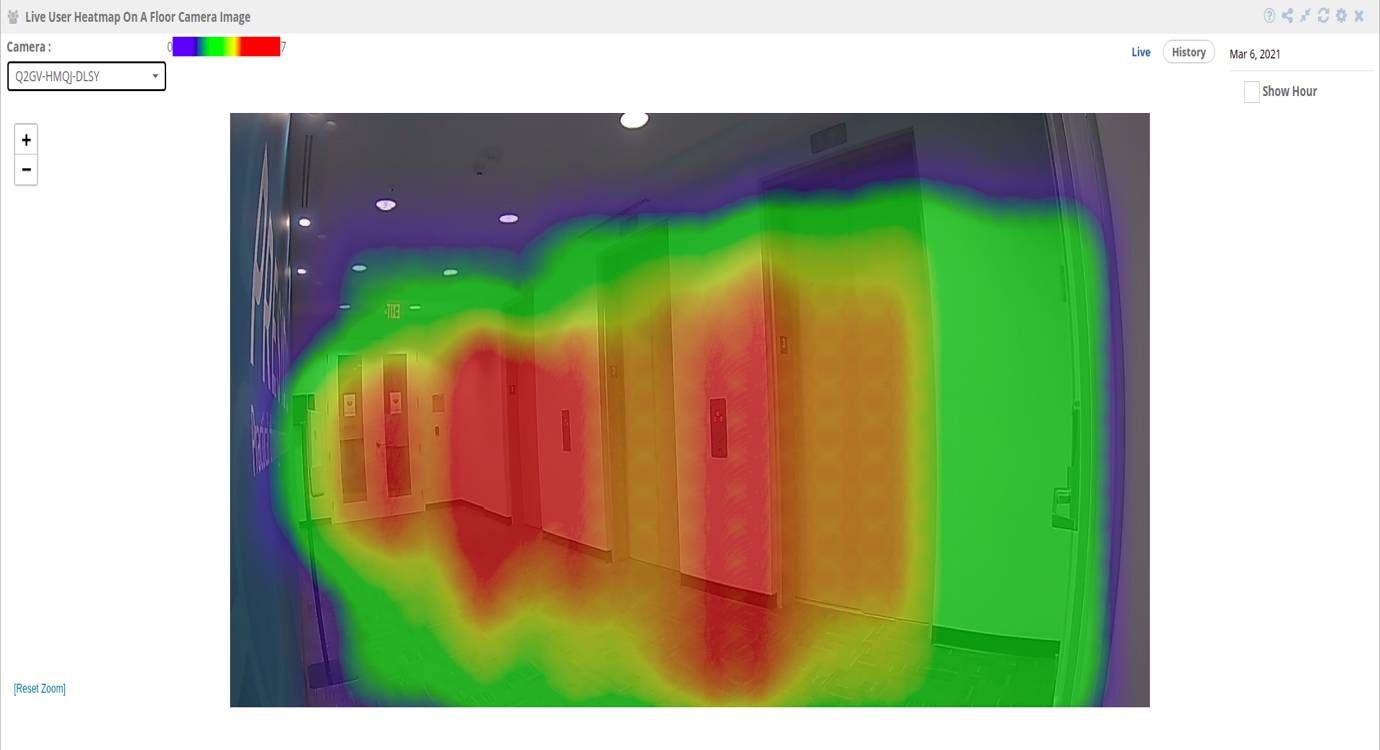
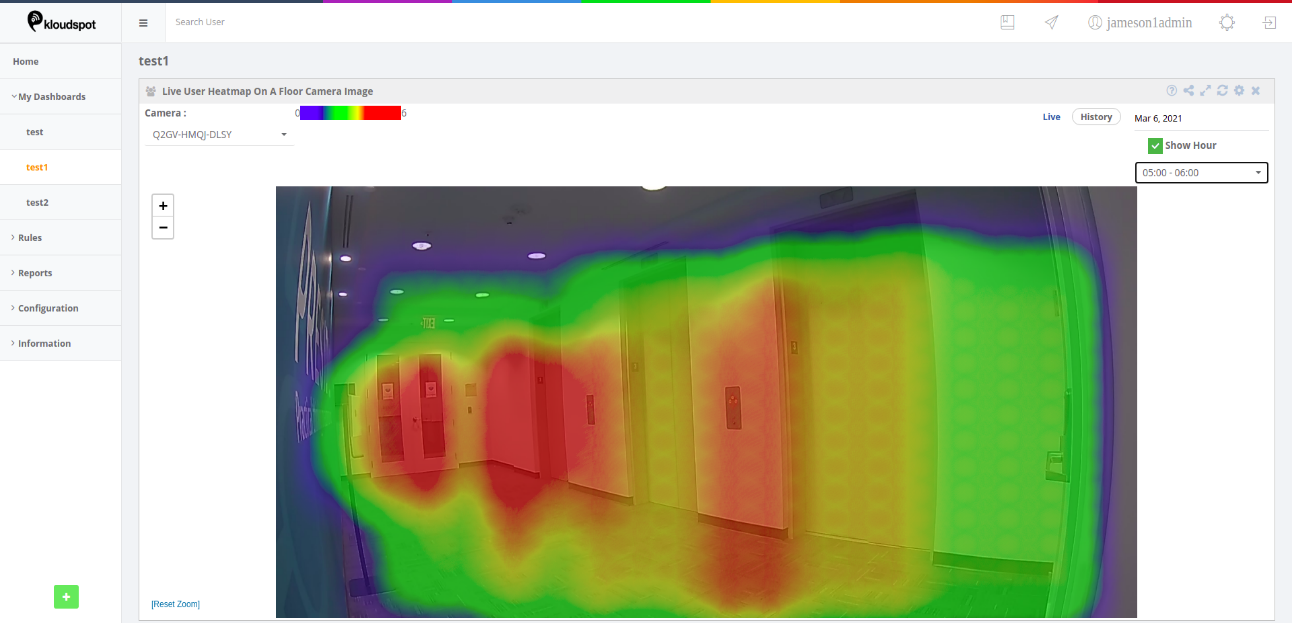
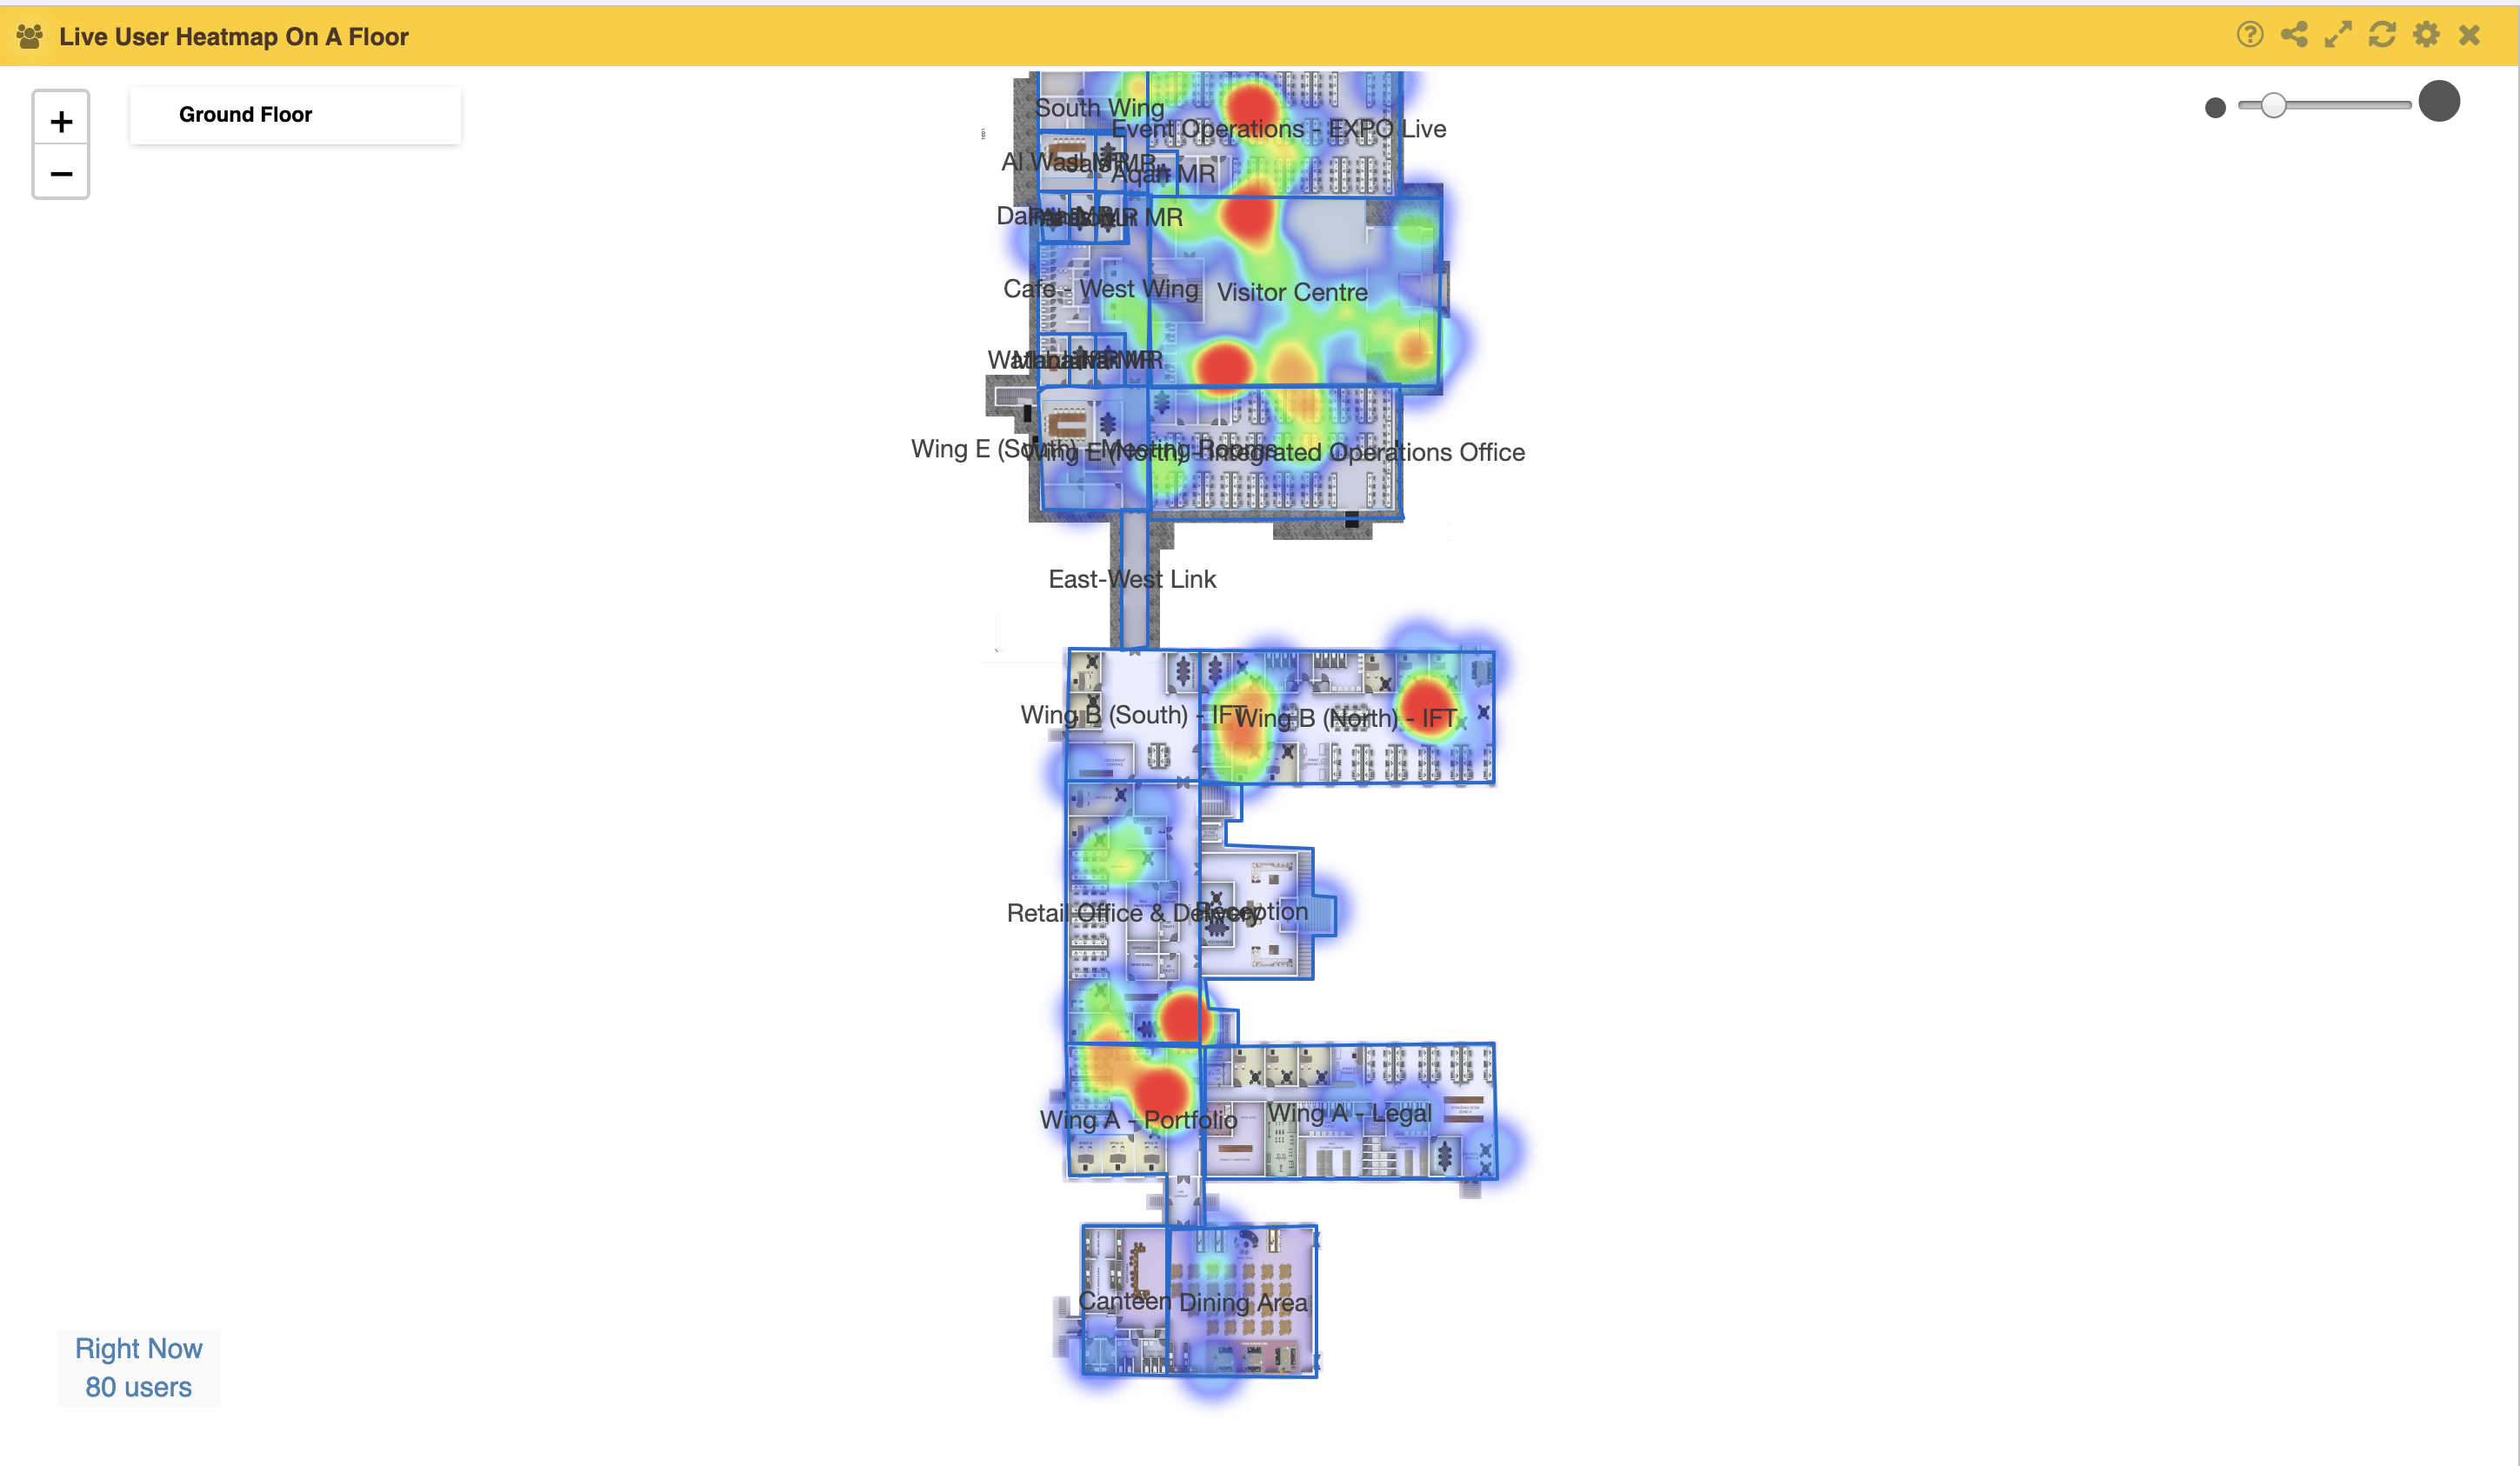
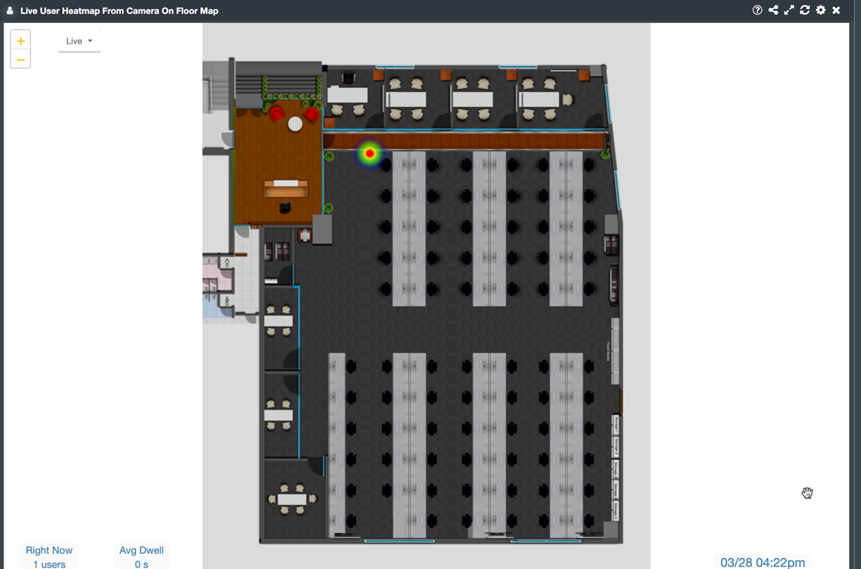
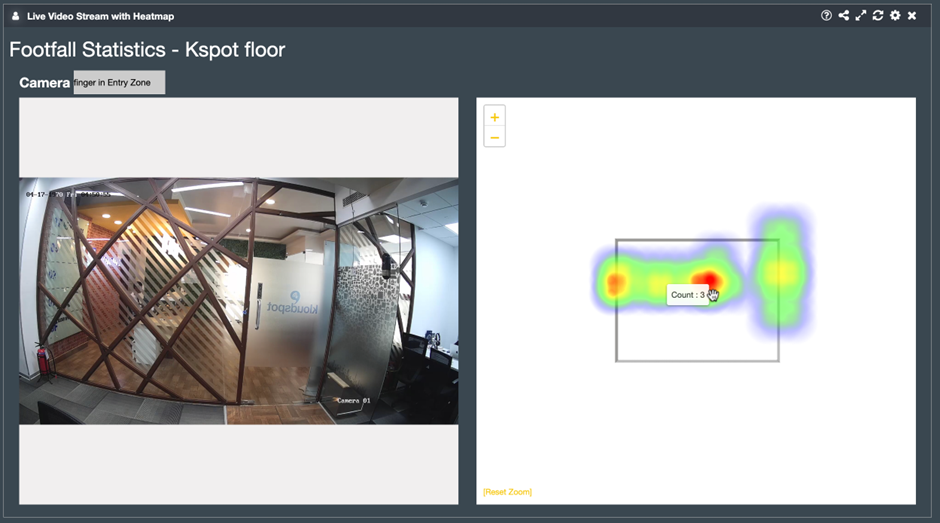
‘Live user heatmap on floor camera image’ Widget
Step 1: To add the ‘Live User Heatmap On Floor Camera Image’ widget navigate
to the ’Maps’ section and select ‘Live User Heatmap On Floor Camera Image’
widget.
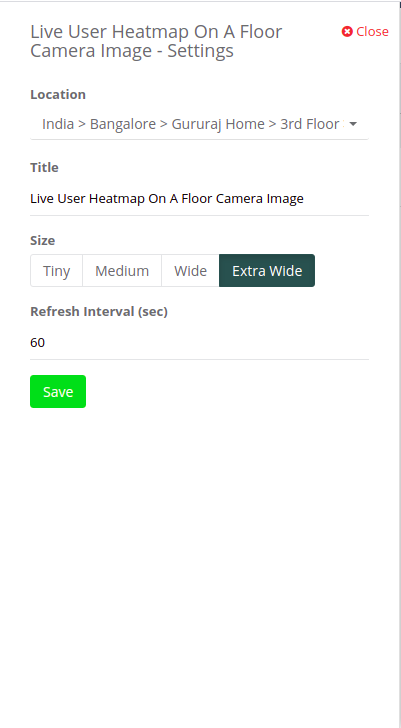
Step 2: Select the location in which the camera is configured through the
“Settings” option.
Step 3: Select the camera for which you want to see the heatmap.
Step 4: Clicking on the “Live Option” enables the user to view the live
heatmap.
Step 5: Clicking on ‘history’, allows the user to view the heatmap for a
specific day. The user can choose/pick any day from the date-picker.
Step 6: Clicking on the “Show Hour” checkbox enables the user to view the
heatmap data for any hour of the day.
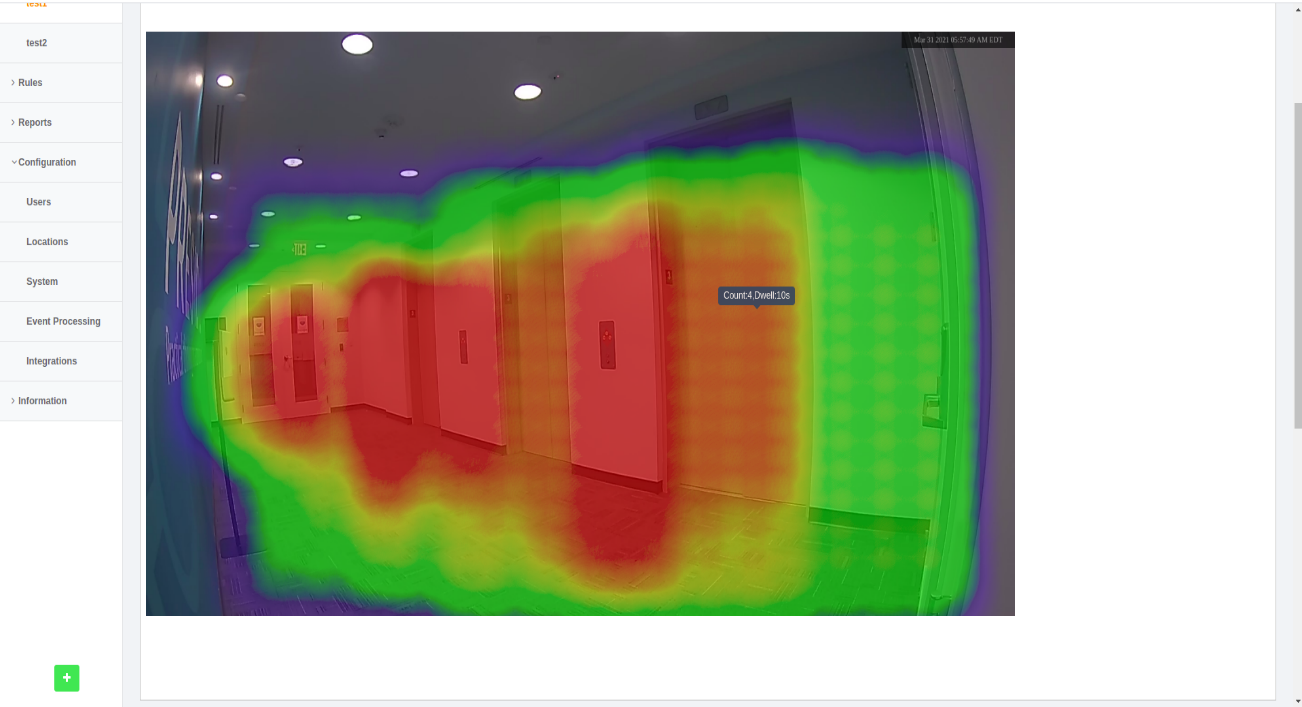
Step 7: A tooltip with the ‘count and dwell time’ can be seen when the user
just hovers over the heatmap.
NOTE: User can Zoom in and out using the “+” and “-” symbol, respectively.
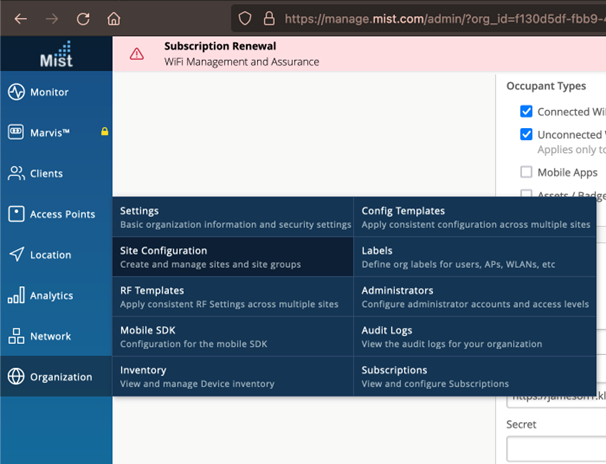
Mist Integration
On the mist cloud, navigate to Organization -> Site Configuration
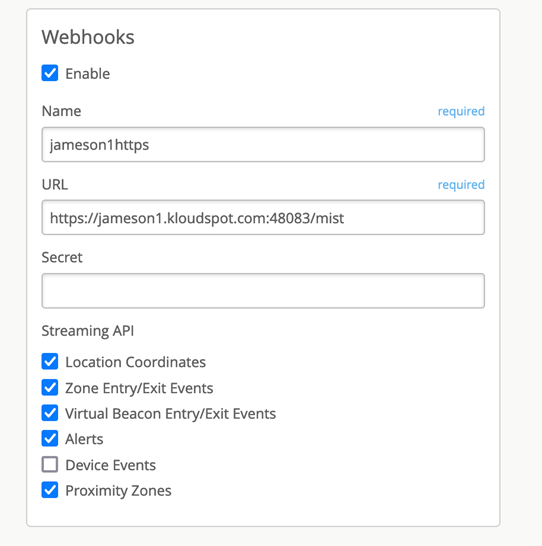
Enable Webhooks and provide the URL – (KloudInsight deployment team should be able to provide this). It will be of format https://<host :[port]>/mist
Connected client webhook information (client-join)
To enable connected client data to be reported on KloudInsights, we need to
enable “client-join” events on the Mist platform. One can get the Mist support
team to enable this on the Mist platform or following instructions can be
followed:
Please refer to the below document for further information: https://api.mist.com/api/v1/docs/Site#webhooks
1. Please navigate to the below API to check the webhook id /api/v1/sites/:site_id/webhooks
Add the “client-join” topic using the PUT operations for the below API: /api/v1/sites/:site_id/webhooks/:webhook_id/
API payload:
{
“topics”: [
“client-join”, ….
]
}
KloudInsights configuration
Configure floor maps on the Insights using the same floor map image that is
used on the Mist floor configuration. Make sure that the dimensions of the
floor map match the dimensions of the floor map configured on the
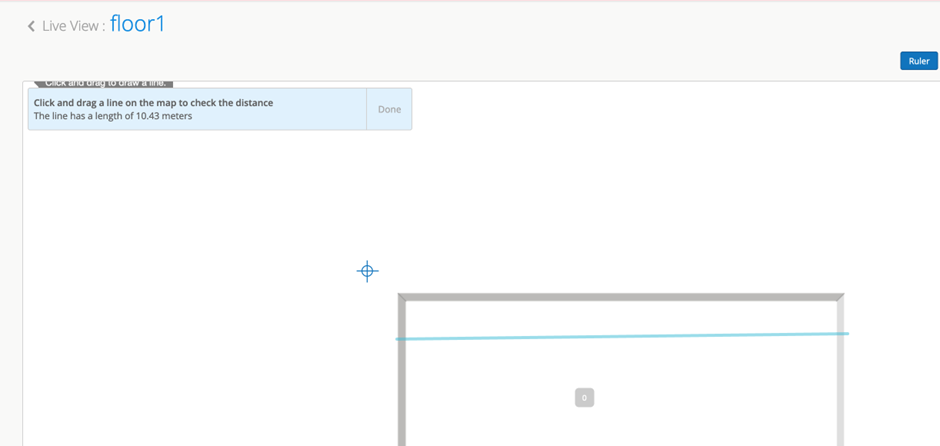
KloudInsights. To measure the dimensions of the floor map on Mist, you can use
the Ruler (as show below).Configure floor maps on the Insights using the same
floor map image that is used on the Mist floor configuration. Make sure that
the dimensions of the floor map match the dimensions of the floor
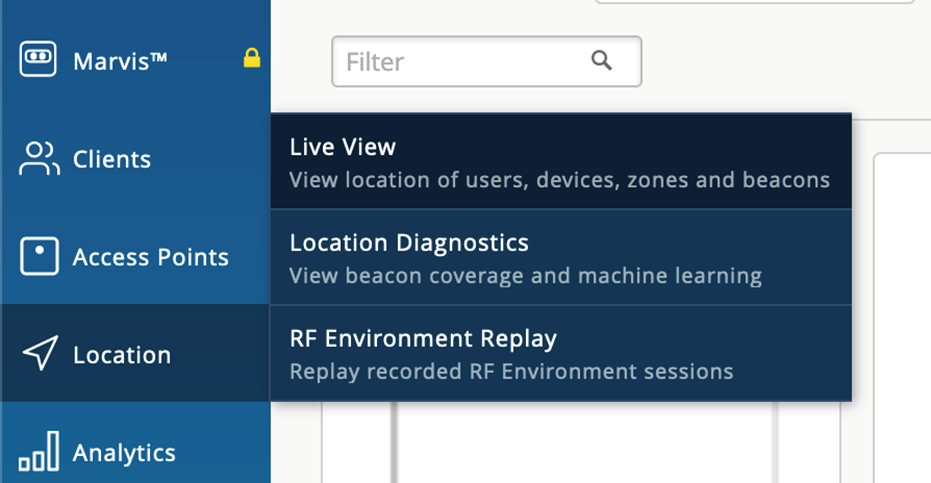
Location -> Live view
Click on the floor and select ruler and draw line using the mouse
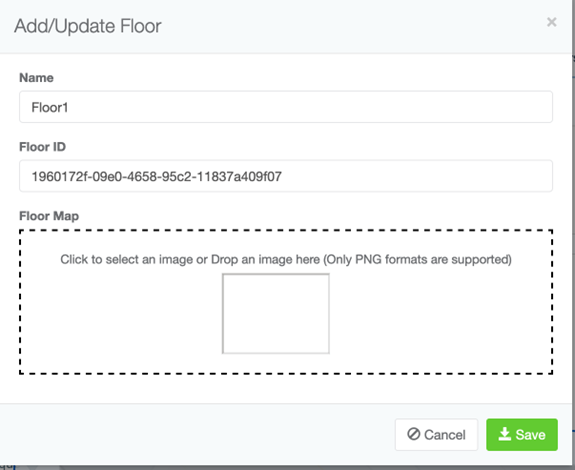
On each floor on Kloudspot you need to update Floor ID with the map Id of the
floor on the Mist system. The map Id can be obtained from the URL in the live
view (Location -> Live view) of the floor on Mist system.
Ex: below is the live view url and the highlighted one is the map Id.
Then map Id is 1960172f-09e0-4658-95c2-11837a409f07, it should be updated on
KloudInsights floor as below:
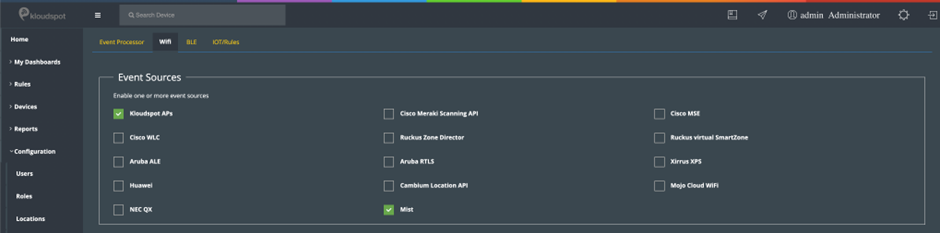
Also enable Mist data processing on the WIFI as below:
Navigate to Configuration -> Event Processing -> WFI and make sure “Mist” is enabled as below
Kontakt.IO IOT Sensor Integration
Overview:
Kontakt.io are a provider of ‘smart’ BLE tags/sensors.
They provide two main types of device:
“Smart Badge A mobile tag, typically used for people tracking. The tag has 2 buttons and an IR sensor able to sense a room number transmitted by Portal Beams in rooms.
‘Portal Beam’ A static typically attached to ceilings, able to report:
Counts/locations of IR sensed occupancy data
Environmental information (light intensity, air quality, temperature, pressure …)
It also has an IR transmitter able to send a room number to smart badges
In addition, they can provide dedicated asset tags and WiFi - BLE ‘gateways’
called Portal Lights.
The BLE devices can all be used with their own BLE gateways or also with BLE
gateways on Meraki and Cisco APs.
Regardless of the gateway type used the data arrives in the Kontakt.IO cloud
and is then available for processing/forwarding.
The main functions they provide are:
Occupancy – de-duplicated counts of devices and/or people in rooms using the IR sensors. They provide functionality to deduplicate counts between multiple Portal Beams and can track down to seat occupancy with suitable setup.
Position – location of BLE tags based on trilateration. One extra function they provide is the ability to determine which room a badge is in based on the IR sensor on the badge ‘seeing’ a portal beam and getting a room number. Since this information is available from the Telemetry feed and we do our our trilateration, we don’t need this feed setup.
Data feeds containing this information along with a raw BLE tag telemetry
stream can be sent from the Kontakt.io cloud to AWS Kinesis. Our integration
sets up and subscribes to this Kinesis feed
Integration
We have integrated the following features, based on the Kinesis data streams:
BLE tag presence and trilateration (similar to existing functionality).
‘Smart Tag` button and room number reporting support
Portal Beam environmental data reporting.
In addition, we will follow up with IR based room occupancy reporting.
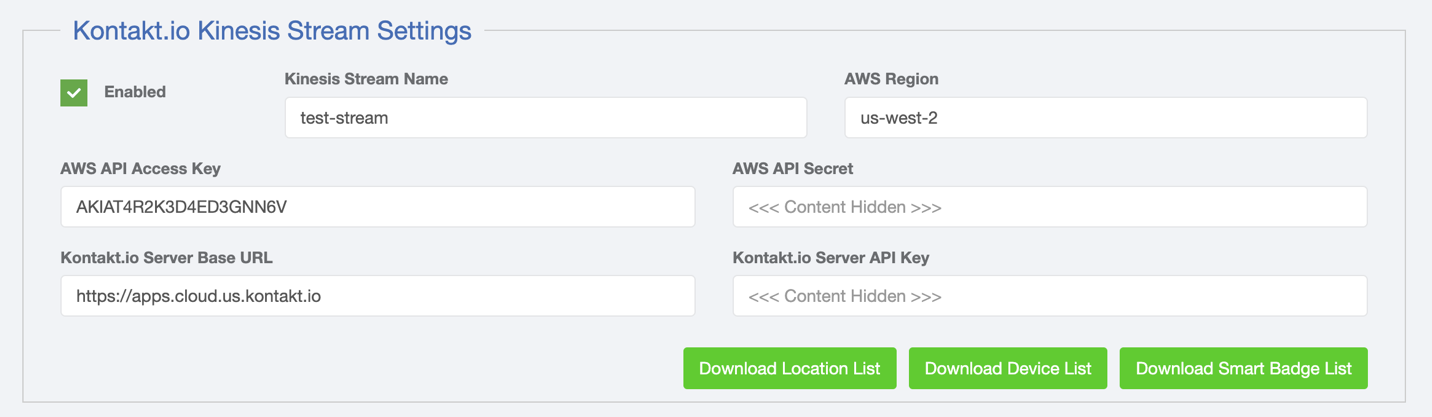
Configuration:
The following needs to be configured:
AWS:
Create an AWS Kinesis stream.
Create an AWS User with Access Key access and the following permission policy:
Note that the Resource ARN needs to specified for both Consumers and the
stream itself.
The BLE and IOT stream processing jobs need to be running on KloudInsights
Configure the integration in Configuration -> Event Processing -> IOT/Rules
You will need the AWS information, as well as your Kontakt.IO API key. When
configurated the integration will set up the Kinesis channel in Kontakt.IO and
configure it to send data.
Setup
The final step is to configure the badges, sensors etc in Kloudinsights:
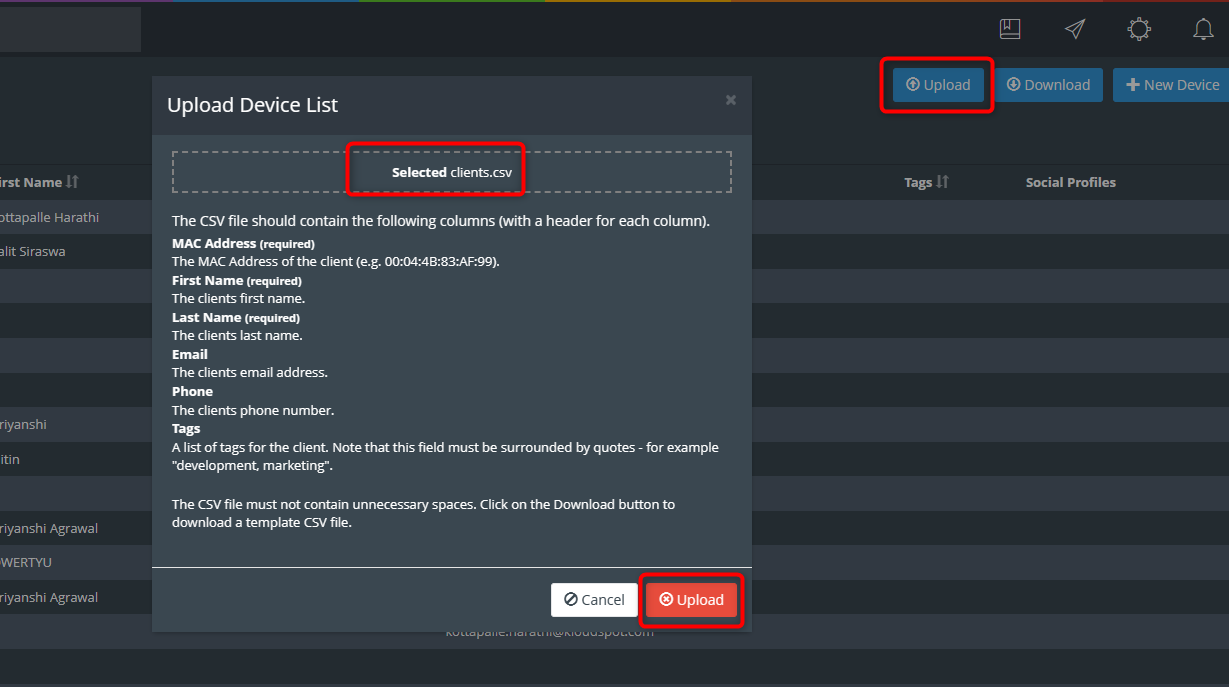
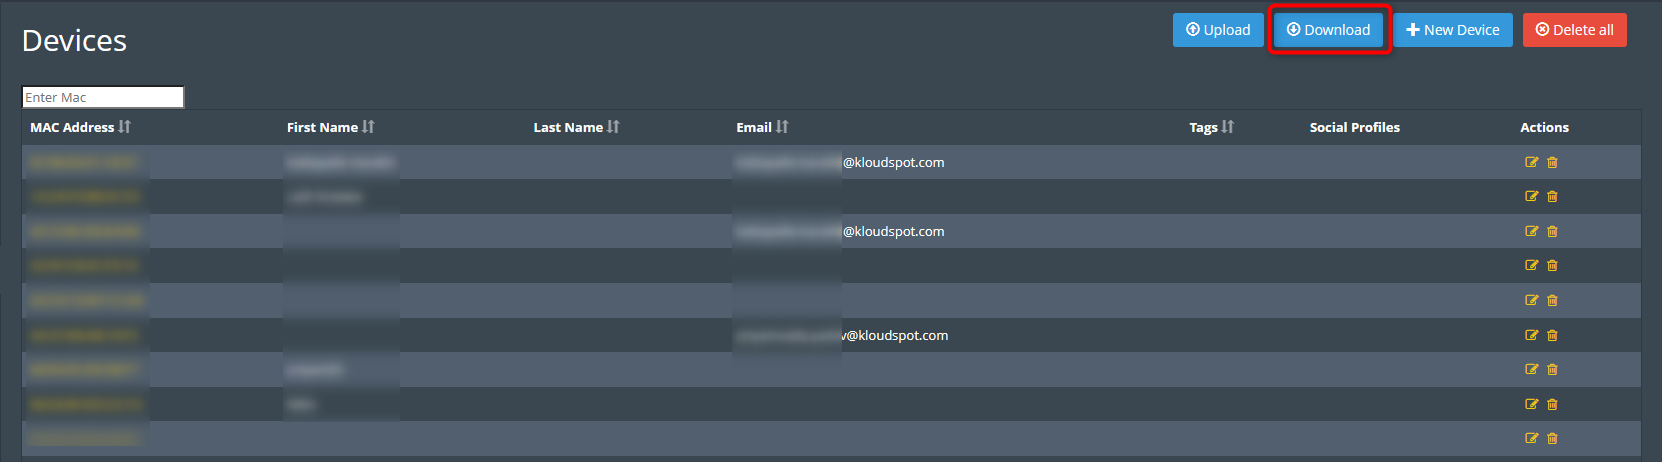
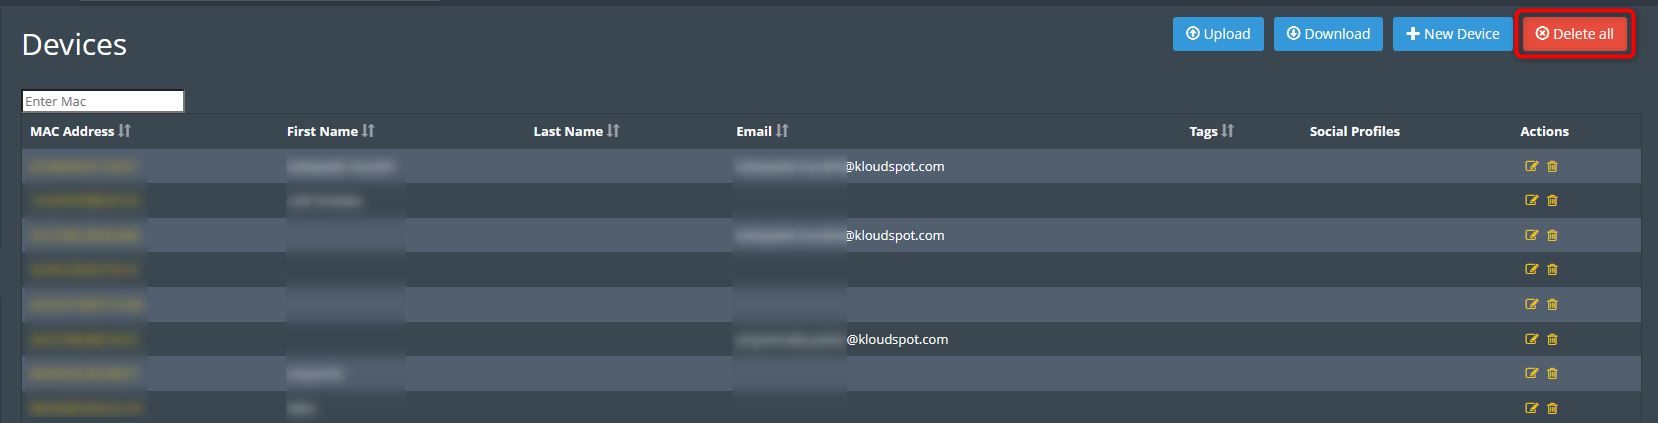
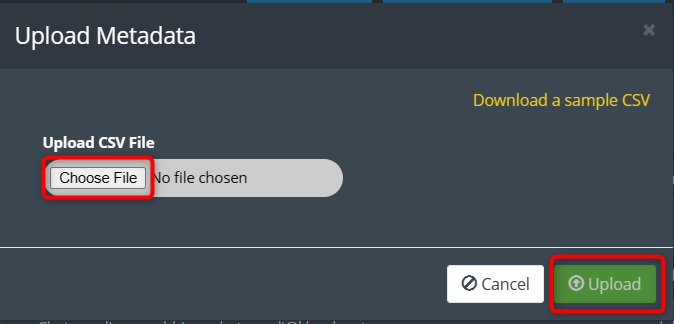
Note that you can download lists of Kontakt.IO devices, smart badges and
locations to help with this task:
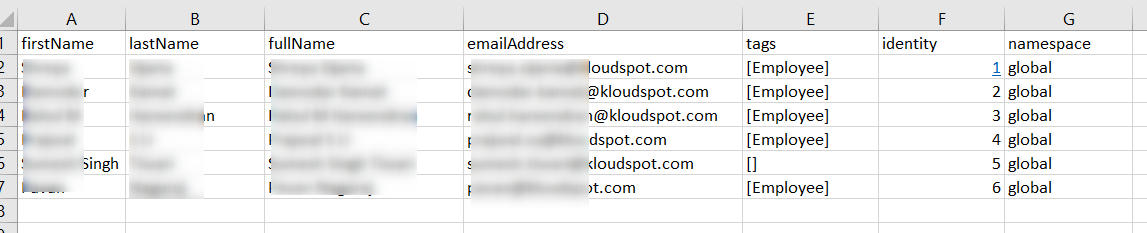
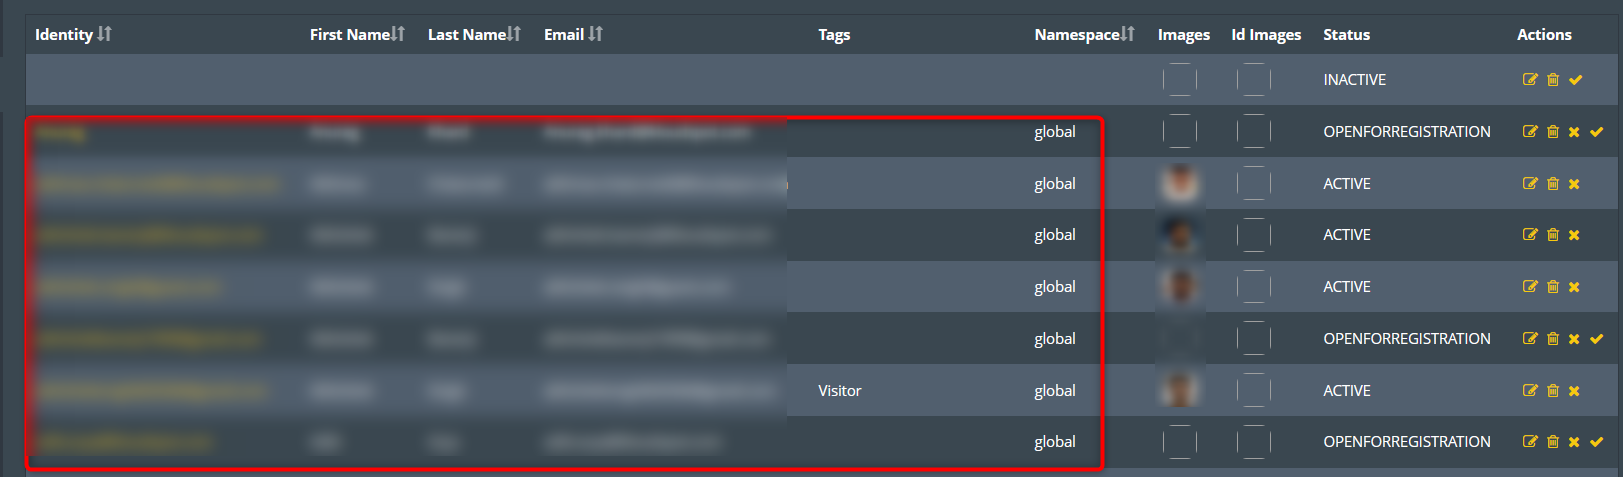
Upload BLE Tag information in the ‘Devices’ screen – you can assign user names, emails etc.
Add the Portal Beams as environment sensors in Configuration -> Locations. Note that use the ‘name’ of the beam as the name of the EnvSensor.
Add the gateways as ‘APs’, using there MAC addresses.
For each mapped zone, add the ‘roomNumber’ from the location.csv as an external identifier.
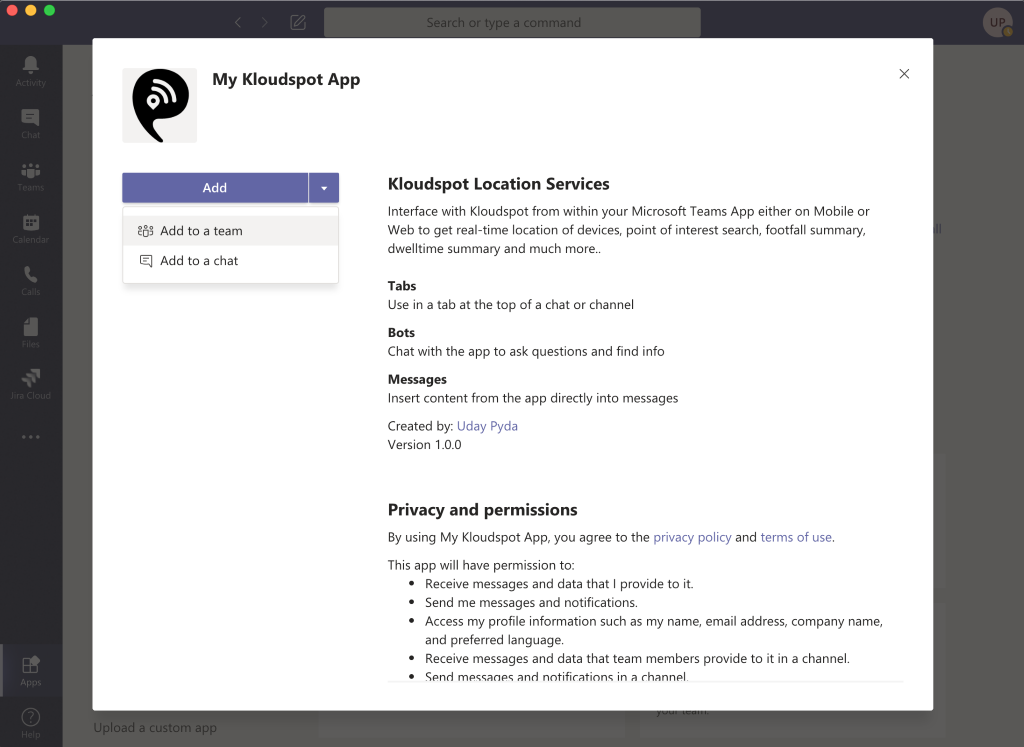
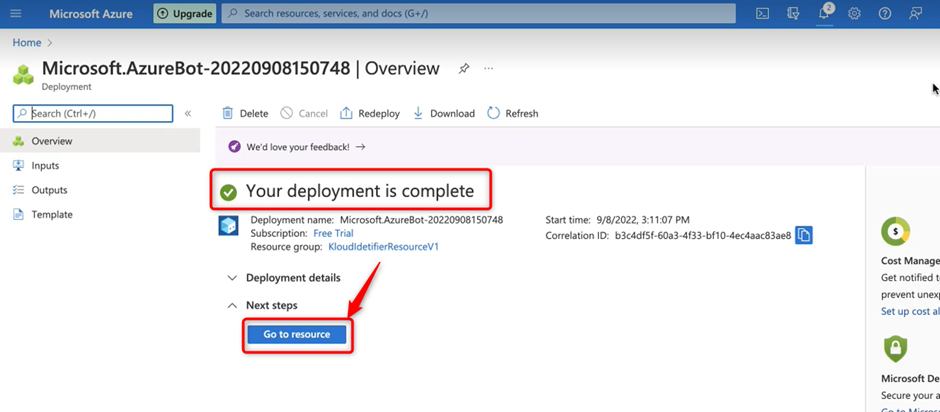
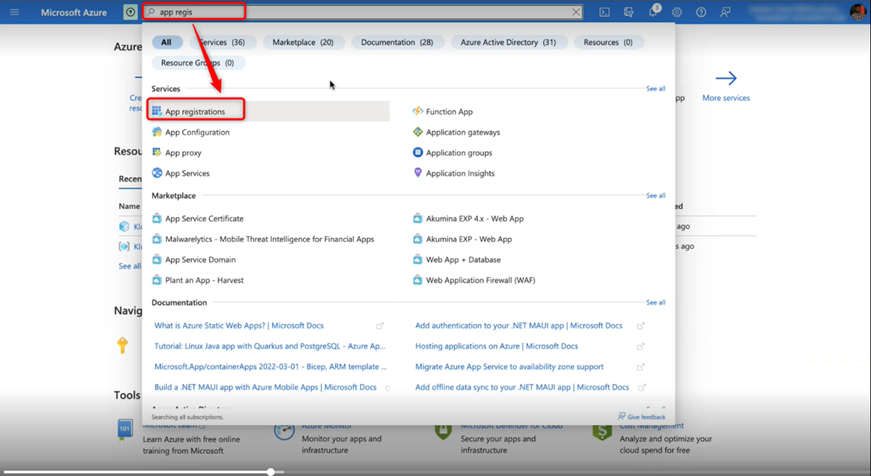
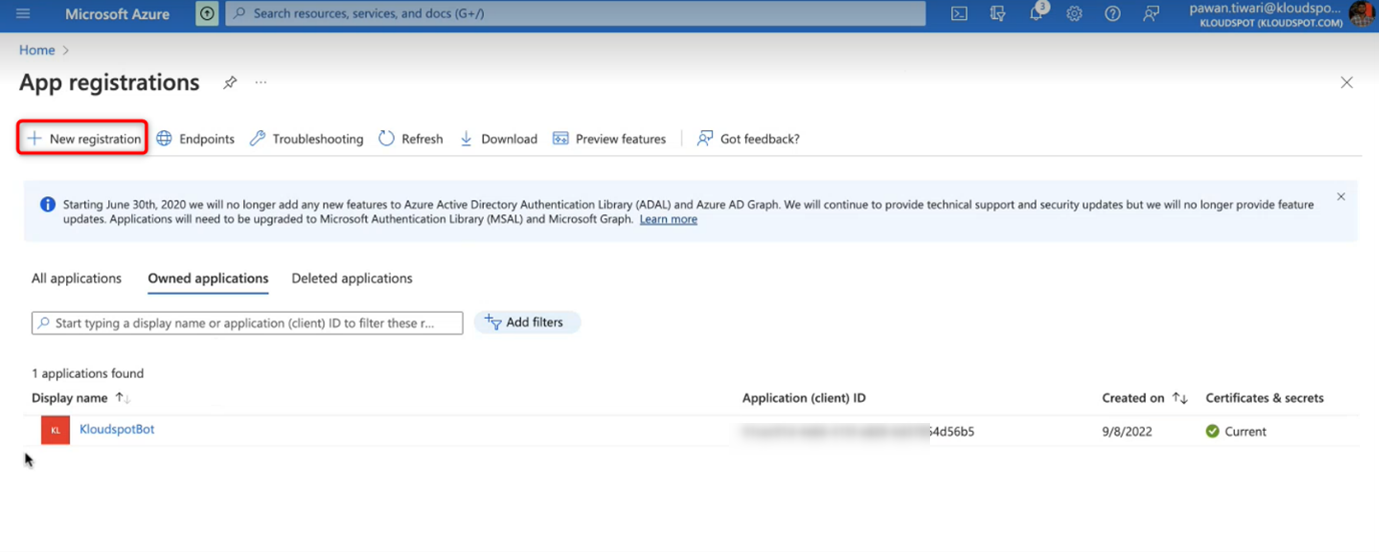
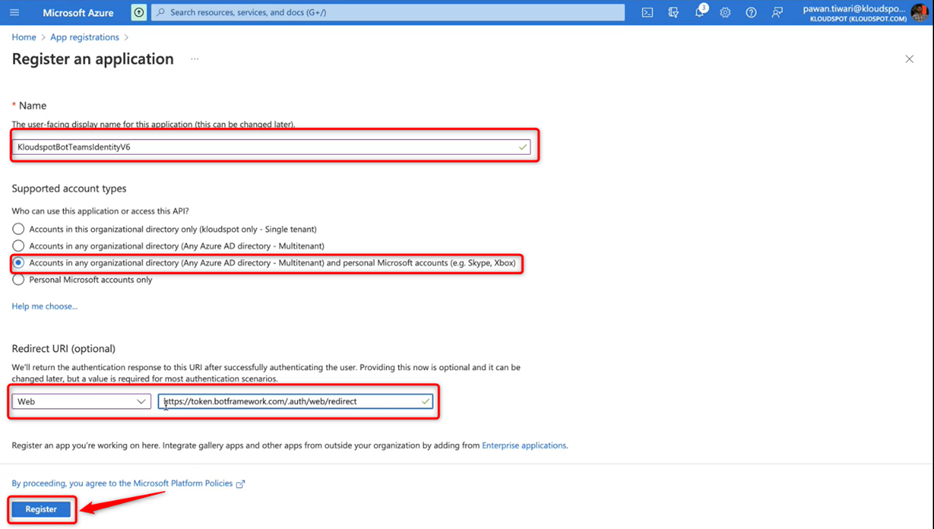
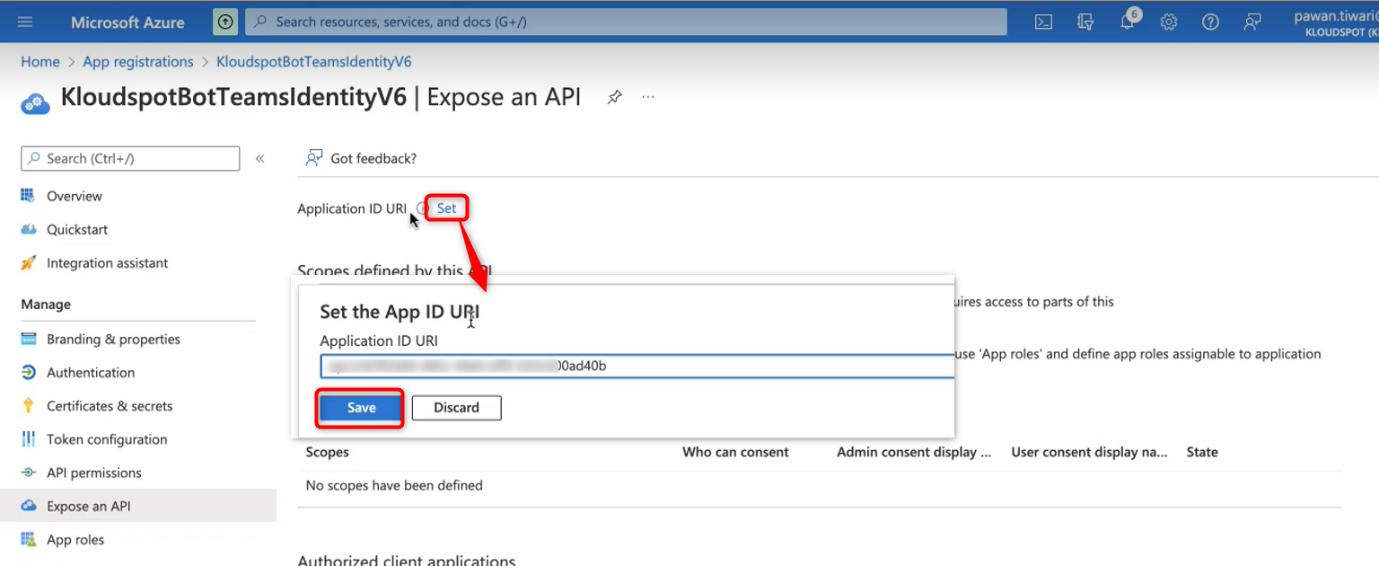
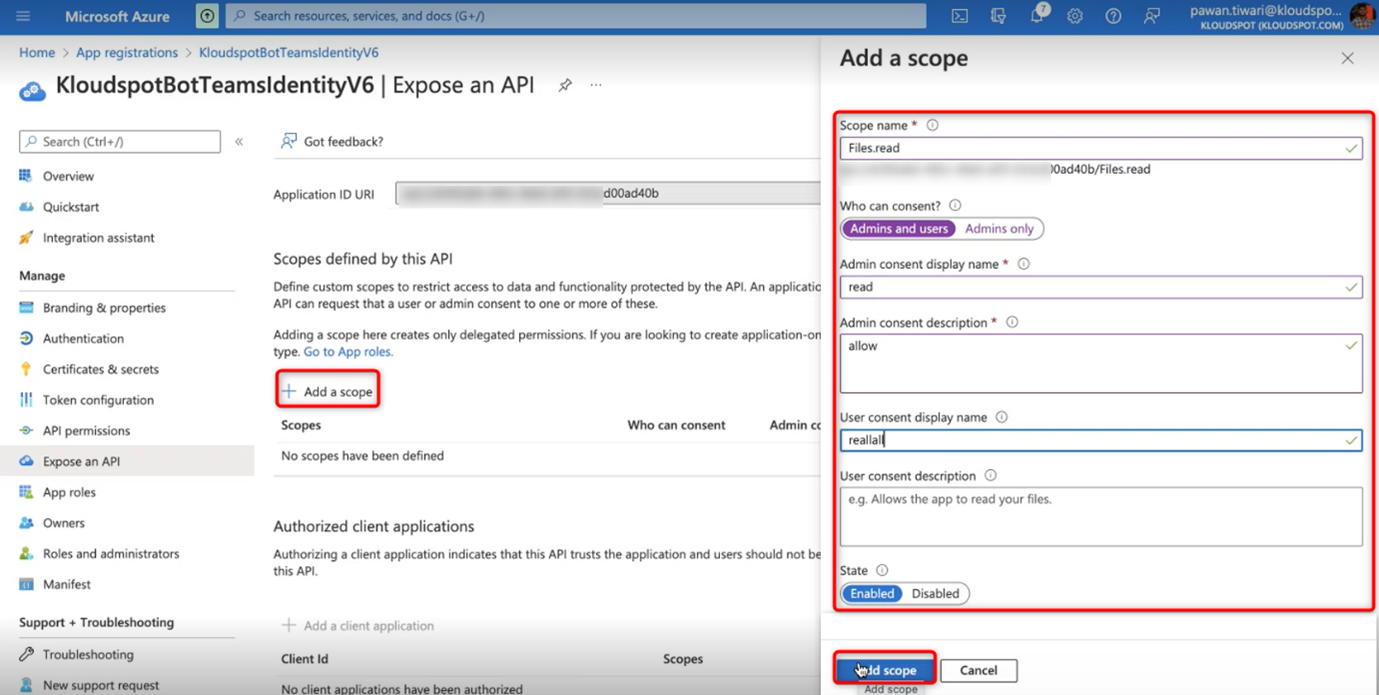
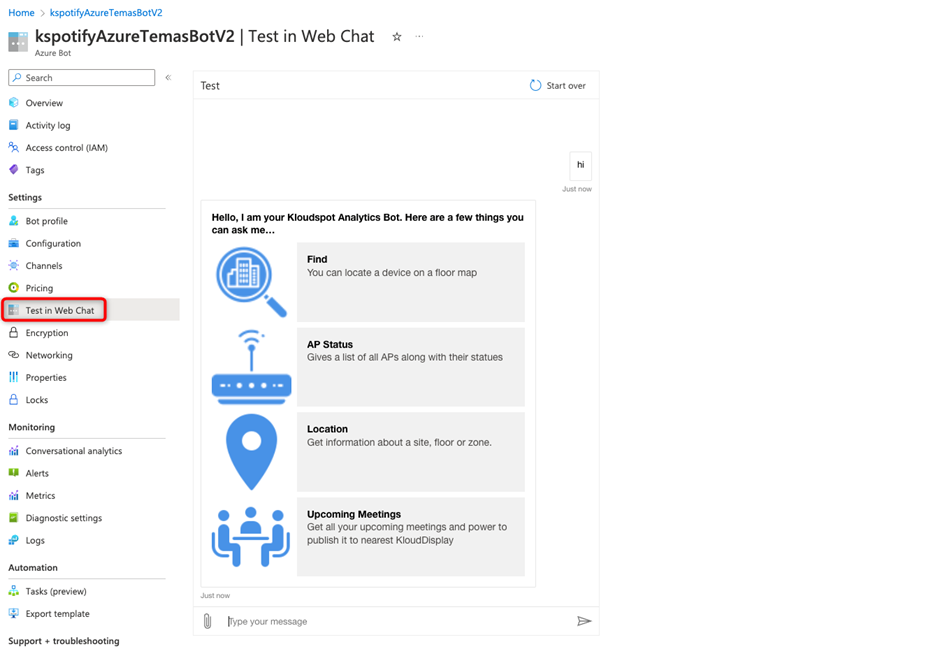
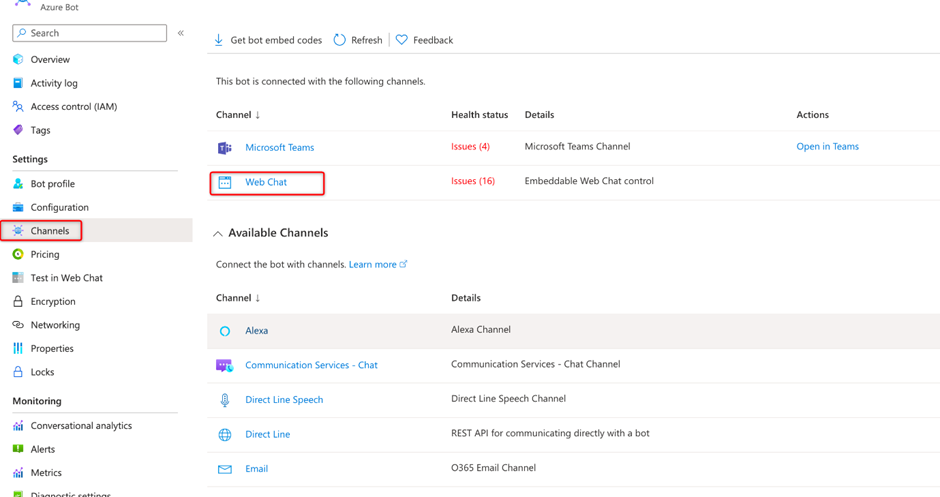
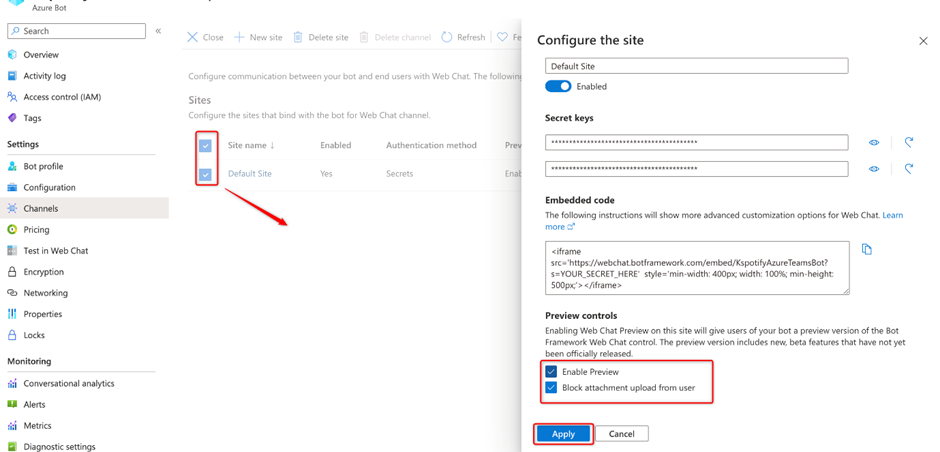
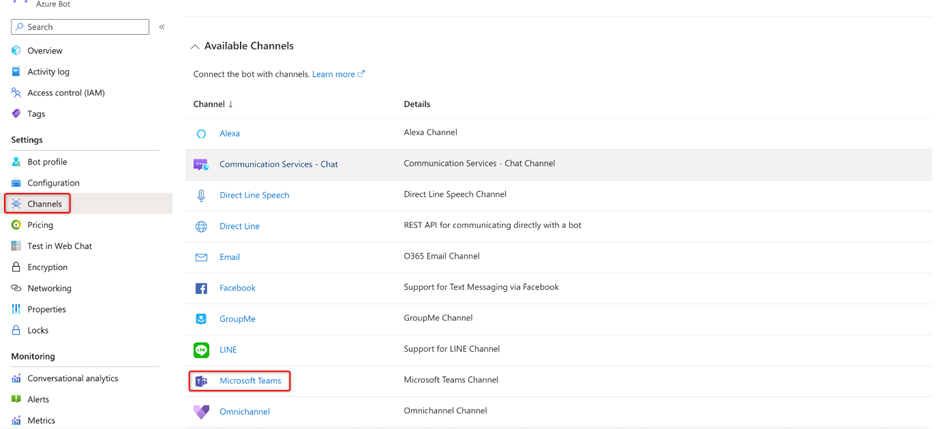
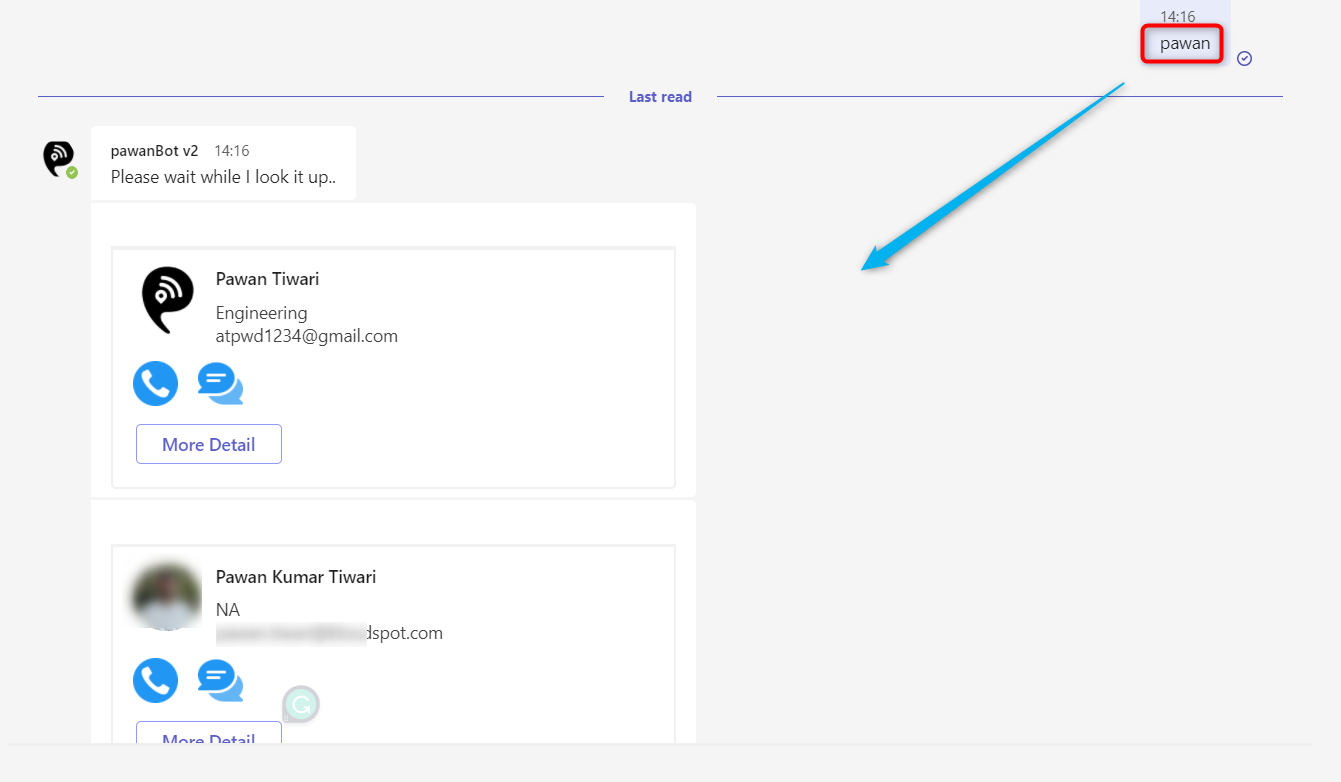
Teams Application Setup
This document outlines the steps required to set up and install Kloudspot App
for Microsoft Teams.
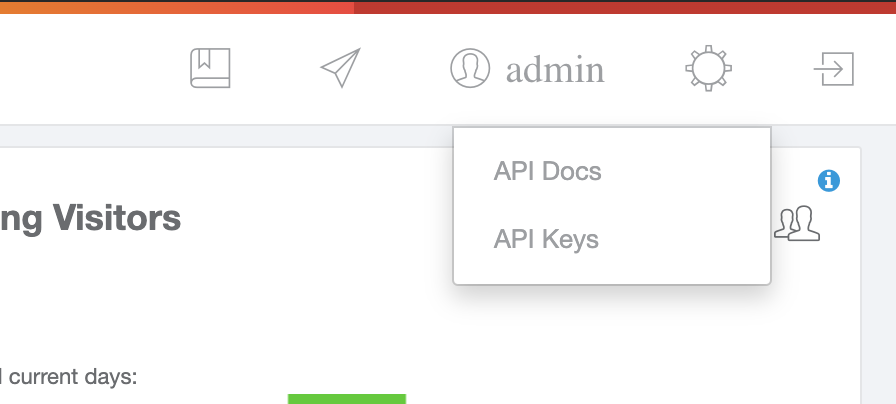
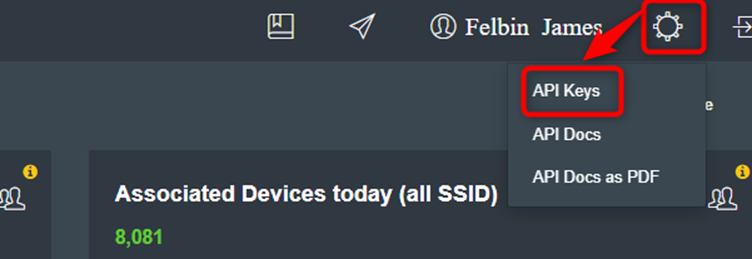
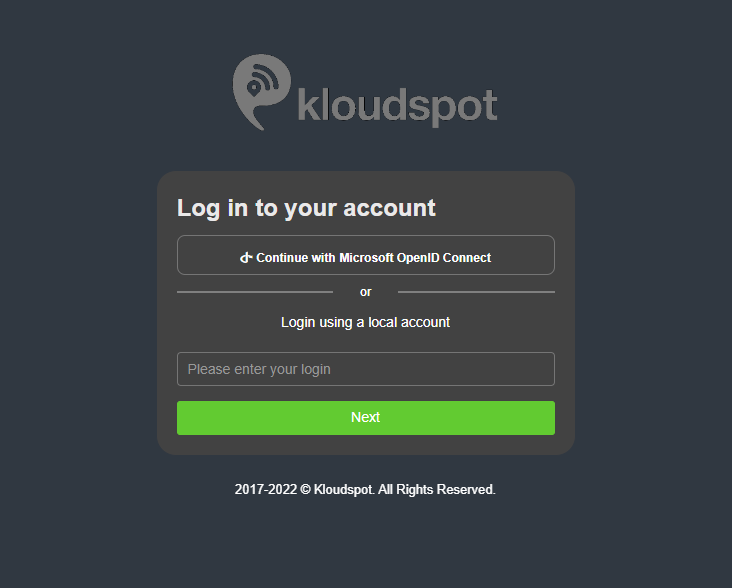
Login to Kloudspot Analytics Platform
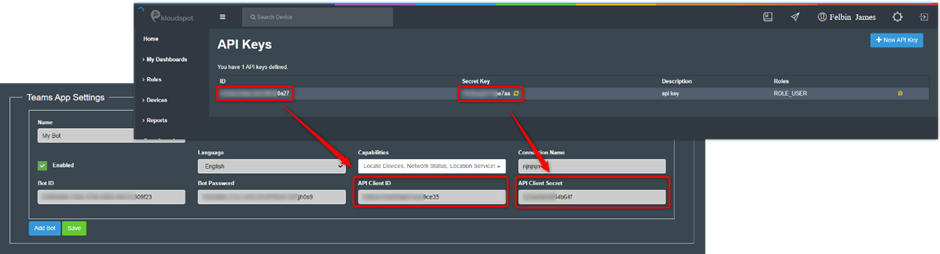
Navigate to “API Keys” section accessible from the top menubar under the gears icon
Create a new Key. Make a note of the API Client Key and API Client Secret. You will need this later
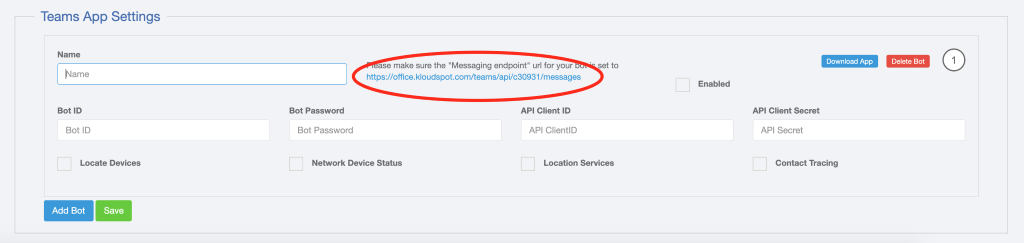
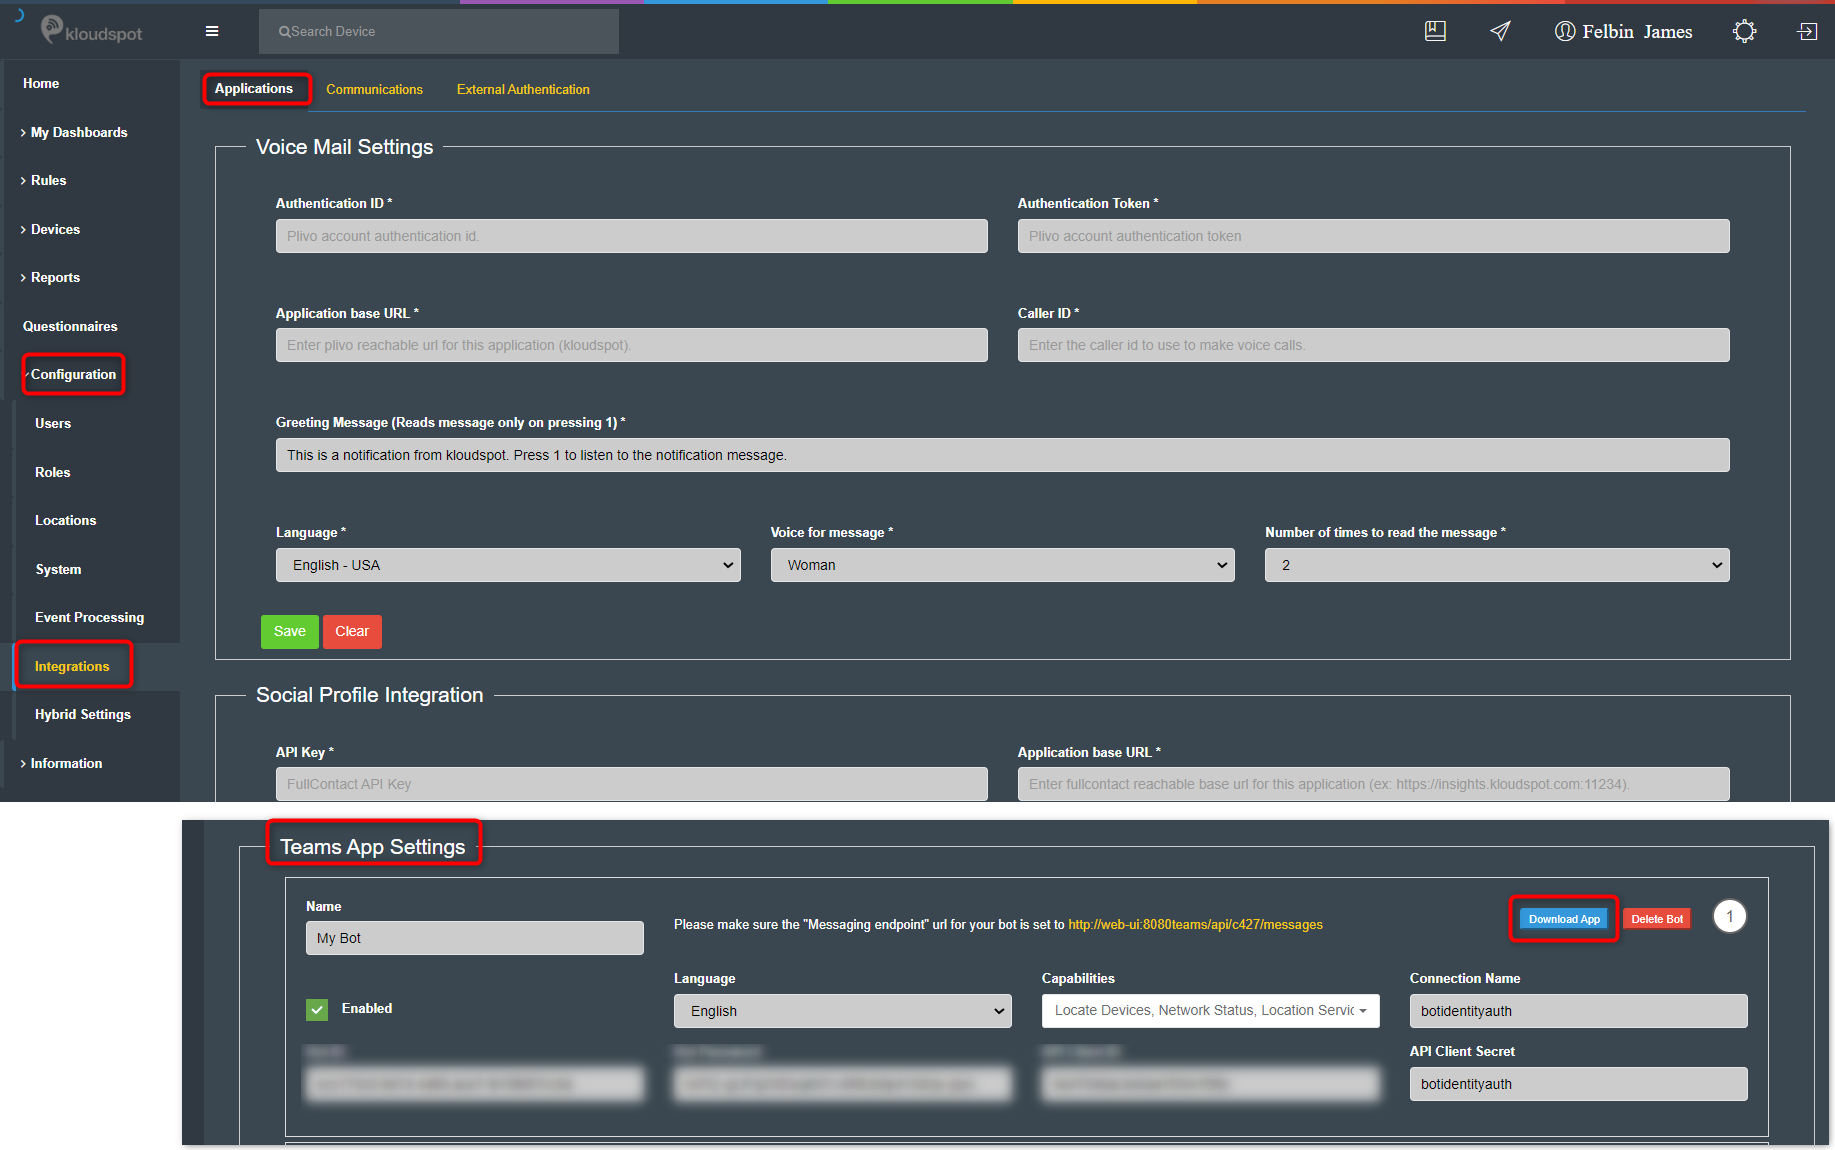
Navigate to “Configuration => System” in the left navigation bar
Click on “External Integrations” tab
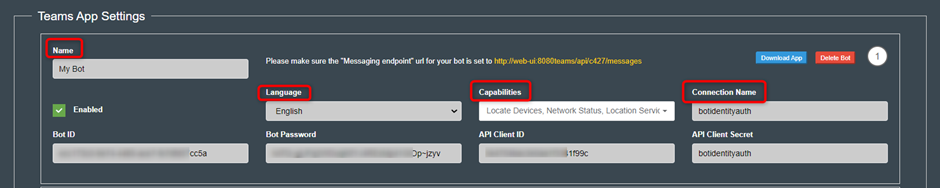
Scroll to the “Teams App Settings” section
Click on “Add Bot”
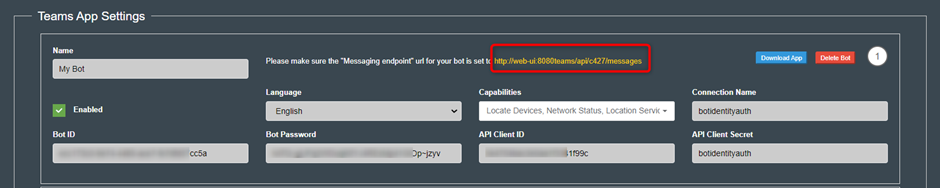
Make a note of the URL that is displayed on the form. The next few steps are performed on Microsoft Teams and you will return to Kloudspot Analytics Platform to enter the rest of the form fields
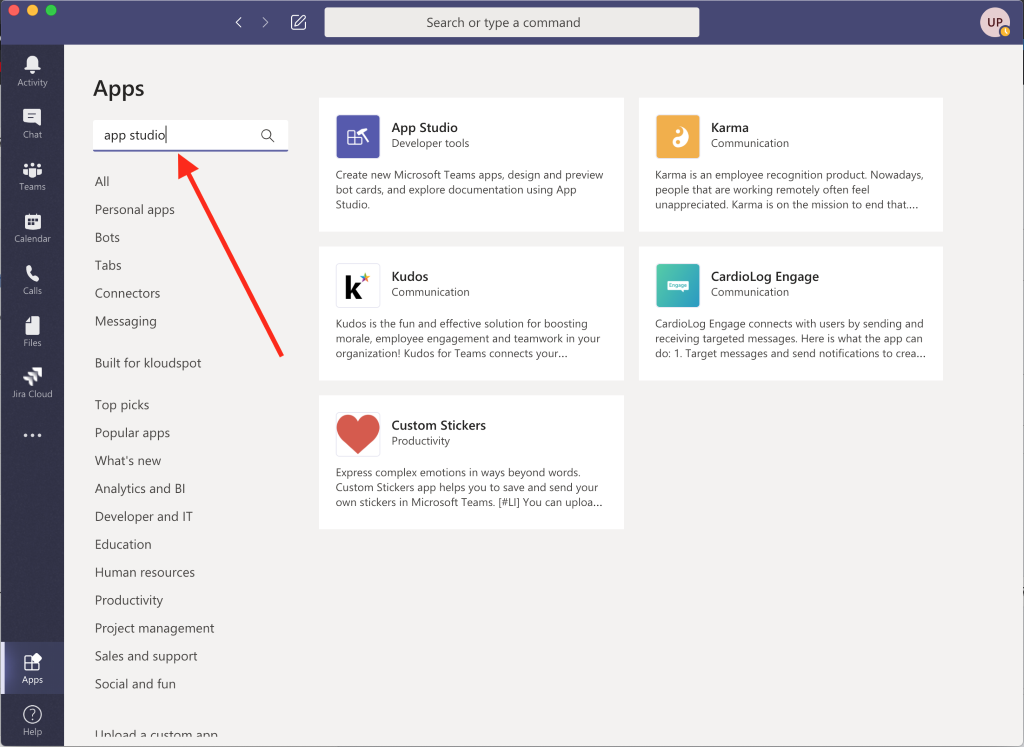
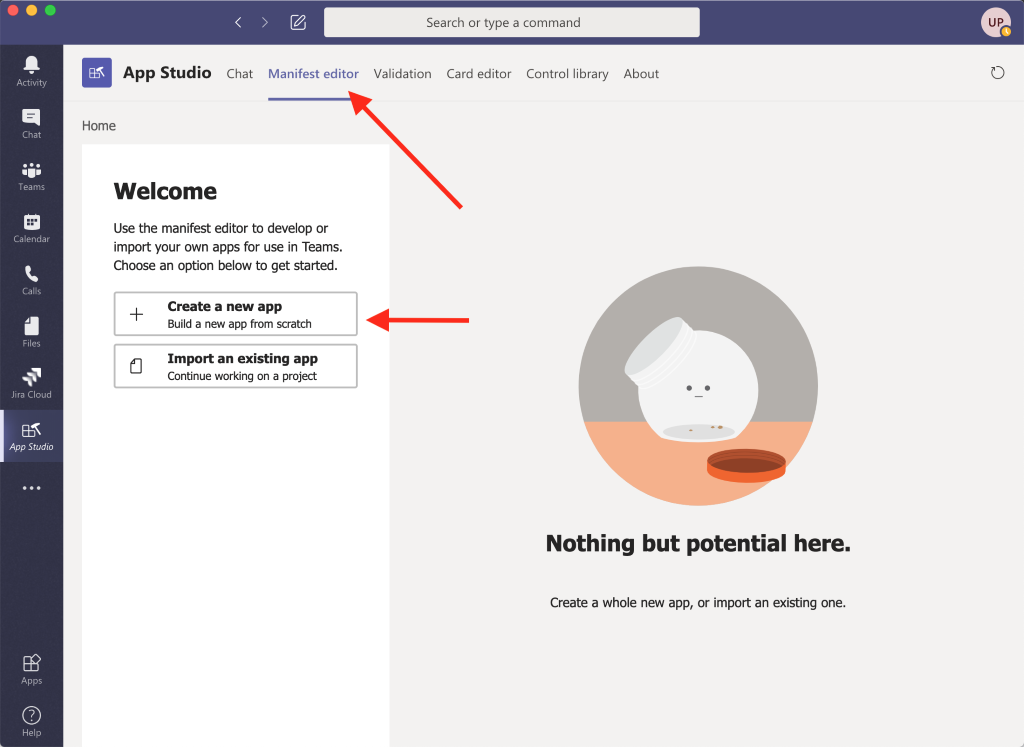
Open Microsoft Teams app on your desktop and Navigate to “Apps”
Search for “App Studio” and proceed to install it
Once installed, navigate to “Manifest Editor” tab on the app
Click on “Create a new app”
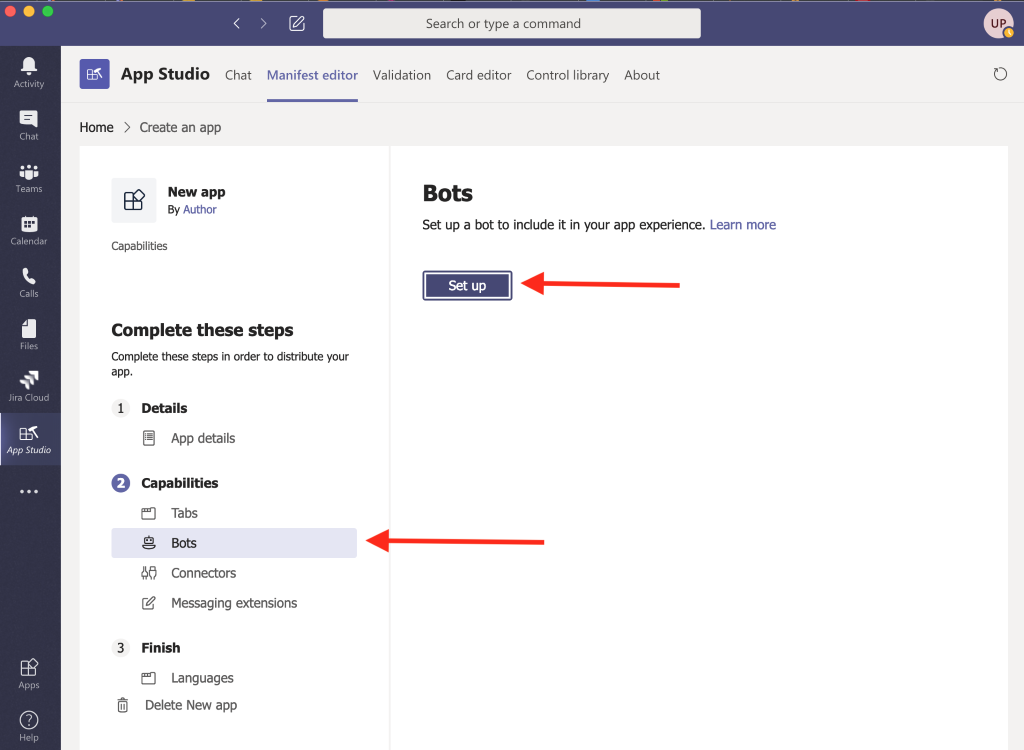
Jump directly to the “Capabilities” section and click on “Bots”
Click “Setup” to create a new bot
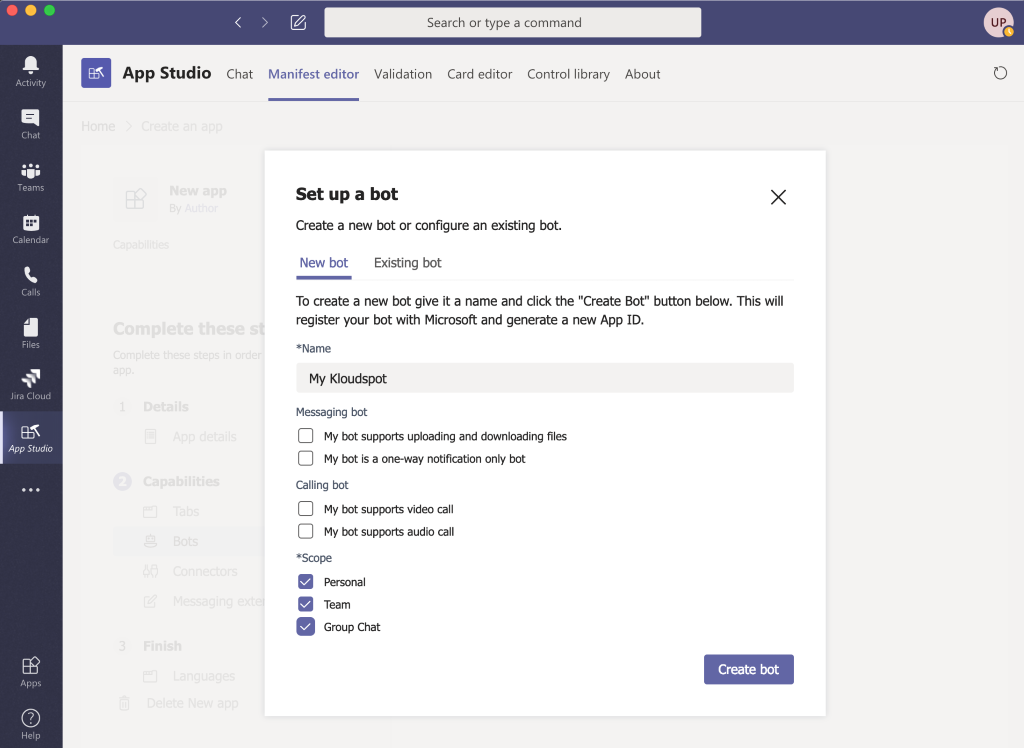
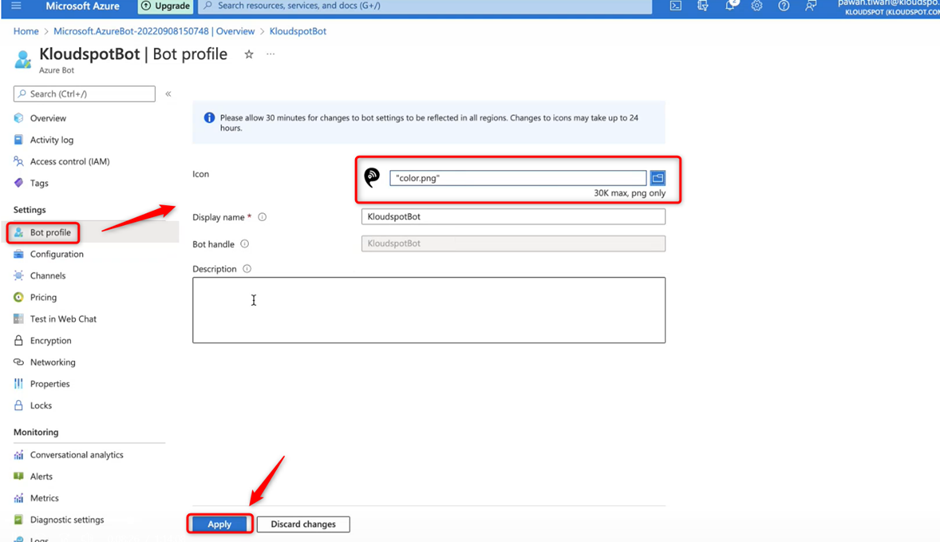
Provide any meaningful name for your Bot
Check all the options under “Scope” and click on “Create bot”
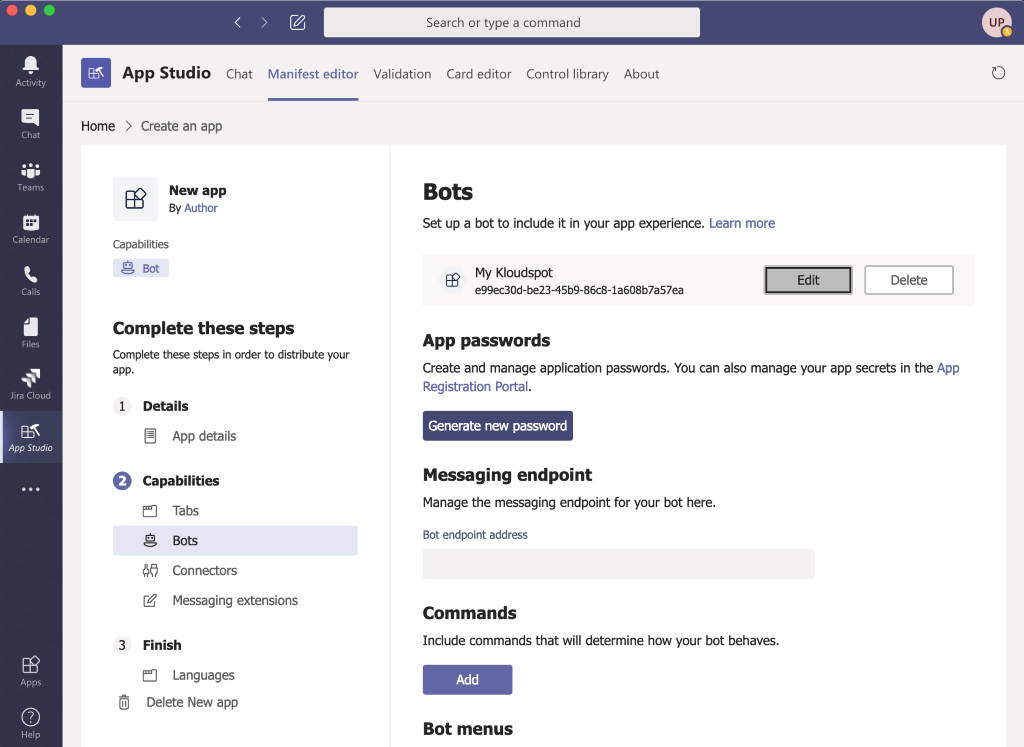
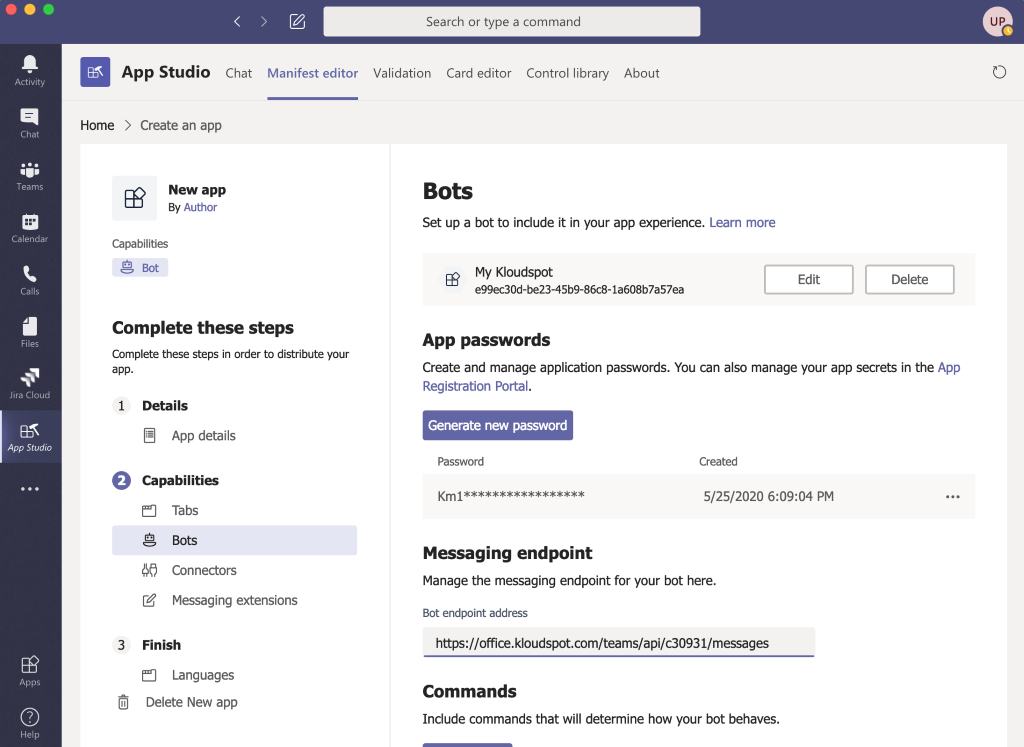
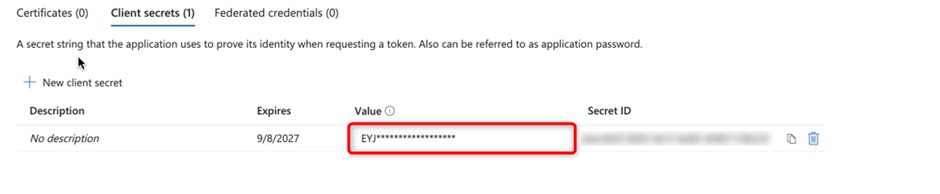
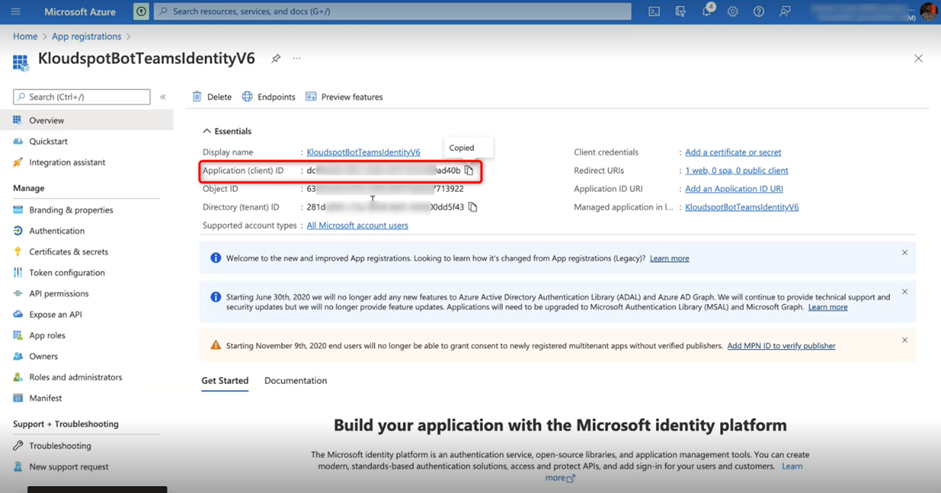
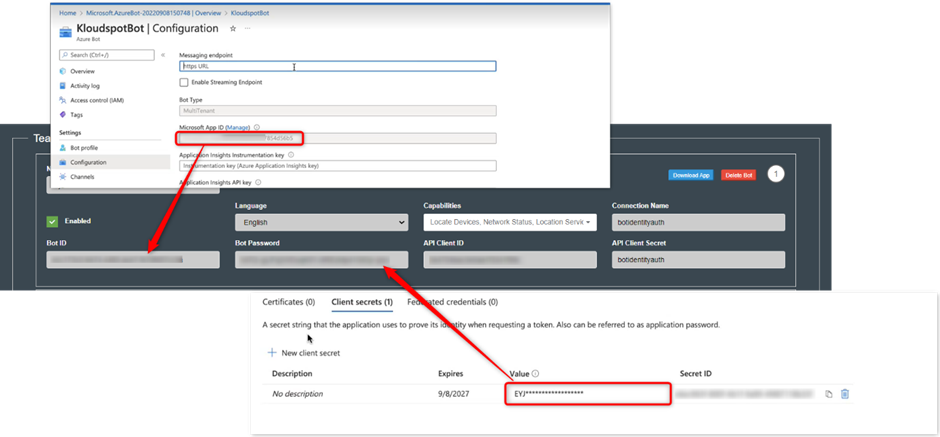
The newly created bot shows up displaying an ID under the name. Please make a note of the ID. You will need this later
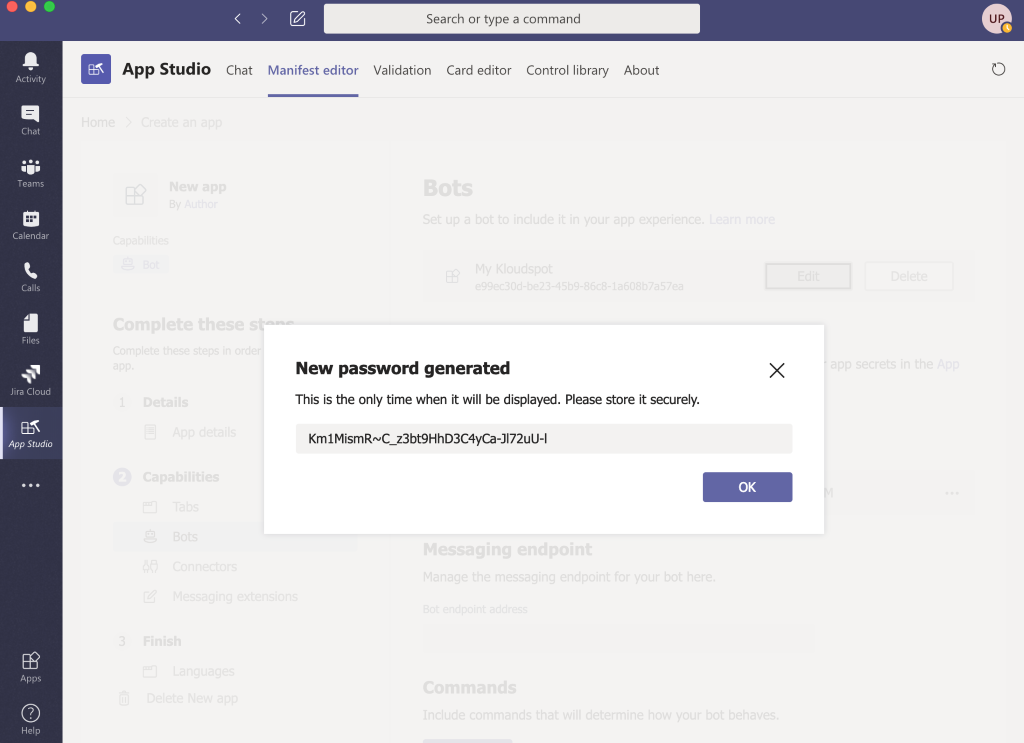
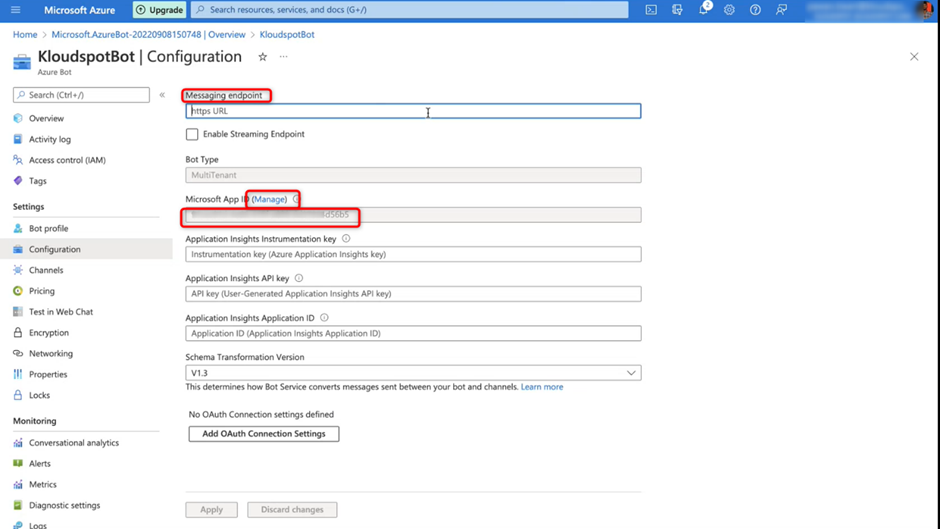
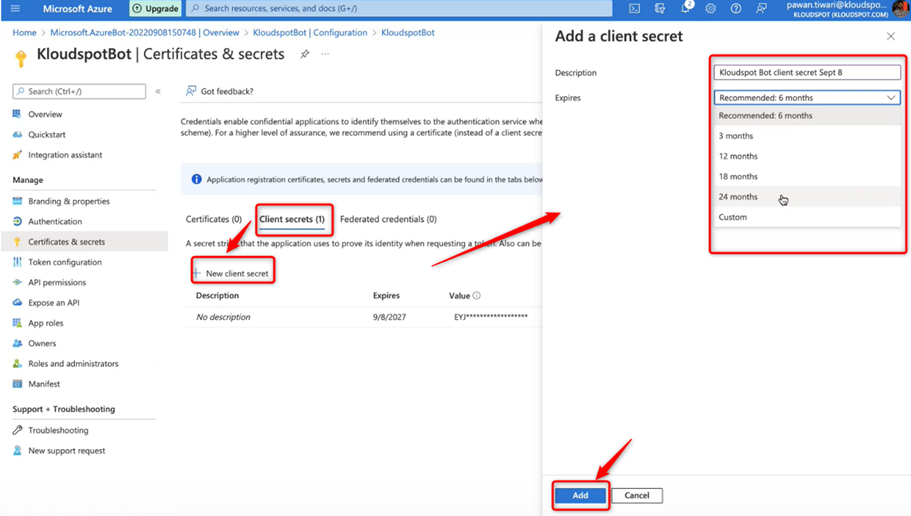
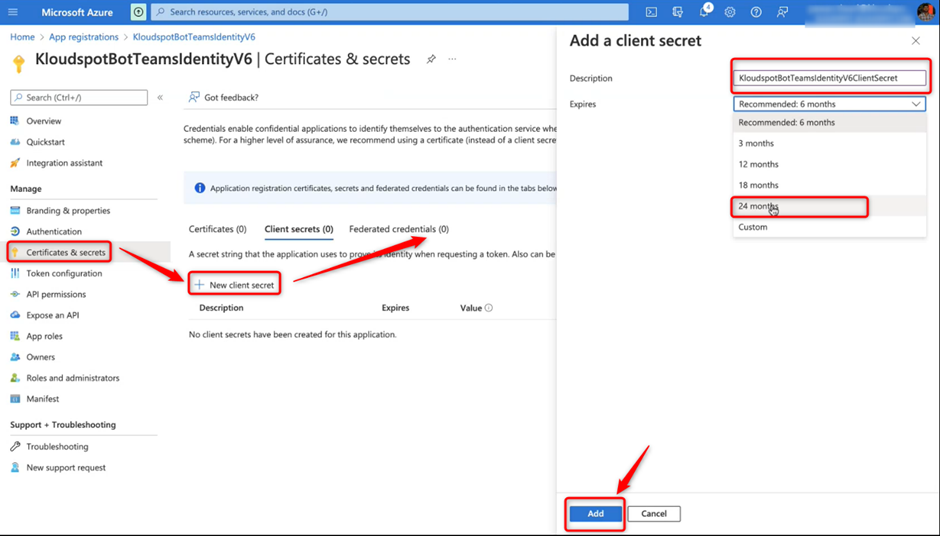
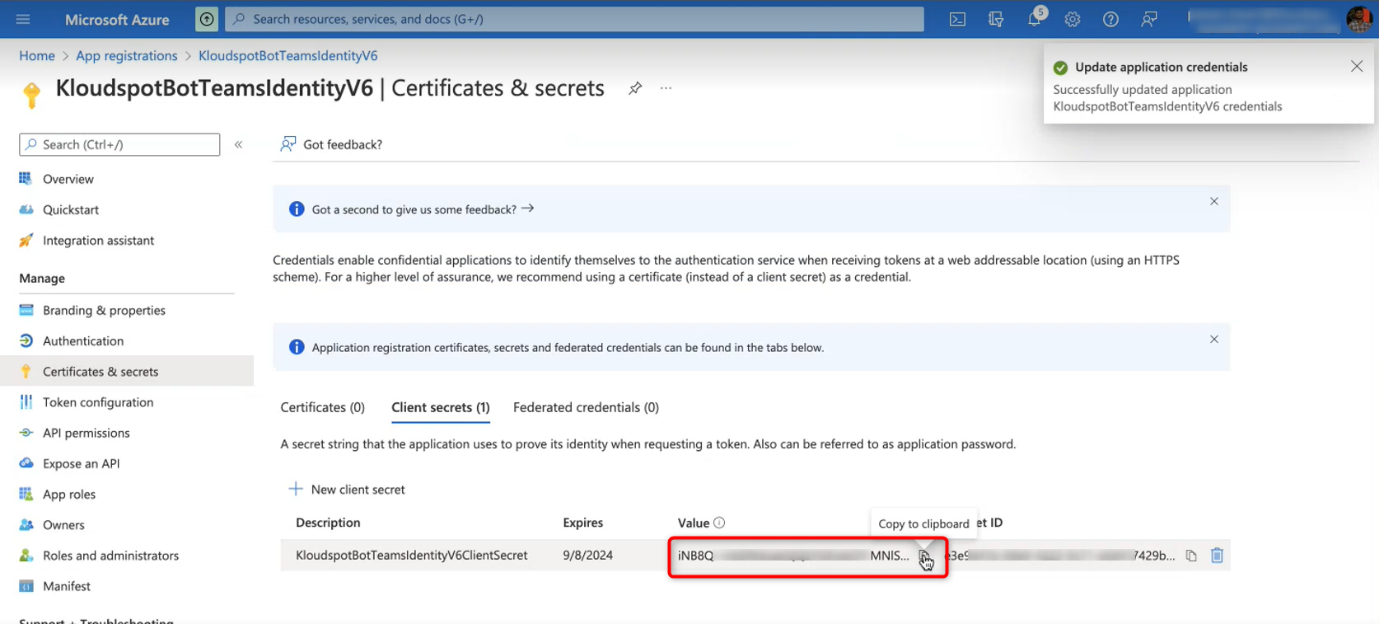
Click on “Generate new password” and make a note of the Password. You will need this later
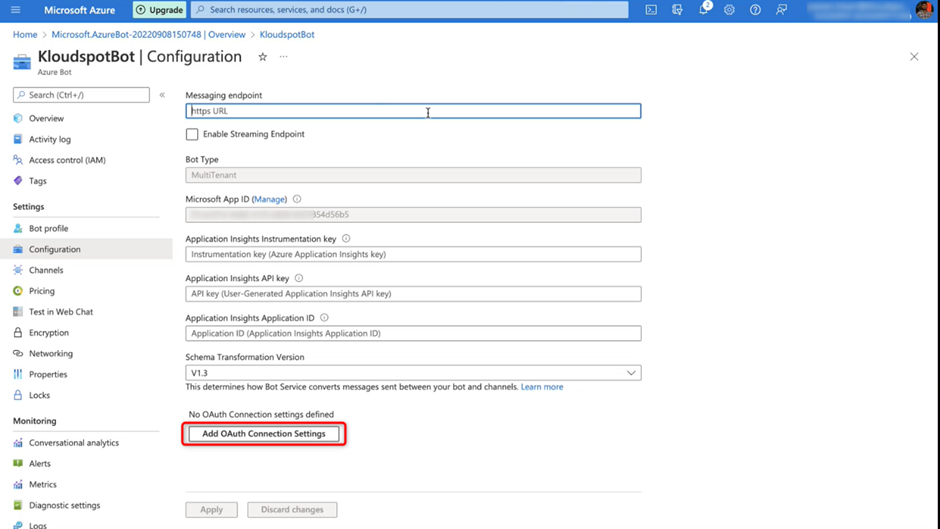
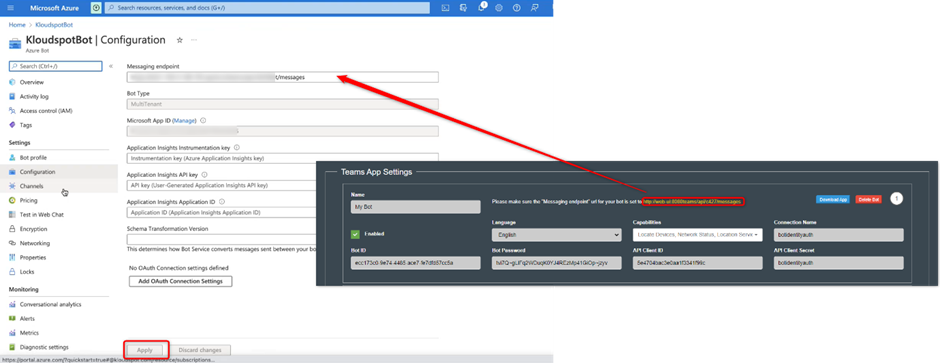
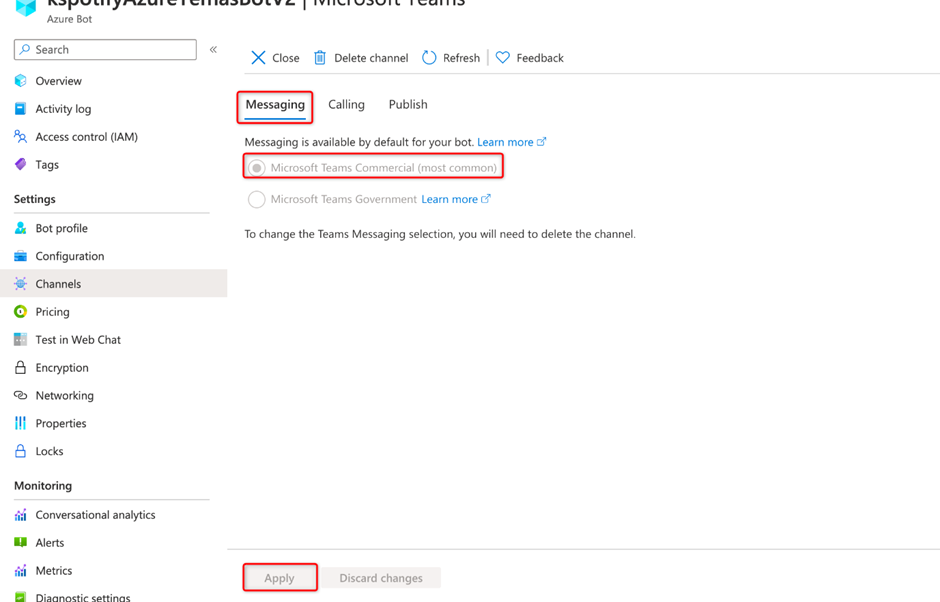
Under “Messaging Endpoint”, please enter the URL noted from the Kloudspot Analytics Platform and tab out. This will save the URL and display a green checkmark to confirm that the URL is saved
Head back to Kloudspot Analytics Platform to the Teams App Settings section
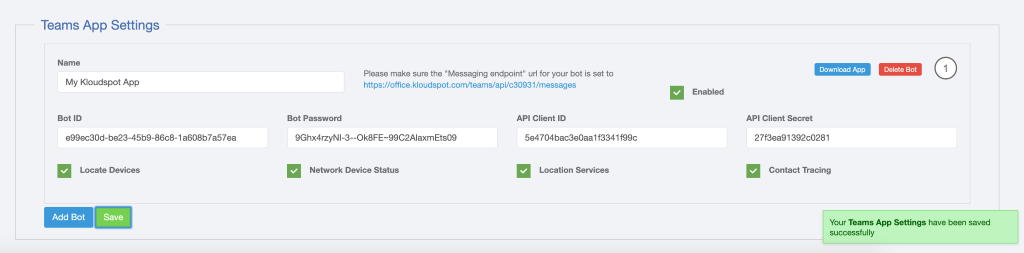
Provide a meaningful name for the App
Enter the Bot ID and Bot Password noted in earlier sections
Enter the API Client Key and API Client Secret
Check the “Enabled” checkbox to enable this bot
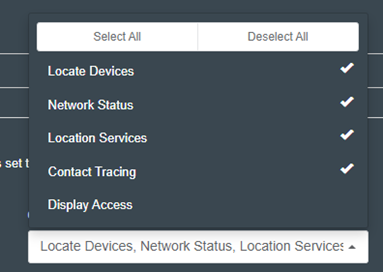
Choose one or more services that the Bot and click on “Save”
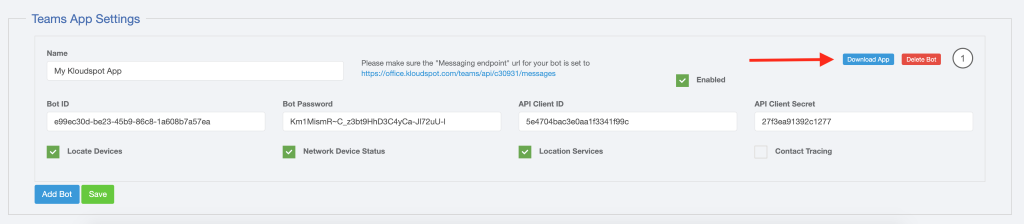
The Kloudspot Analytics App for Microsoft Teams is now complete
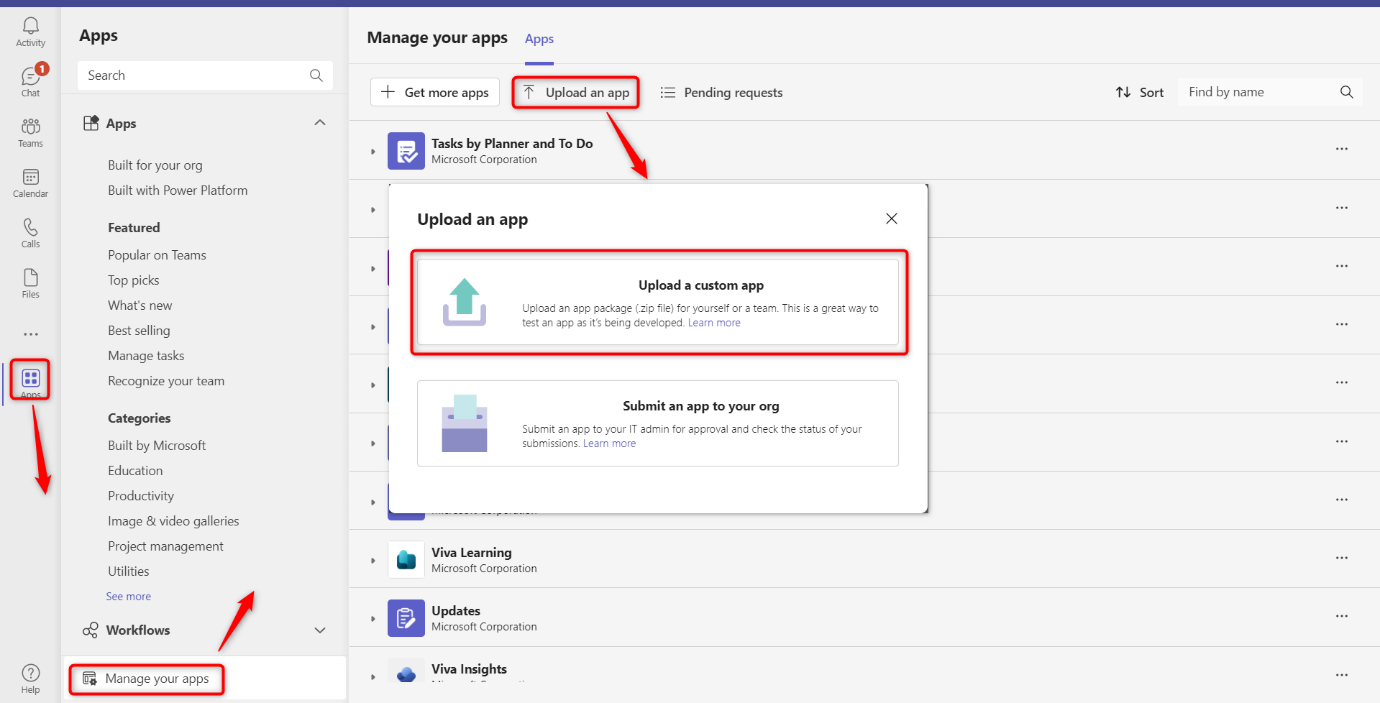
Click on “Download App” button to download the app (as a zip file)
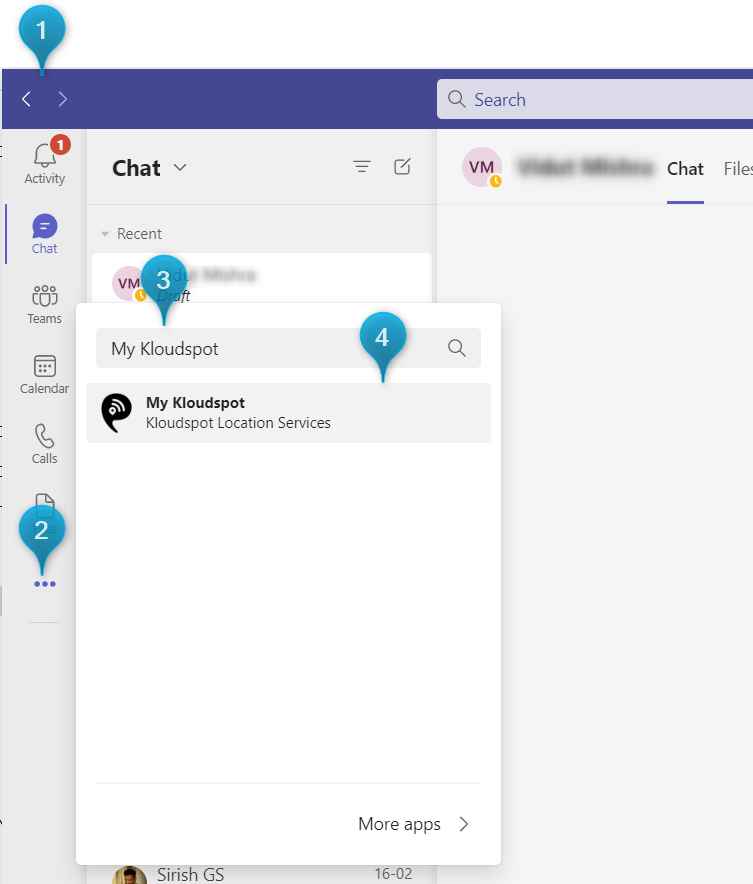
To install the app, Navigate to “Apps” on your Teams client and click on “Upload a custom app”
Use the downloaded zip file
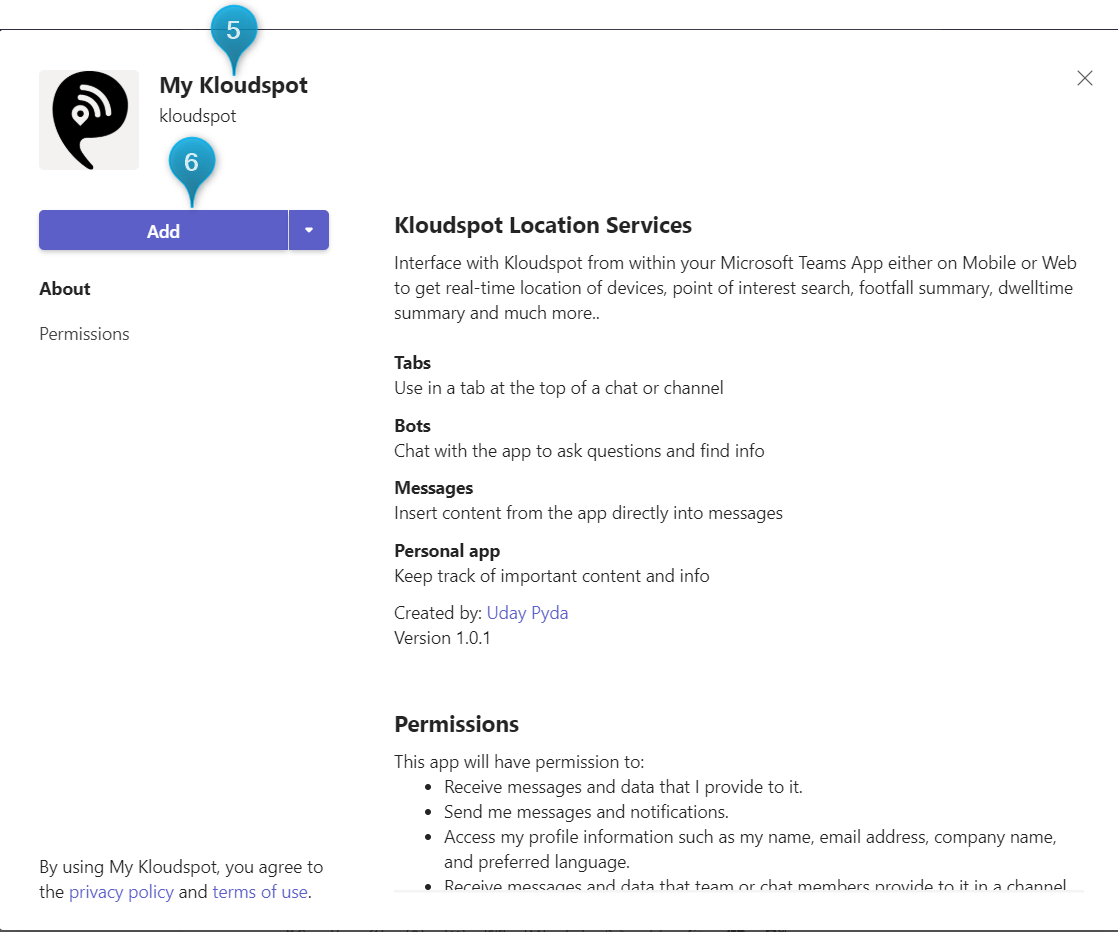
The app can be installed for the current user or for an entire team. If choosing to install for an entire team, select “Add to a team” option and choose the team
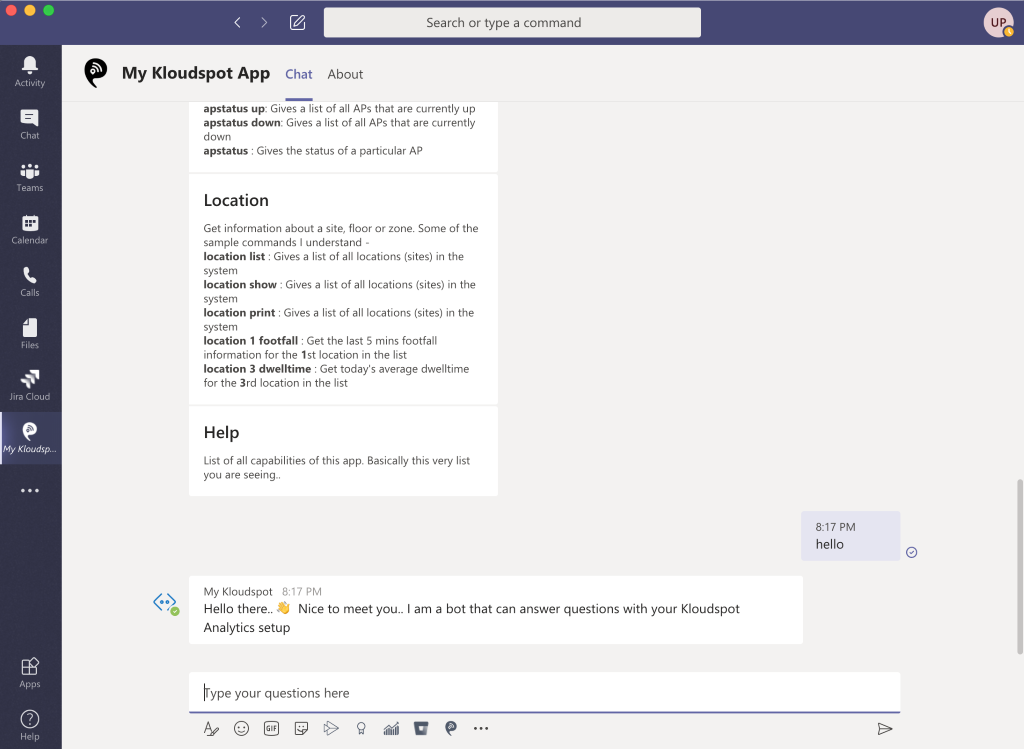
The app is successfully installed and ready to use
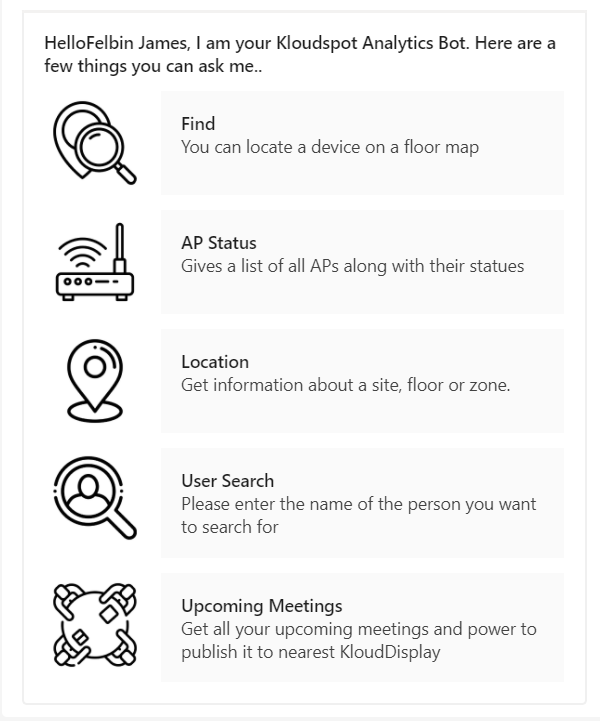
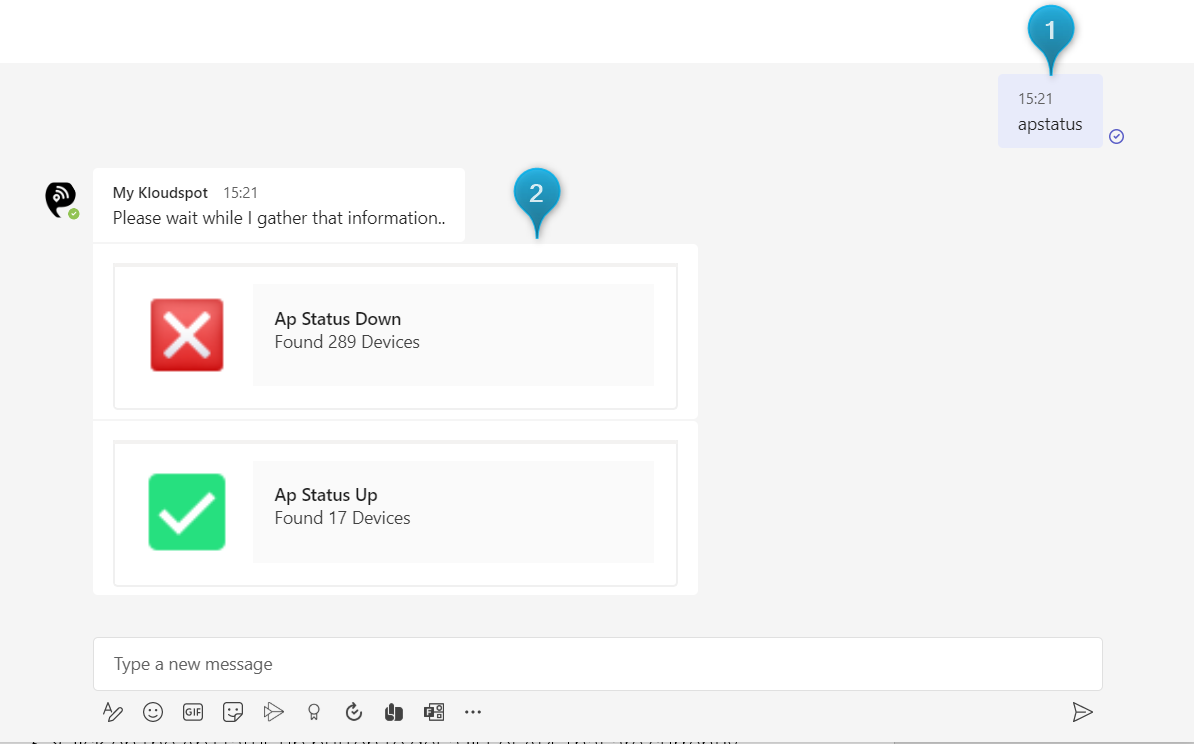
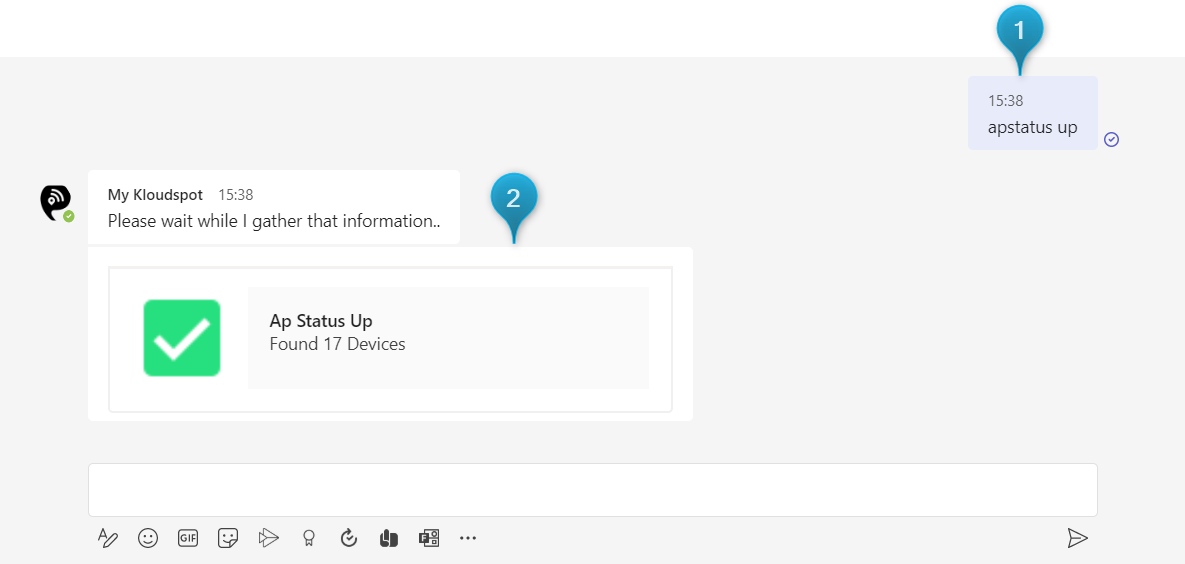
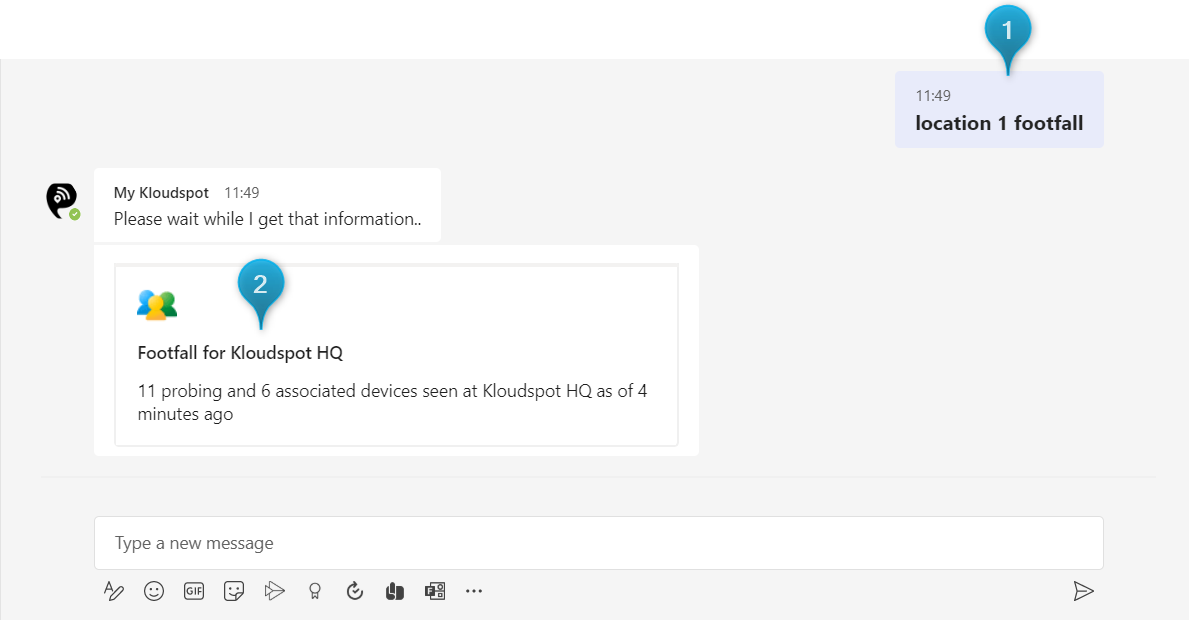
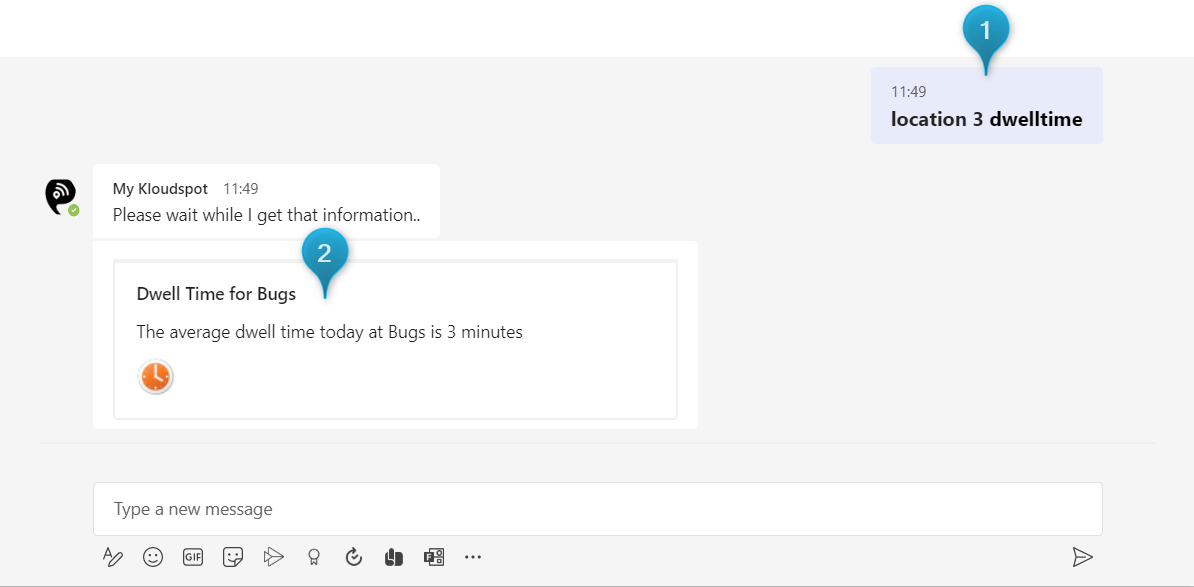
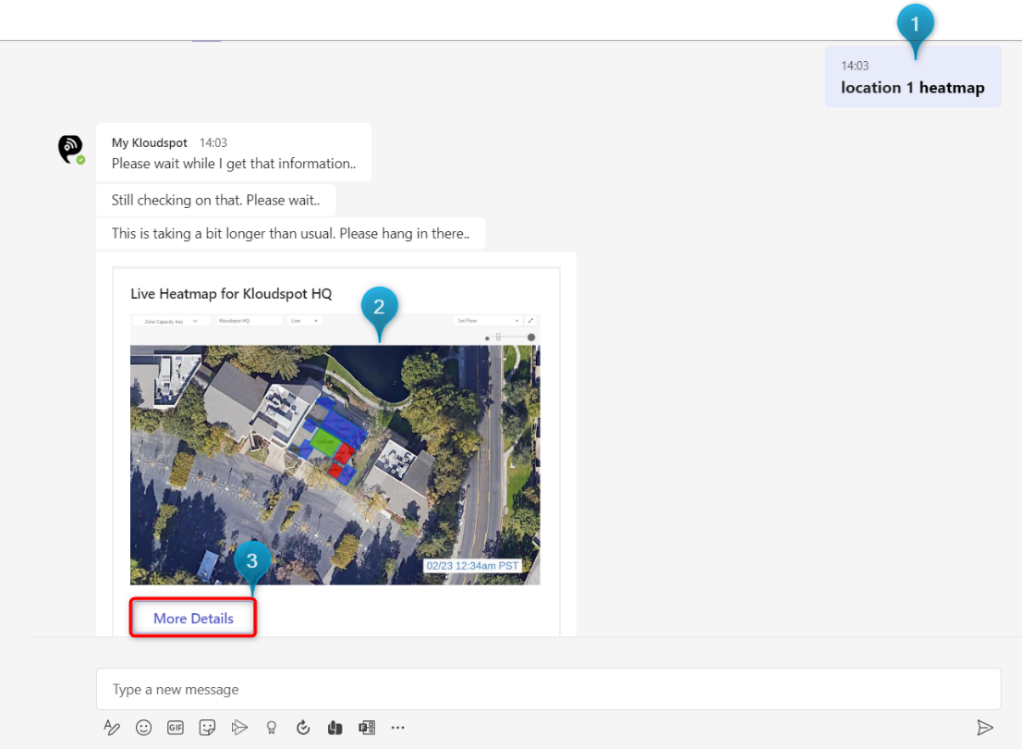
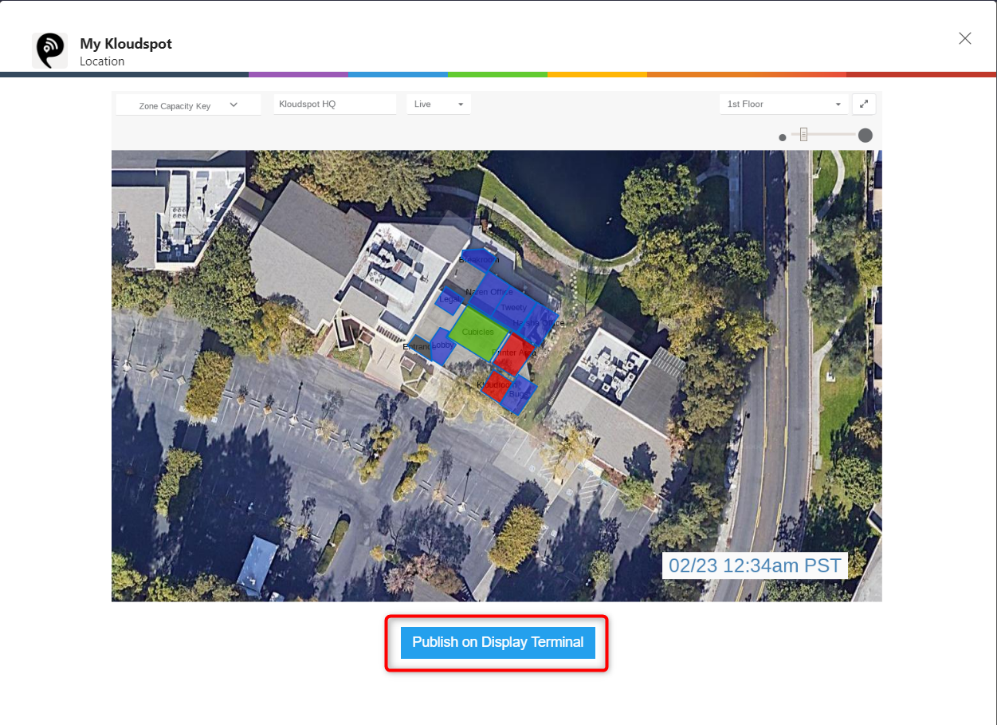
Type “hello” to test. The bot should respond back with a welcome message.
Aruba IoT Integration
OVERVIEW
This guide describes steps necessary to set-up an IoT information feed from
Aruba Instant or ArubaOS to KloudInsights.
RELATED DOCUMENTS
Aruba Instant documentation
Aruba Instant User Guide.pdf (chapter “BLE IoT for Data Communication”)
Aruba access points with integrated Bluetooth radios, or Aruba access points
equipped with an Aruba USB Bluetooth radio (LS-BT1USB, JW315A orJW316A), are
required for integration with KloudInsights.
Software
The integration uses the Aruba IoT Telemetry Interface to forward Bluetooth
device information that is collected by the access points to KloudInsights.The
Aruba IoT Telemetry Interface is available in Aruba Instant/ArubaOS 8.4.0.0 or
higher.
Configuration of the Aruba IoT Telemetry Interface is achieved via IoT
profiles. The full configuration of IoT profiles is currently supported via
CLI on Aruba Instant (partly configurable via GUI) and ArubaOS and is
described in detail in the referenced product documentation within the chapter
“Related Documents.".
REQUIRED INFORMATION
Ask your Kloudspot support contact for the following information:
endpointUrl : the URL to send data to. It will be of the form https:// :/aruba-iot
endpointToken : A token to validate the payload.
ARUBA INSTANT
This chapter describes the configuration and verification steps necessary to
setup Aruba Instant for KloudInsights/
Set-up
Enter ‘config mode’:
config
Enable the Bluetooth radio on an Aruba Instant AP in standalone mode or on all APs in an Aruba Instant cluster.
ble mode beaconing
Add a new IoT transport profile using the set-up information collected in chapter “REQUIRED INFORMATION”
Apply the new configuration to the Aruba Instant AP/Cluster
exit
commit apply
Verification and Troubleshooting
Once the IoT profile has been configured and enabled, Aruba Instant
immediately connects to the backend server and starts sending telemetry
information.The commands below can be used to validate and troubleshoot the
IoT configuration and connectivity to the backend server.
Note: please ensure that access points’ Bluetooth radios have been enabled,
and that the access points receive data from the Bluetooth devices.
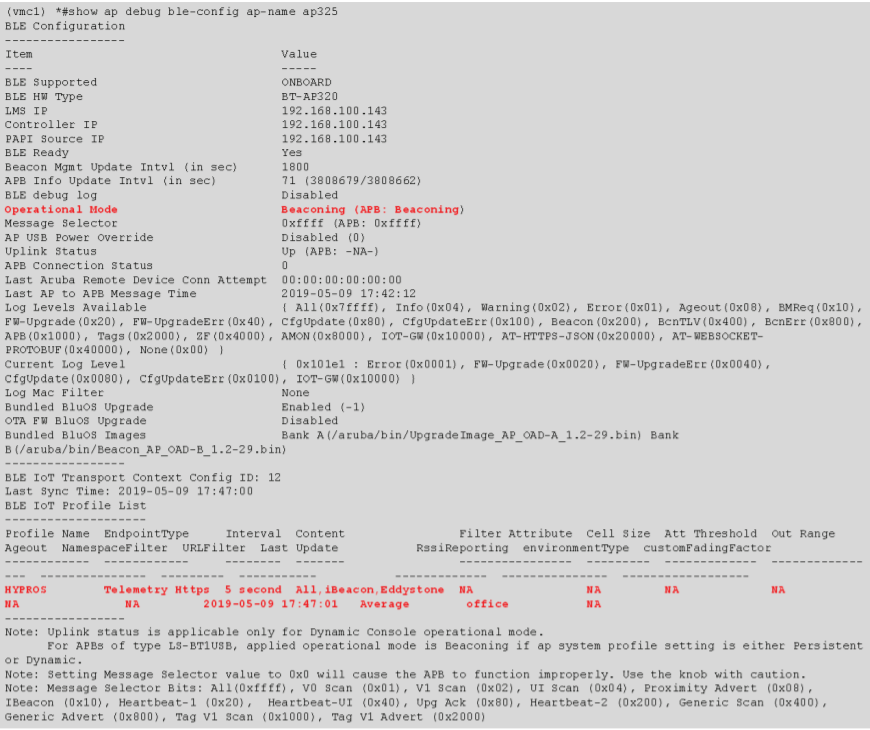
The “show ap debug ble-config” command should show the BLE Operation Mode as
“Beaconing,” and the configured IoT profile should be shown.
d0:d3:e0:c3:3b:e0# show ap debug ble-config
-----------------------------------------------
---------- IOT Radio Profiles -----------------
-----------------------------------------------
Profile Name        : ble
Radio Instance      : Internal
Radio Mode          : BLE
BLE Mode            : beaconing scanning
BLE Console         : On
BLE Tx Power (dBm)  : 0
-----------------------------------------------
Note: No Zigbee service profiles configured.


Radio Configuration
-------------------
Radio Information     TI ONBOARD Internal BLE
-----------------     ------------------------
Radio Profile Type    --
Zigbee Supported      No
APB MAC Address       b4:52:a9:34:07:53
Operational Mode      Persistent Console (APB: Persistent Console)
Bundled BluOS Images  Bank A(/aruba/bin/UpgradeImage_AP_OAD-A_1.2-37.bin) Bank B(/aruba/bin/Beacon_AP_OAD-B_1.2-37.bin)
-----------------
Miscellaneous Configuration
---------------------------
Item                            Value
----                            -----
FIPS Mode                       No
Master IP                       127.0.0.1
BLE Ready                       Yes
APB Info Update Intvl (in sec)  88 (1763/1716)
BLE debug log                   Enabled
Message Selector                0xffff (APB: 0xffff)
AP USB Power Override           Disabled (-1)
Uplink Status                   Up (APB: -NA-)
APB Connection Status           0
Time Last Message to APB        1970-01-01 00:00:00
Log Levels Available            { All(0xfffff), Info(0x04), Warning(0x02), Error(0x01), Ageout(0x08), BMReq(0x10), FW-Upgrade(0x20), FW-UpgradeErr(0x40), CfgUpdate(0x80), CfgUpdateErr(0x100), Beacon(0x200), BcnTLV(0x400), BcnErr(0x800), APB(0x1000), Tags(0x2000), ZF(0x4000), AMON(0x8000), IOT-GW(0x10000), AT-HTTPS-JSON(0x20000), AT-WEBSOCKET-PROTOBUF(0x40000), DevMgmt(0x80000), None(0x00) }
Current Log Level               { 0x901e1 : Error(0x0001), FW-Upgrade(0x0020), FW-UpgradeErr(0x0040), CfgUpdate(0x0080), CfgUpdateErr(0x0100), IOT-GW(0x10000), DevMgmt(0x80000) }
Log Mac Filter                  None
Bundled BluOS Upgrade           Enabled (-1)
OTA FW BluOS Upgrade            Disabled
-----------------
BLE IoT Transport Context Config ID: 1
Last Sync Time: 2020-07-08 21:50:00
BLE IoT Profile List
--------------------
Profile Name    EndpointType     Interval   Content                   Filter Attribute  Cell Size  Att Threshold  Out Range Ageout  NamespaceFilter  URLFilter  Last Update           RssiReporting  environmentType  customFadingFactor  deviceCountsOnly  rtlsDestMAC        vendorFilter
------------    ------------     --------   -------                   ----------------  ---------  -------------  ----------------  ---------------  ---------  -----------           -------------  ---------------  ------------------  ----------------  -----------        ------------
kloudspot (51)  Telemetry Https  10 second  iBeacon(8),Eddystone(10)  NA                NA         NA             NA                NA               NA         2020-07-08 21:57:31   Average        office           NA                  FALSE             00:00:00:00:00:00
-----------------
Note: Uplink status is applicable only for Controller with Dynamic Console operational mode.
      For APBs of type LS-BT1USB, applied operational mode is Beaconing if ap system profile setting is either Persistent or Dynamic.
Note: Setting Message Selector value to 0x0 will cause the APB to function improperly. Use the knob with caution.
Note: Message Selector Bits: All(0xffff), V0 Scan (0x01), V1 Scan (0x02), UI Scan (0x04), Proximity Advert (0x08), IBeacon (0x10), Heartbeat-1 (0x20),  Heartbeat-UI (0x40), Upg Ack (0x80), Heartbeat-2 (0x200), Generic Scan (0x400), Generic Advert (0x800), Tag V1 Scan (0x1000), Tag V1 Advert (0x2000)
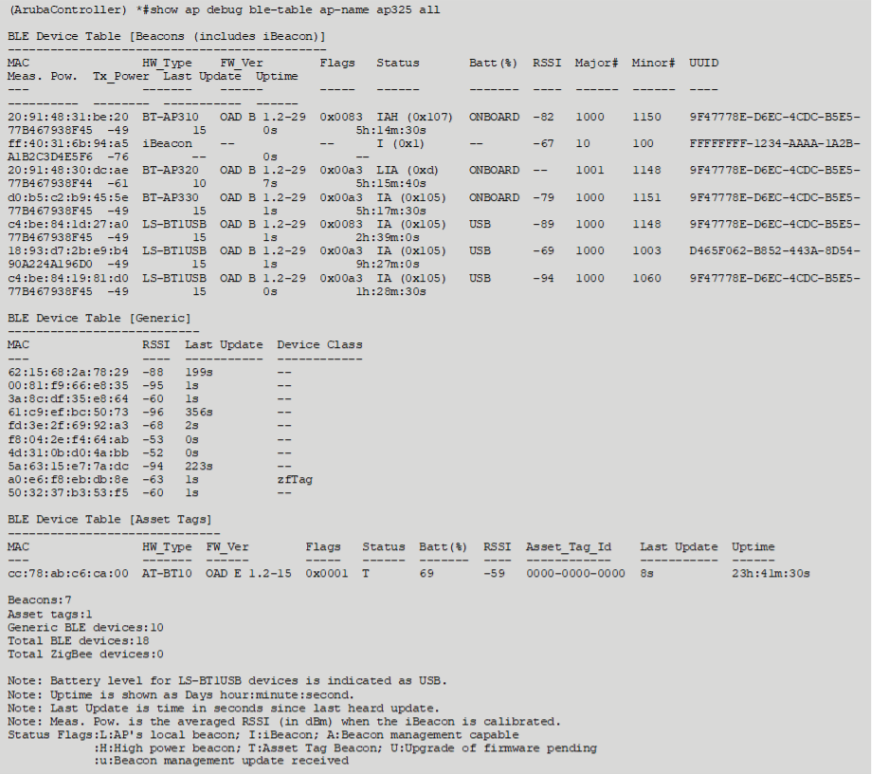
Use the “show ap debug ble-table all” command to verify if - and which -
Bluetooth devices can be seen by the AP.
d0:d3:e0:c3:3b:e0# show ap debug ble-table all

BLE Device Table [Aruba Beacons]
--------------------------------
MAC                HW_Type   FW_Ver        Flags   Status  Batt(%)  RSSI  Major#  Minor#  UUID                                  Meas. Pow.  Tx_Power  Last Update  Uptime
---                -------   ------        -----   ------  -------  ----  ------  ------  ----                                  ----------  --------  -----------  ------
b4:52:a9:34:07:53  BT-AP303  OAD B 1.2-37  0x01a3  LIA     ONBOARD  --    0       0       4152554E-F99B-4A3B-86D0-947070693A78  -56         14        I:4s         1h:40m:0s

BLE Device Table [Generic]
---------------------------
MAC                Address Type  RSSI  Last Update  Device Class
---                ------------  ----  -----------  ------------
5f:a3:0d:7c:fe:17  Private R     -56   I:0s         --
63:15:26:e9:98:1a  Private R     -50   I:1390s      --
58:cb:c4:25:90:2d  Private R     -42   I:338s       --
7b:67:2f:f0:46:4e  Private R     -42   I:1545s      --
01:5e:6a:46:34:79  Private NR    -87   I:0s         --
47:ad:f8:ff:2e:7c  Private R     -57   I:1s         --
d9:93:af:72:2e:8c  Static        -74   I:1s         --
60:81:33:46:98:91  Private R     -51   I:1390s      --
67:85:77:bb:9a:e8  Private R     -42   I:0s         --
46:b9:a9:5d:ca:eb  Private R     -53   I:0s         --
4e:0d:d5:6e:1c:fd  Private R     -52   I:901s       --
79:27:3f:15:ef:23  Private R     -84   I:0s         --
a4:83:e7:9c:39:2c  Public        -53   I:0s         --
7d:3c:66:1a:37:36  Private R     -94   I:1843s      --
44:54:ed:3a:b3:37  Private R     -51   I:1801s      --
74:5b:84:08:b7:64  Private R     -54   I:901s       --
5a:a9:82:c3:81:69  Private R     -66   I:244s       --
5c:9c:95:47:c5:a0  Private R     -52   I:1801s      --
cc:04:b4:02:51:af  Public        -89   I:0s         --
24:67:63:23:53:d5  Private NR    -83   I:589s       --
46:33:09:75:eb:ee  Private R     -57   I:1s         --
48:da:99:74:83:f4  Private R     -56   I:0s         --
ac:23:3f:5e:67:ff  Public        -41   I:0s         iBeacon, eddystone

Beacons:1
Generic BLE devices:23
Total BLE devices:24


Note: Battery level for LS-BT1USB devices is indicated as USB.
Note: Uptime is shown as Days hour:minute:second.
Note: Last Update is time in seconds since last heard update.
Note: Meas. Pow. is the averaged RSSI (in dBm) when the iBeacon is calibrated.
Status Flags:L:AP's local beacon; I:iBeacon; A:Beacon management capable
            :H:High power beacon; T:Asset Tag Beacon; U:Upgrade of firmware pending
            :u:Beacon management update received
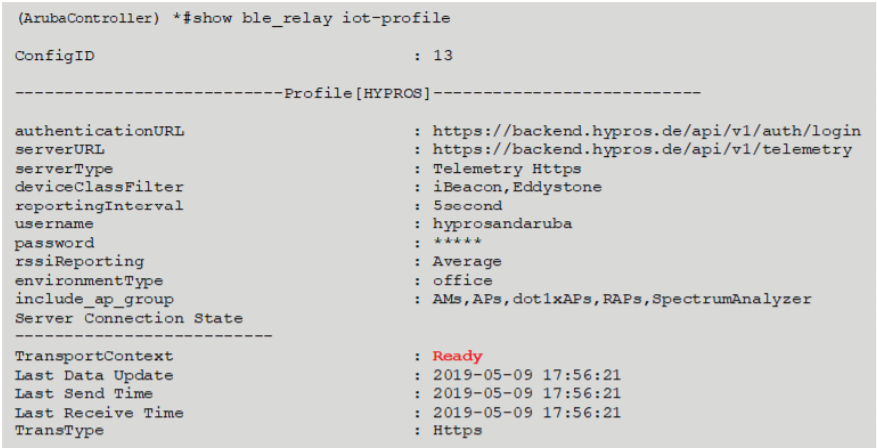
The commands “show ap debug ble-relay iot-profile” can be used to check the
IoT profile configuration and server connection status of the IoT profile. The
state should be displayed as “Ready.”
d0:d3:e0:c3:3b:e0# show ap debug ble-relay iot-profile

ConfigID                                : 1

---------------------------Profile[kloudspot]---------------------------
serverURL                               : https://smoke.kloudspot.com:48083/aruba-iot
serverType                              : Telemetry Https
deviceClassFilter                       : iBeacon,Eddystone
reportingInterval                       : 10 second
accessToken                             : 12345
clientID                                : kloudspot
rssiReporting                           : Average
environmentType                         : office
accessID                                : kloudspot
Server Connection State
--------------------------
TransportContext                        : Ready
Last Data Update                        : 2020-07-08 22:01:42
Last Send Time                          : 2020-07-08 22:01:43
Last Receive Time                       : 2020-07-08 22:01:43
TransType                               : Https
If the server connection status does not show “Ready,” use the command “show
ap debug ble-relay report ” for more detailed connection logs for
troubleshooting purposes.
d0:d3:e0:c3:3b:e0# show ap debug ble-relay report kloudspot

---------------------------Profile[kloudspot]---------------------------
Last Send Time: 2020-07-08 22:03:03

Sent report to Endpoint server (6s) ago: success 84, failed 0, last curl result code 200

Timeout(-1):20 Jobs added: 84

Server: https://<server>/aruba-iot with proxy: NA

Proxy username: NA, password: NA

Vlan Interface                          : Not Configured
Request to Server:
{"meta": {"version": 1}, "reporter": {"name": "d0:d3:e0:c3:3b:e0", "mac": "D0:D3:E0:C3:3B:E0", "ipv4": "10.90.37.235", "hwType": "AP-303", "swVersion": "8.6.0.4-8.6.0.4", "swBuild": "74969", "time": 1594245782}, "reported": [{"deviceClass": ["iBeacon", "eddystone"], "model": "iBeacon", "vendorName": "Apple", "mac": "AC:23:3F:5E:67:FF", "stats": {"adv_cnt": 7641266, "frame_cnt": 12, "uptime": 78288870}, "beacons": [{"eddystone": {"uid": {"nid": "00112233445566778899", "bid": "ABCDE23A00E1"}, "url": {"prefix": 1, "urlBytes": "6D696E65770012"}, "power": -24}}, {"ibeacon": {"uuid": "E2C56DB5-DFFB-48D2-B060-D0F5A71096E0", "major": 0, "minor": 0, "power": -59}}], "rssi": {"avg": -41}, "BeaconEvent": {"event": "update"}, "lastSeen": 7, "sensors": {"voltage": 3.12, "temperatureC": 25.0}}]}

Last Curl logs:
....
Host: <server>
Content-Type: application/json
Authorization: Bearer 12345
Accept: application/json
Content-Length: 792

* upload completely sent off: 792 out of 792 bytes
< HTTP/1.1 200 OK
< Server: nginx/1.14.0 (Ubuntu)
< Date: Wed, 08 Jul 2020 22:03:03 GMT
< Transfer-Encoding: chunked
< Connection: keep-alive
< Keep-Alive: timeout=5
< Vary: Accept-Encoding, User-Agent
<
* Curl_http_done: called premature == 0
* Connection #0 to host smoke.kloudspot.com left intact
ARUBAOS
This chapter describes the configuration and verification steps necessary to
set-up the IoT feed to KloudInsights on controller-based installations running
ArubaOS.
In controller based set-ups the BLE radios and IoT profiles have to be enabled per AP groups.
Mobility Master vs. Standalone ControllerThe configuration steps for IoT profiles in a mobility master and a standalone controller set-up are the same except that in a mobility master scenario the configuration is done on the mobility master using the configuration hierarchy.
Set-up
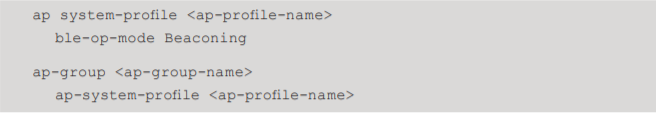
Enable the Bluetooth radio on the desired AP groups by setting the ble-op-mode to Beaconing in the corresponding AP system profile.
The deviceClassFilter all is enabled by default. The deviceClassFilter all has to be explicitly set to disable-dIn to send only telemetry updates for ibeacon and eddystone devices to the backed.
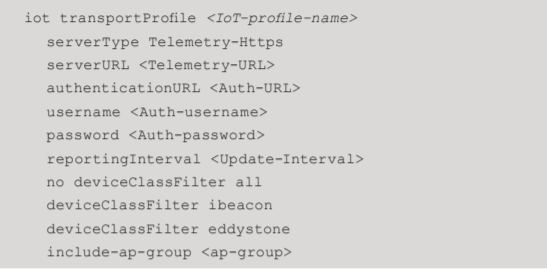
Add a new IoT transport profile using the set-up information collected in chapter “REQUIRED INFORMATION”.
Enable the configured IoT profile.
Apply the new configuration to the Aruba controller/mobility master.
Verification and Troubleshooting
Mobility Master vs. Standalone ControllerThe verification and troubleshooting
steps for IoT profiles in a mobility master and a standalone controller set-up
are the same except that in a mobility master scenario the verification and
troubleshooting is done on the managed devices.
After the IoT profile has been configured and enabled the Aruba controller
will immediately connect to the backend server and start sending telemetry
information.
The commands below can used be to validate and troubleshoot the IoT
configuration and connectivity to the backend server.
Check first to ensure that the access points’ BLE radios have been enabled and
if the APs can receive data form the BLE devices. The show ap debug ble-
config [ap-name|ip-addr|ip6-addr] command should show the BLE Operation Mode
as “Beaconing” and the configured IoT profile should be displayed.
Using the show ap debug ble-table [ap-name|ip-addr|ip6-addr] all command
verify if - and which - Bluetooth devices are seen by the access points.
Use the command show ble_relay iot-profile to check the IoT profile
configuration and server connection status of the IoT profile. The state of
the response should show “Ready.”
If the server connection status does not show “Ready,” use the command show
ble_relay report report [] to obtain more detailed connection logs for
troubleshooting.
EnGenius Configuration
Introduction
Services such as CRM tools, presence analytics, or location-aware services
need to constantly collect data. EnGenius Cloud Access Points are sufficient
for this. EnGenius Presence Service, continuously gathers data and sends the
data to KloudInsights.
For this, the device needs to be registered on the EnGenius portal and
KloudInsights. This document describes how to do this.
Step 1: Register a device in the EnGenius portal
Before adding the access point to KloudInsights, the device needs to be
registered in the Engenius portal. Refer to the Engenius help files to learn
how to register a new device.
The server location requested during registration will be in the given format.
https:/engenius/events
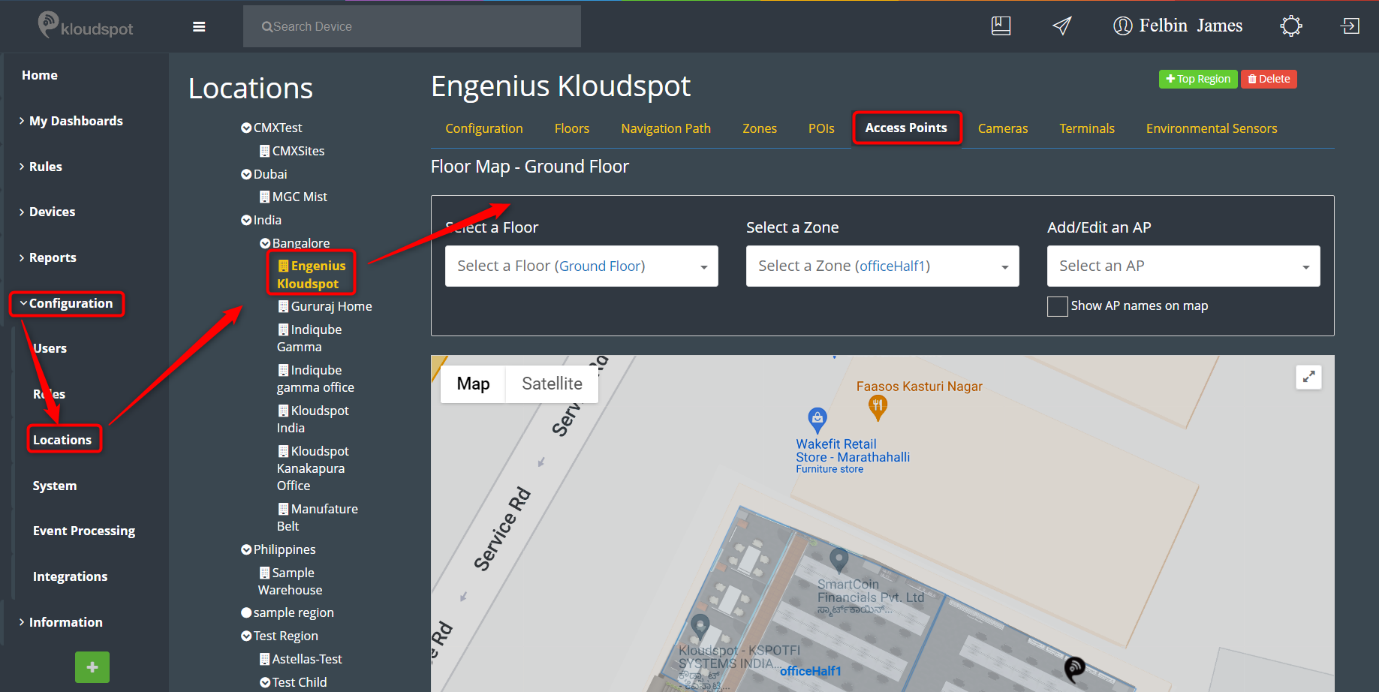
Step 2: Add a new AP to the Insights location
After configuring the device in the EnGenius portal, the next step is to add the device to Insights. To do so Log in to KloudInsights.
2. Then navigate to Configuration > Location > (Select location) > Access
Points.
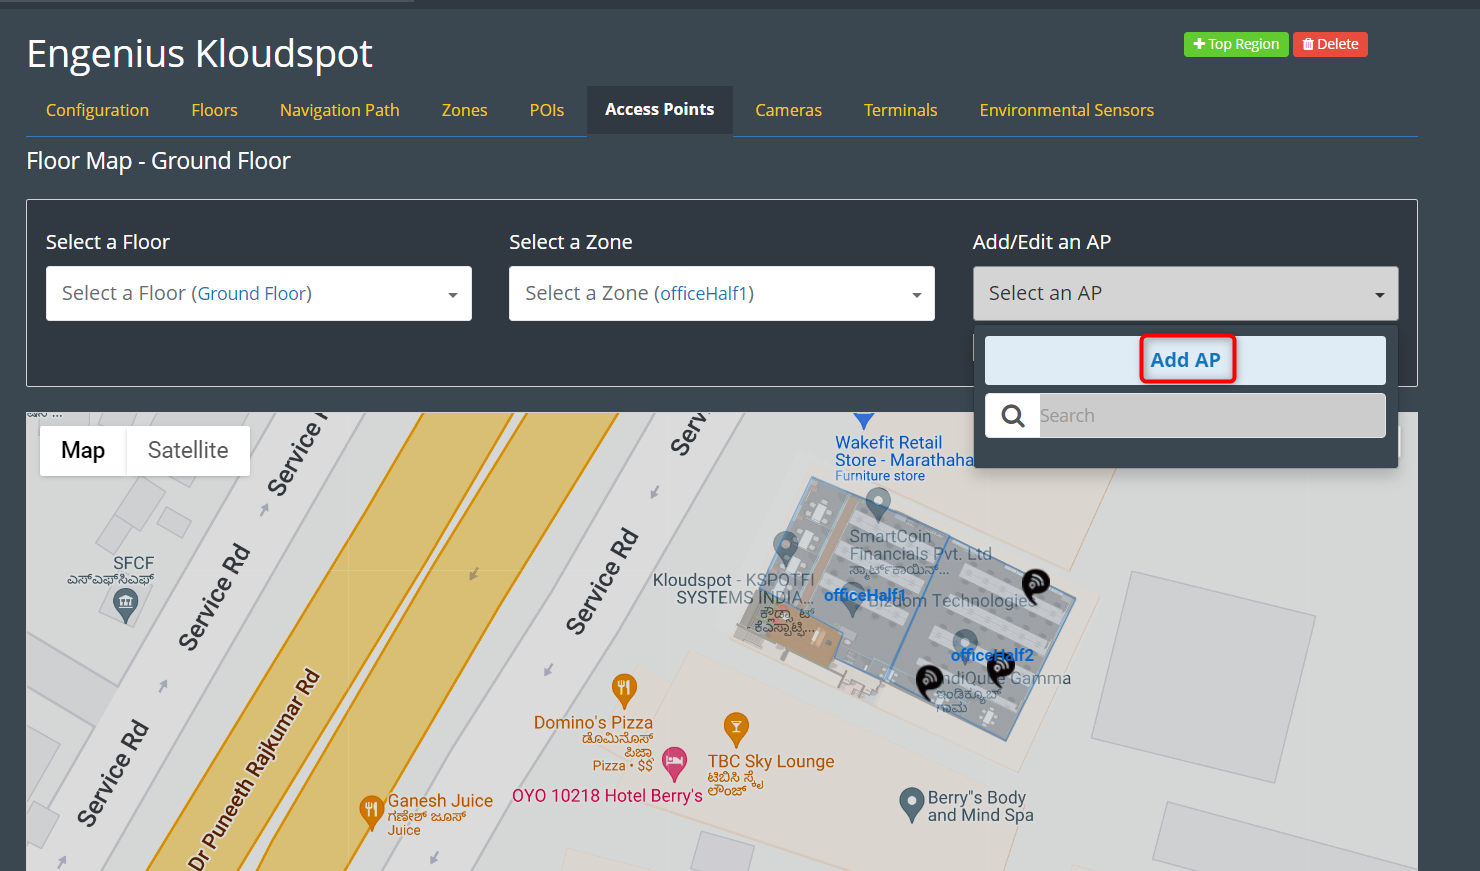
3. Select the floor and zone to which you want to add the access point from
the newly opened window.
4. Then click the Add AP button from the Add/Edit an AP dropdown
menu.
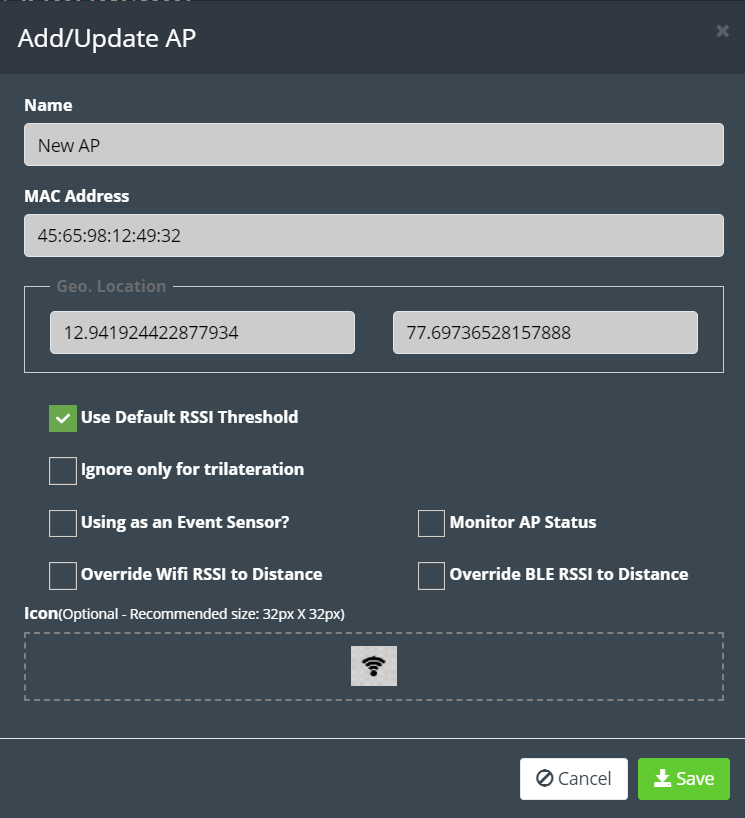
5. In the popup window that appears, add the Name, Mac address and Logo.
Note: In Mac address field, you must enter the radio Mac address.
6. Then click the Save button to save the changes.
Note: To learn more about adding an access point, check the Insights
admin manual.
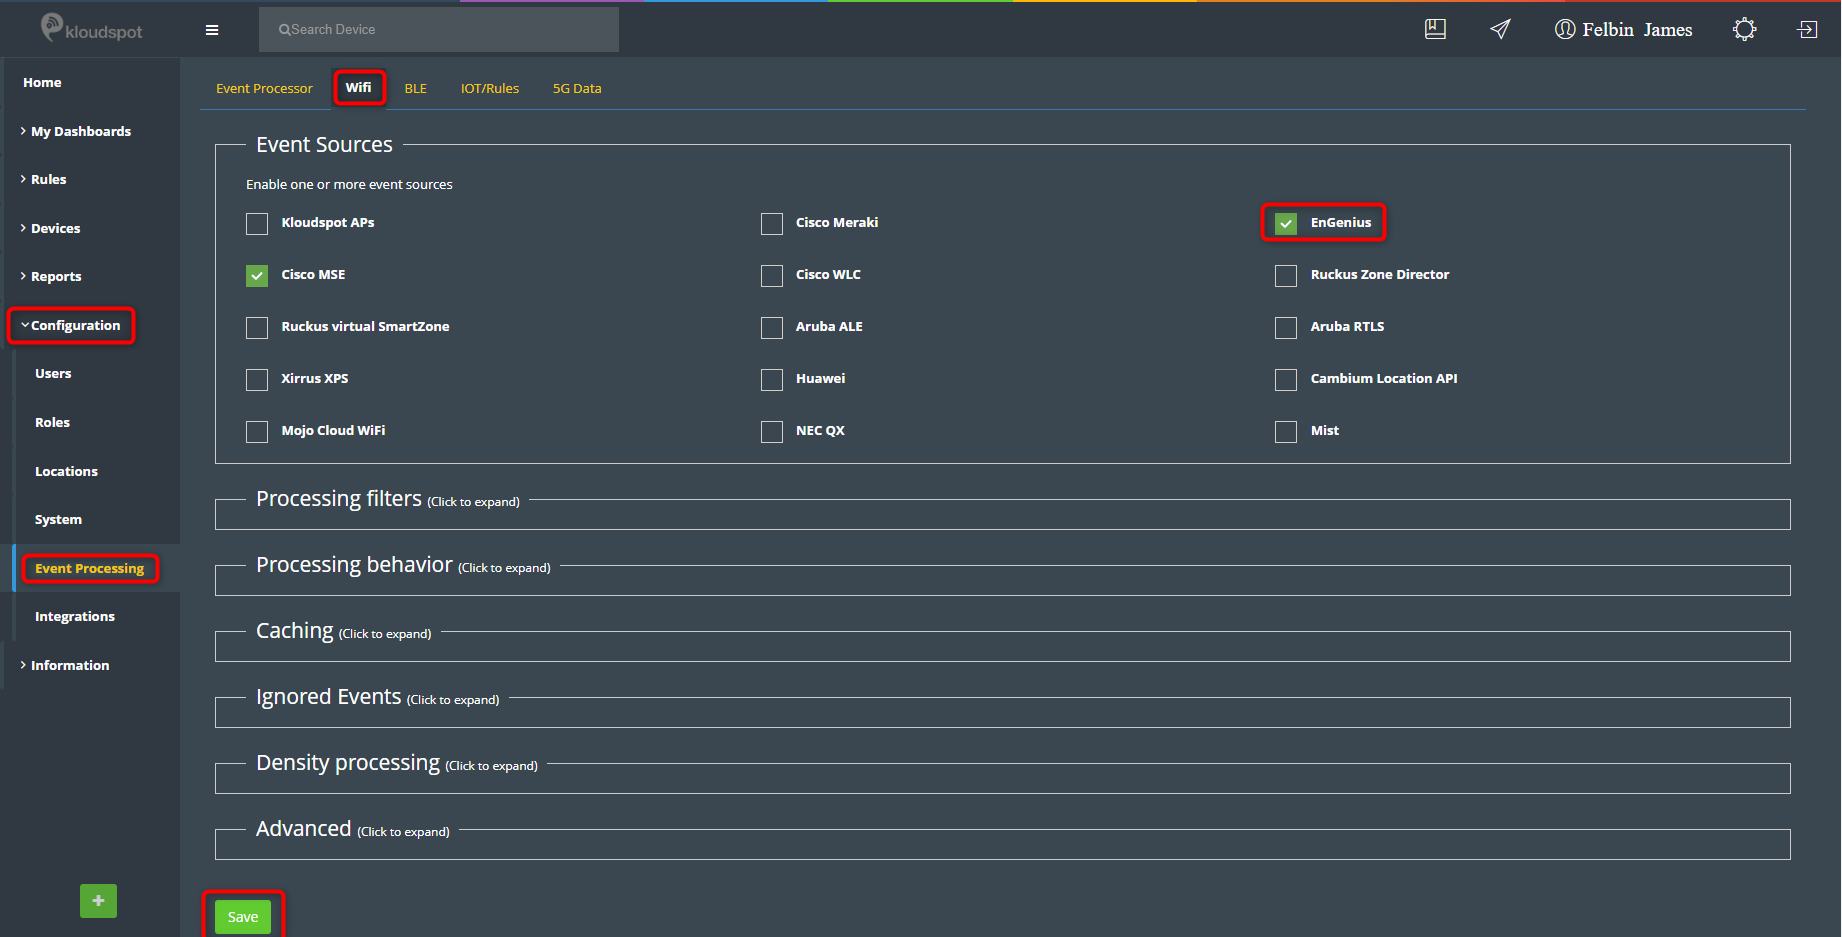
Step 3: Enable Engenius in KloudInsights
Data analysis is only possible if EnGenius data processing is enabled. To do so, follow the steps below.
Navigate to Configuration > Event Processing > Wi-Fi tab.
Enable EnGenius under Event sources and click the Save button.
Once enabled, you can use the information received from the Access point to create a variety of widgets.
Note: Check the Insights Admin guide for more information about widgets.
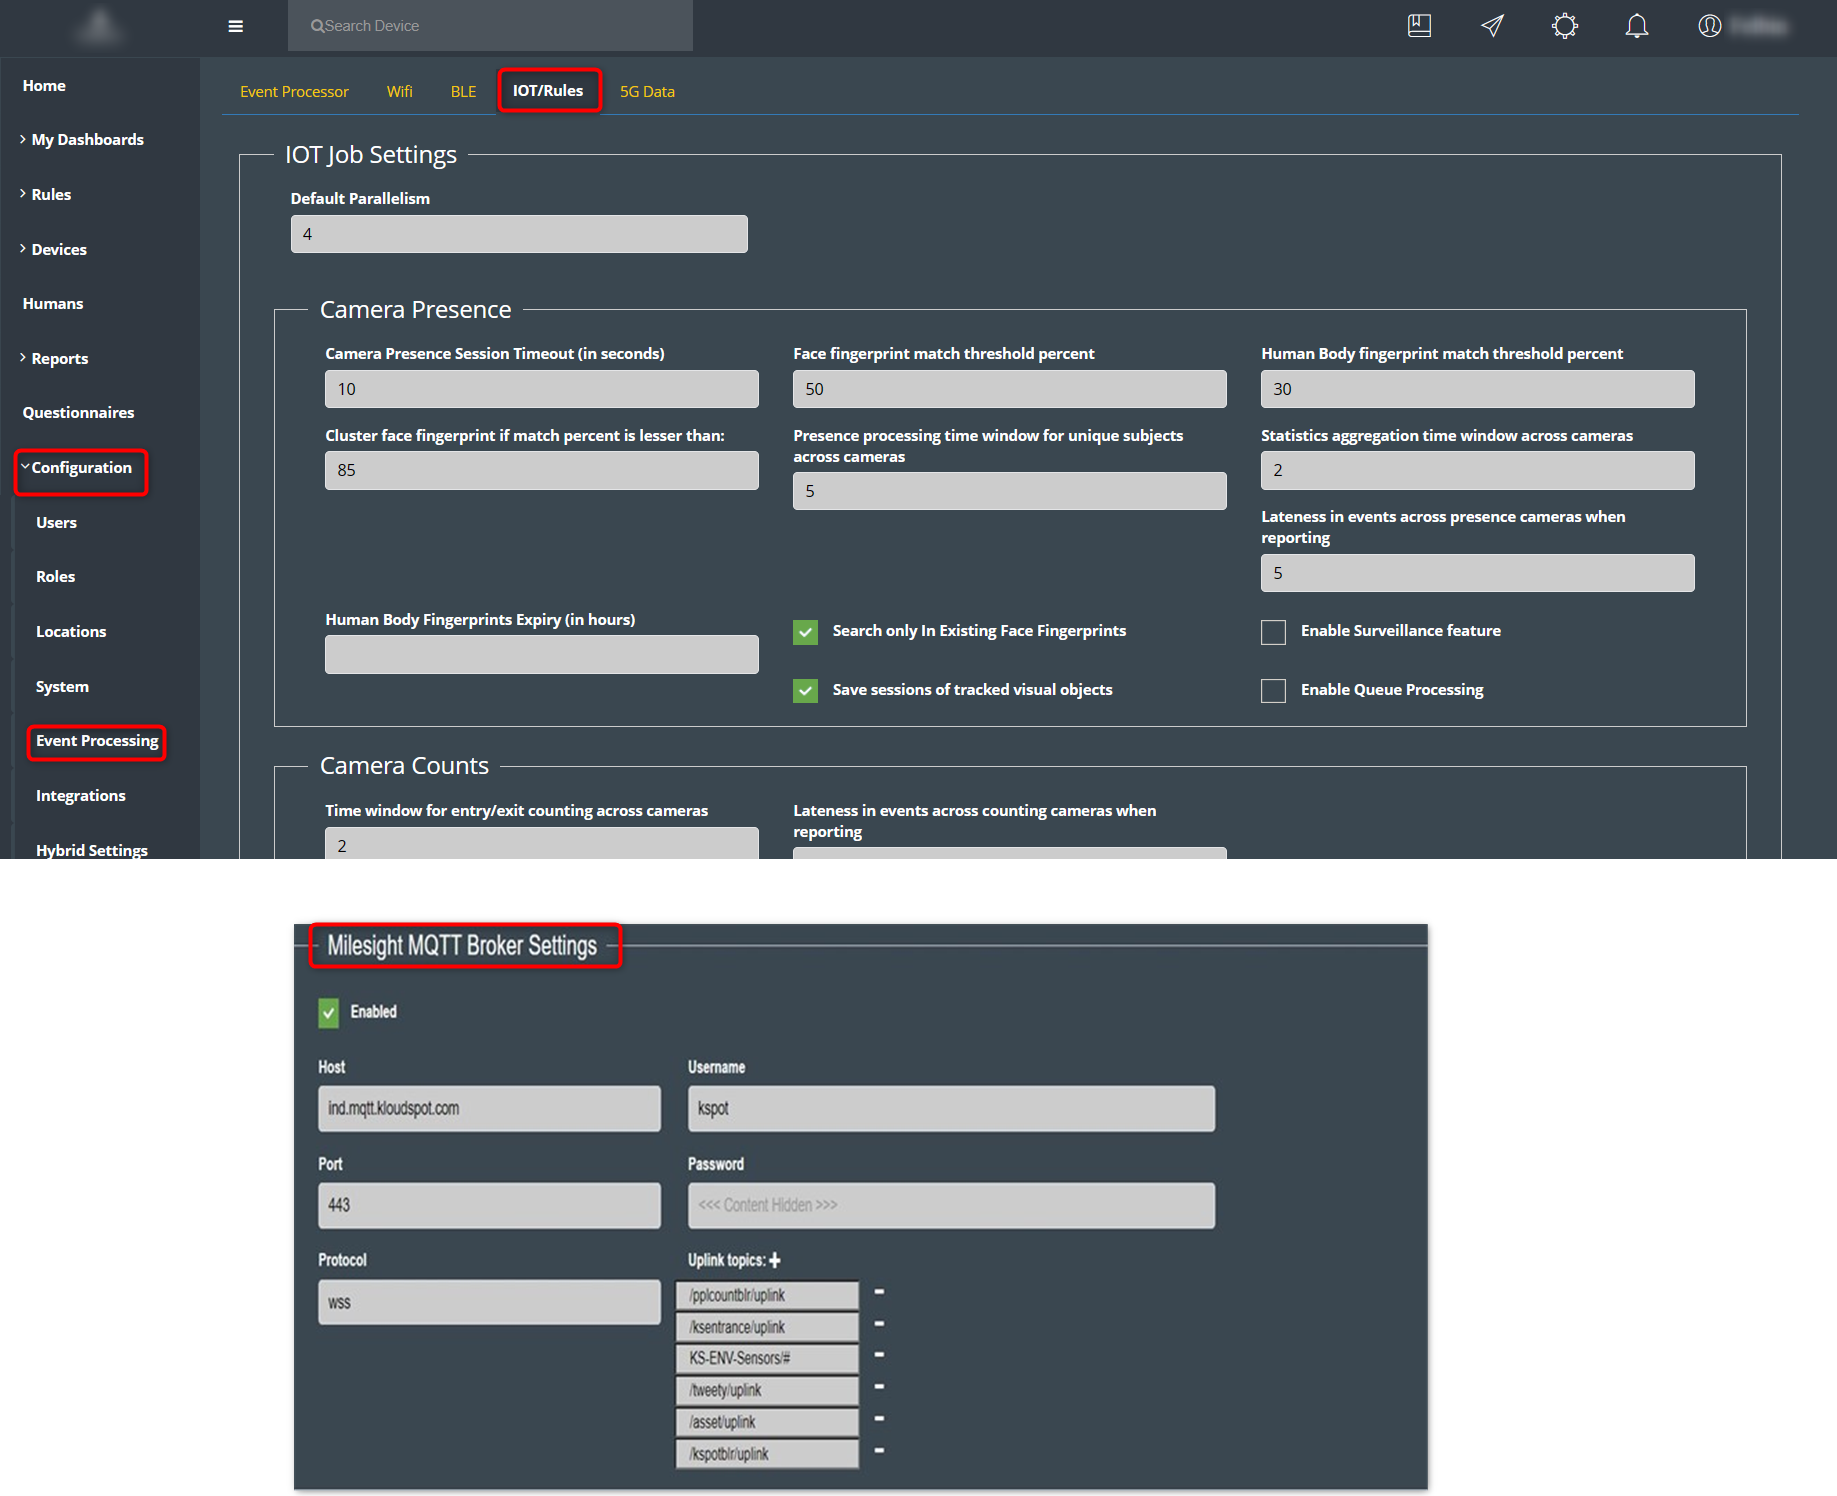
Milesight MQTT Broker Settings
This document provides a detailed guide on configuring Milesight MQTT Broker settings for IoT event processing. The setup involves defining crucial parameters such as the MQTT host, port, username, password, and protocol, as well as specifying uplink topics for sensor data transmission.
Overview
In this configuration, sensors transmit data in the form of payloads on specific topics. These topics are identified and set up in the Milesight platform. Subsequently, they are integrated into the user interface for data visualization.
To learn more about Milesight MQTT, click on the links provided in the References section.
Accessing MQTT Broker Settings
Navigate to the Configuration > Event Processing > Iot/Rules > Milesight MQTT Broker Settings.
Then scroll down and find the section called Milesight MQTT Broker Settings. Add the following parameters to it.
Configure Parameters
Host: Enter the MQTT Host Name provided by your MQTT broker service.
Port: Specify the MQTT Port Number.
Username: Provide the MQTT Username associated with your account.
Protocol: Enter the protocol used for MQTT communication.
Password: Input the MQTT Password corresponding to the provided username.
Uplink Topics: In this section, define the uplink topics through which the sensor transmits data to MQTT. These topics play a crucial role in the data transmission process.
Kloudspot currently supports various Milesight sensors, which capture data across diverse environments and use cases. Below is a list of the supported sensors along with their models.
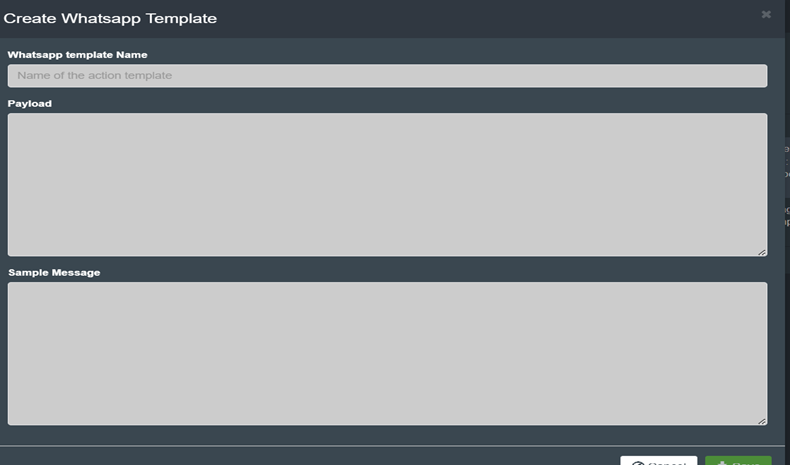
Enter template name and sample message in the window that opens and save the template.
Note: Provide the exact name that has been approved by Meta and enter the payload information.
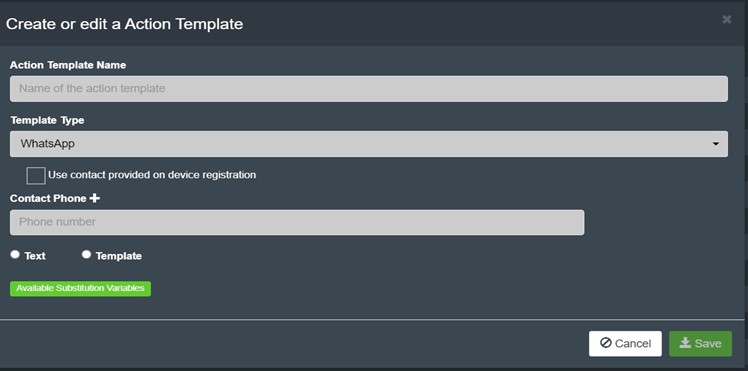
Setting up Action Templates
Refer to the Action Templates section to learn how to add an action template.
Choose “WhatsApp” as the template type. Additionally, tick the template checkbox and select the WhatsApp template you previously generated.
If you wish to send a personalized message, select the “Text” checkbox.
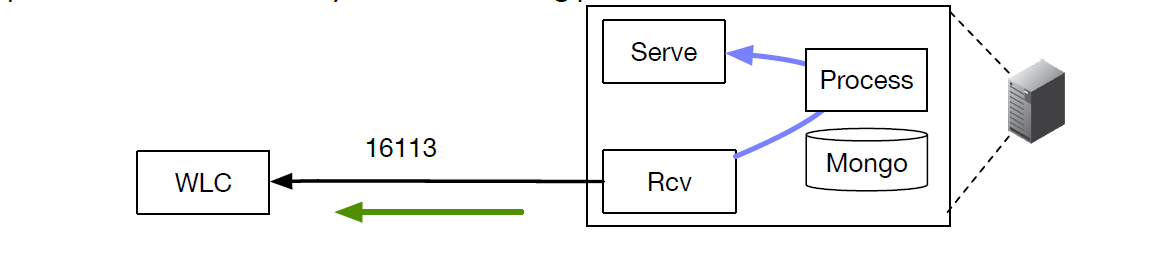
Options for Cisco WLC Connections
The Kloudspot Analytics platform can be configured to request and receive
client session data from Cisco Wireless Lan Controllers (WLC).
In order to do this, the platform needs to be able to connect to the WLC on
port 16113. This is easy to achieve in an on-premises installation where the
WLC and the Kloudspot Analytics platform are on the same network. The data
receiver (‘Rcv’) in the Kloudspot Analytics platform connects directly to the
WLC using port 16113 to subscribe for a data feed.
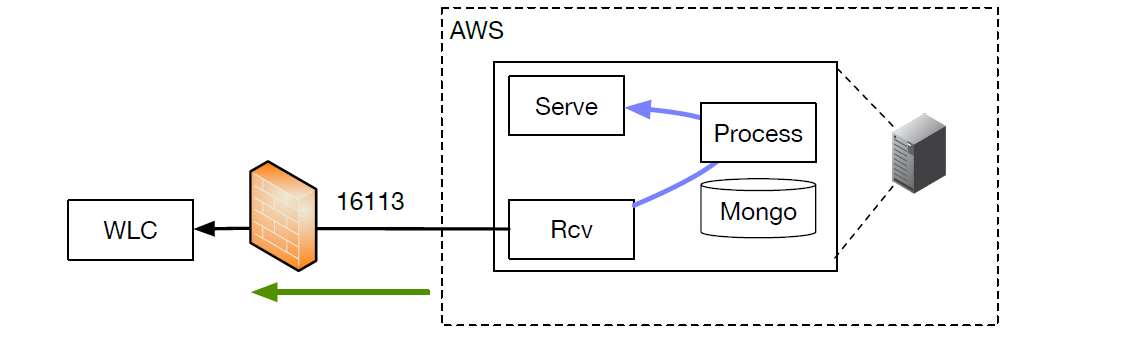
However, it can be difficult to set up this configuration when using Amazon
Web Services or another cloud provider for the following reasons:
It can be difficult to persuade network administration to implement the necessary firewall rules:
It opens an attack surface whereby a 3rd party might potentially be able to disable the WLC with a Denial Of Service attack. Often this clashes with companies cyber security rules.
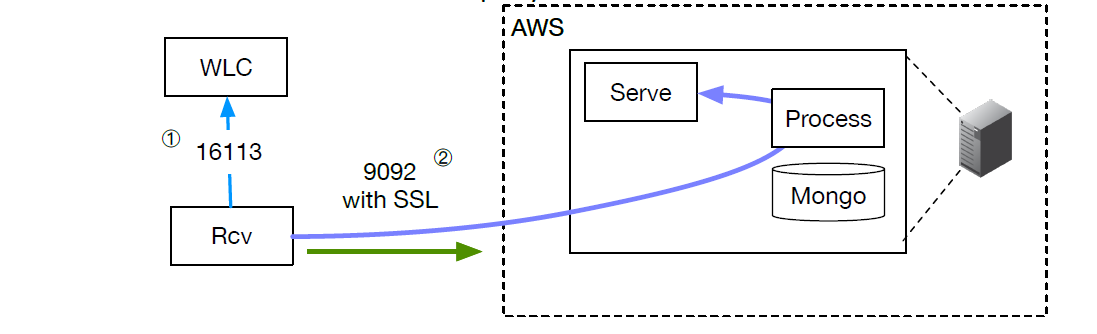
For this reason, it is possible to reconfigure the Kloudspot Analytics
platform so that the data receiver (‘Rcv’) is positioned on-premises in a
small VM and acts as a ‘proxy’ with all connections outbound from the company
to AWS:
In this configuration, the receiver, inside the customer’s DMZ or data center
connects to the WLC on port 16113 and then sends the received data to AWS on
port 9092 using an TLS secured connection.
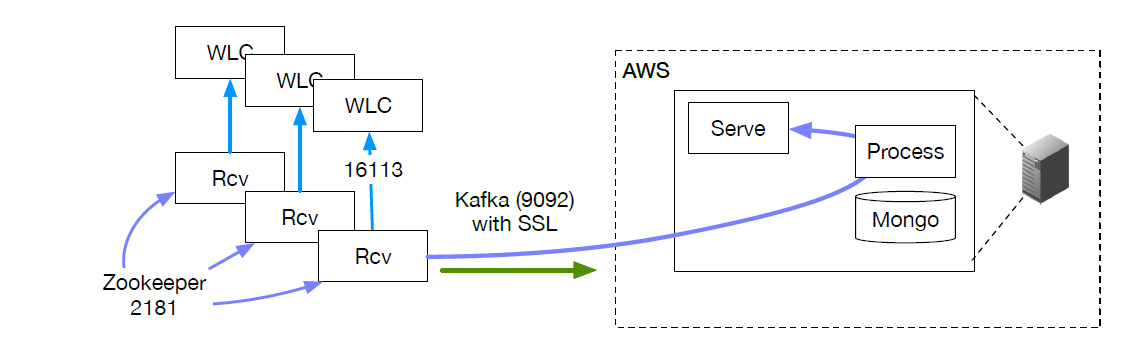
High Availability/Scalability
For scalability and high availability, the receiver can be configured in a N+1
configuration whereby the load can be shared across multiple receiver
instances, with the ability to rebalance the workload on failure.
In order to use this functionality an Apache Zookeeper cluster needs to be
setup. This is then used to elect a ‘leader’ of the available Receiver
instances. The leader shares out the work to the group of available receivers.
If the leader fails, a new leader is elected. If any member of the group
fails, the leader will rebalance the work across the remaining members.
An existing zookeeper cluster can be used or the same VMs used for the
receivers can also be used to provide the zookeeper functionality.
To set up a zookeeper cluster at least three VM instances on physically
separate hardware are required. So, if the same VMs are used as receivers,
this is the minimum configuration.
Receiver VM System Requirements
Each VM instance has the following hardware requirements:
The Kloudspot Analytics Engine can receive events from many types of WiFi
network.
One or more of event sources can be configured in the Configuration - >Event Processing- >Wi-Fi screen.
Validate the Receiver URLs
The protocol (HTTP/HTTPS) used varies depending on the source. We support both
HTTP and HTTPS protocols using port 48082 and 48083. Refer to the specific
data source below to determine the correct one to use.
If you have set a SSL certificate for the UI, that will be used instead of the
self signed one.
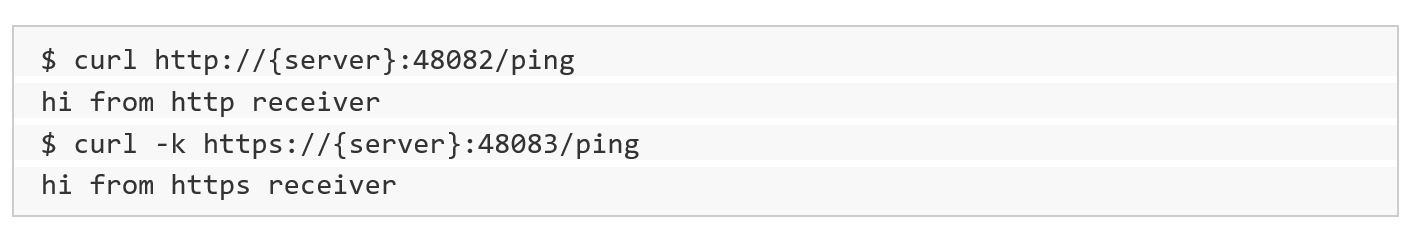
You can check access to both the HTTP and HTTPS urls with a ‘ping’:
$ curl http://{server}:48082/ping
hi from http receiver
$ curl -k https://{server}:48083/ping
hi from https receiver
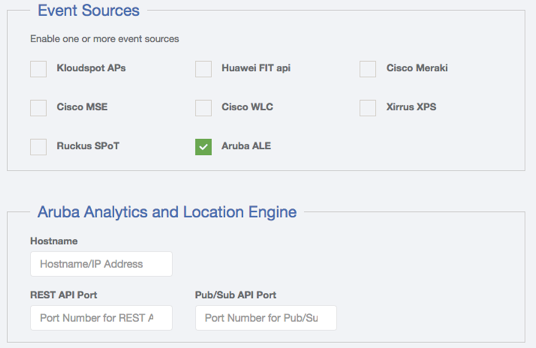
Aruba ALE
Refer to the ‘Analytics and Location Engine 2.0 - User Guide’. This will give
the necessary information to set up the connection and/or the Websocket
tunnel. Here are the Aruba
docs.
Three parameters need to be entered into the Kloudspot Analytics configuration
screen:
Hostname: of the ALE Websocket Proxy
REST API Port: Typically 8700
Pub/Sub API Port: The port used for the ZMQ connection. This is the port mapped to port 7779 on the ALE (typically 12000).
In summary:
The Analytics Engine can either access the ALE Engine directly or make use of the supplied Websocket Tunnel. In either case enter the required port details into the configuration screen and click save.
The ALE Engine should be configured to not anonymize Mac addresses.
At present only presence (Context Mode) is support for this source.
The Aruba websocket endpont can be set up anywhere, which can help with
firewall issues. Depending on the circumstances, the endpoint could be
installed on the Kloudspot Analytics server itself (with a localhost
connection).
Check Event Reception
Login to the Analytics Engine via SSH and run the kafka-listen command:
You will be able to see the ‘raw’ event feed going into the stream processing.
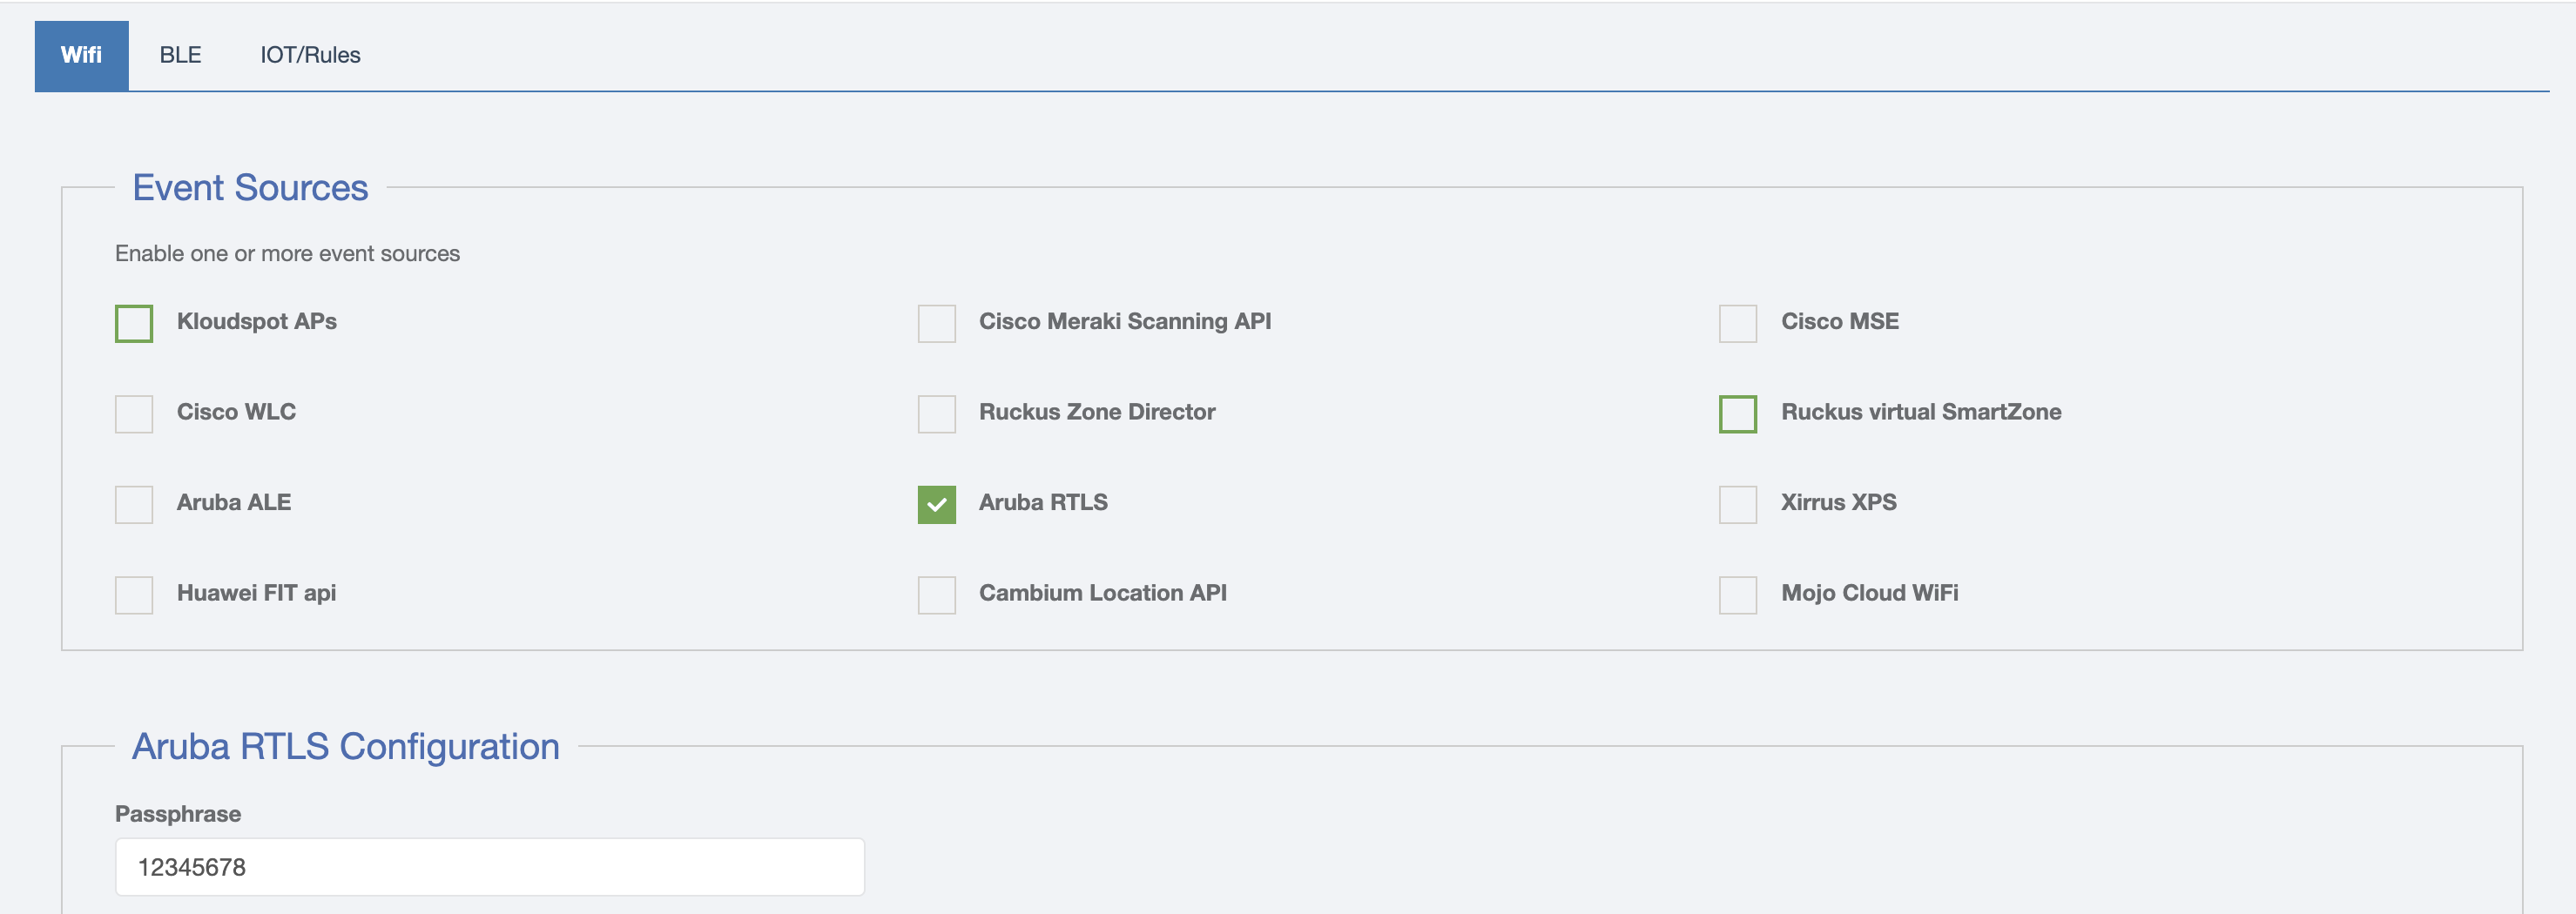
Aruba RTLS
Overview
The Kloudspot Analytics Engine can receive events from many types of WiFi
network.
One or more of event sources can be configured in the ‘Configuration - >Event Processing - > Wi-Fi’ screen.
Validate the Receiver URLs
The protocol (HTTP/HTTPS) used varies depending on the source. We support both
HTTP and HTTPS protocols using port 48082 and 48083. Refer to the specific
data source below to determine the correct one to use.
If you have set a SSL certificate for the UI, that will be used instead of the
self signed one.
You can check access to both the HTTP and HTTPS urls with a ‘ping’:
$ curl http://{server}:48082/ping
hi from http receiver
$ curl -k https://{server}:48083/ping
hi from https receiver
Aruba RTLS Feed
In addition to a feed from the Aruba Location Engine, we can also take a feed
direct from the APs. This can be set up either on individual APs or for groups
of APs via Airwave or Aruba Central.
In order for this work, the APs must be able to access port 3333 on the
Kloudspot server using the UDP protocol. Depending on firewall requirements,
it should be possible to use a [standalone proxy data
receiver](https://documentation.kloudspot.com/help/standalone-receiver-setup-
for-cisco-wlc “Standalone Receiver Setup for Cisco WLC”).
The setup is similar regardless of the approach:
Enable the event type in the KloudInsights configuration screen and set a passphrase to use:
In the Aruba dashboard, enable the RTLS feed in the Services menu for the AP or Group, using the passphrase you created above and port 3333
See these references in the Aruba documentation for information:
You will be able to see the ‘raw’ event feed going into the stream processing.
Related Articles
[template(“related”)]
Cambium
Overview
The Kloudspot Analytics Engine can receive events from many types of WiFi
network.
One or more of event sources can be configured in the ‘Configuration - >Event Processing - > Wi-Fi’ screen.
Validate the Receiver URLs
The protocol (HTTP/HTTPS) used varies depending on the source. We support both
HTTP and HTTPS protocols using port 48082 and 48083. Refer to the specific
data source below to determine the correct one to use.
If you have set a SSL certificate for the UI, that will be used instead of the
self signed one.
You can check access to both the HTTP and HTTPS urls with a ‘ping’:
$ curl http://{server}:48082/ping
hi from http receiver
$ curl -k https://{server}:48083/ping
hi from https receiver
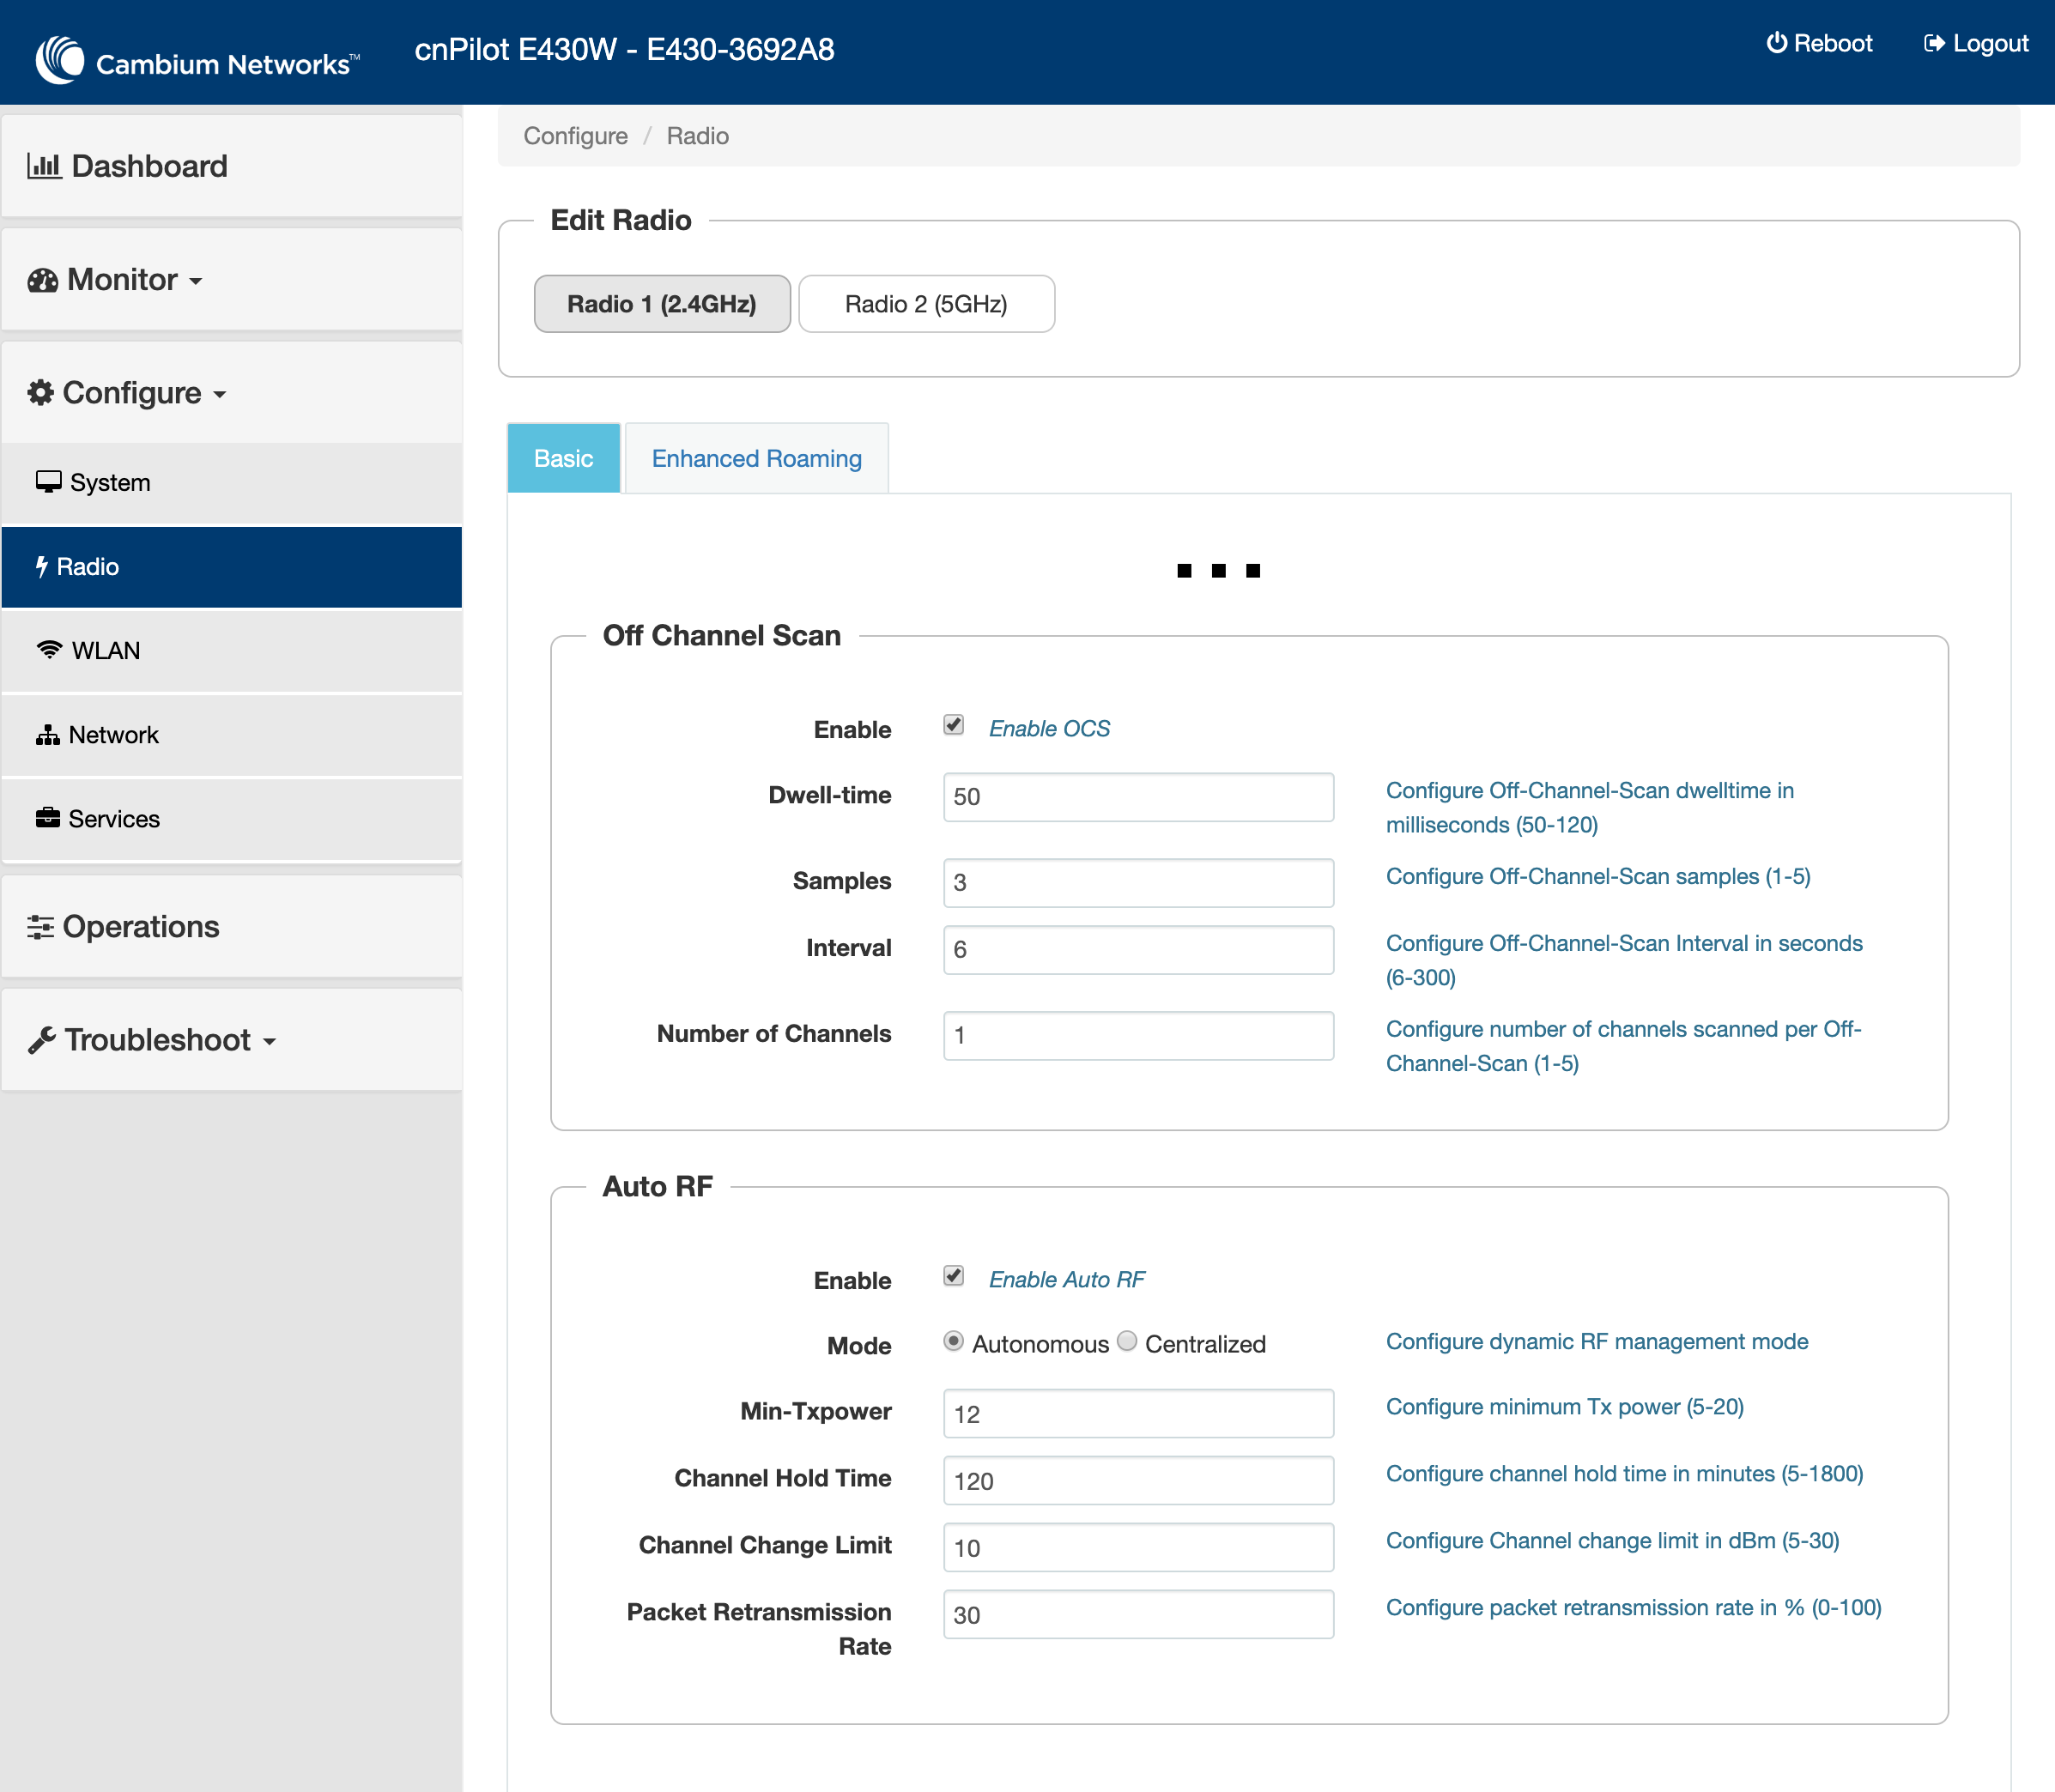
Cambium cnPilot
Kloudspot Analytics support the WiFi Location API provided by Cambium cnPilot
Enterprise APs. The API can be setup either on standalone APs or via the
cnMeastro Wireless Controller/Network Manager.
In either case the setup is the same:
Go to the Radio options and enable Off Channel scan and Auto RF and save.
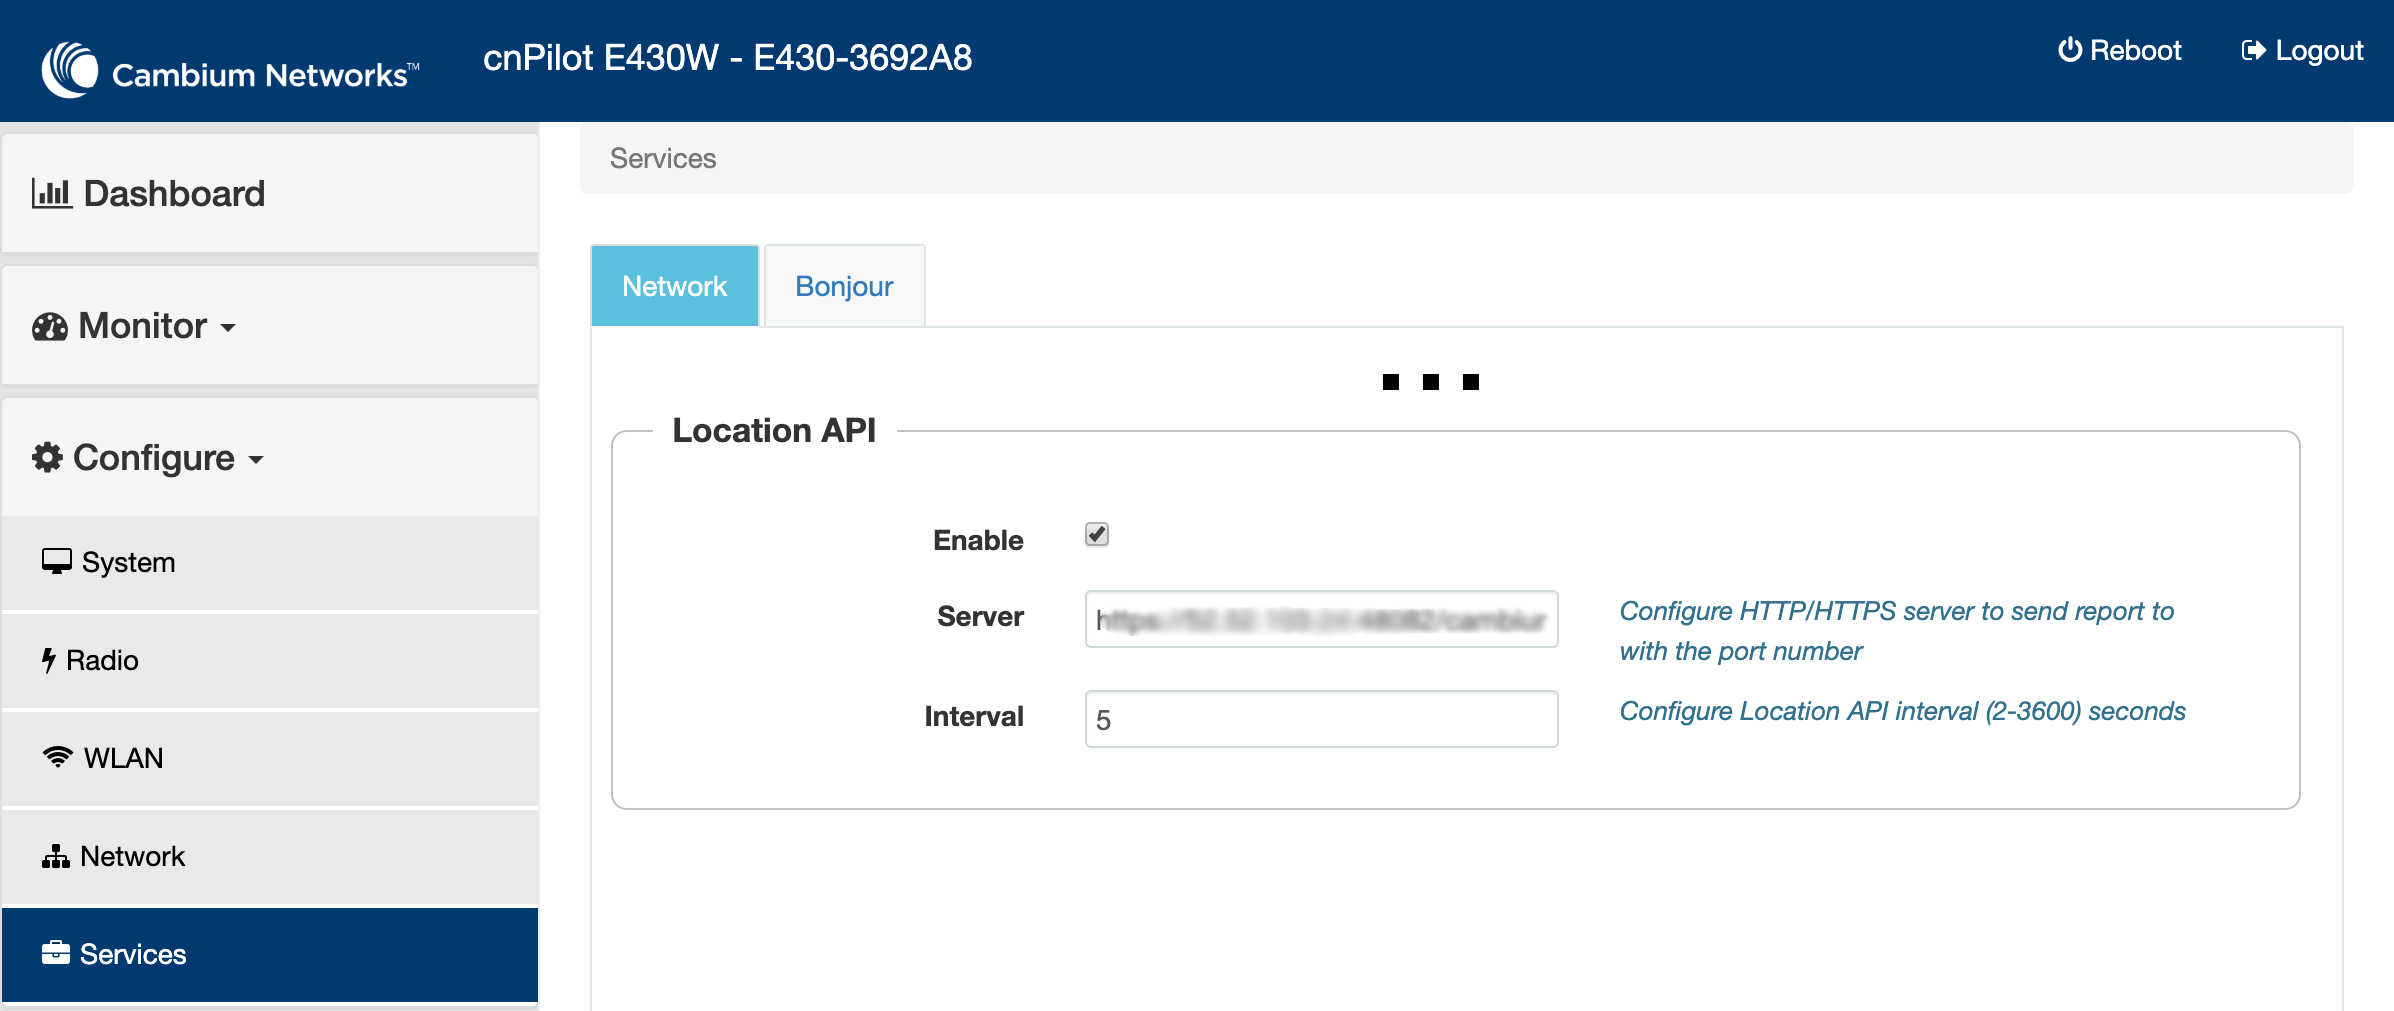
Then to the Services options and enable the Location API and save.
The default Server URL will be: https://<server>:48083/cambium. The Interval
should be ~30 seconds.
Go the the event sources screen in the Kloudspot Analytics Engine, enable the ‘Cambium Location API’ source and then restart the Stream Processing job.
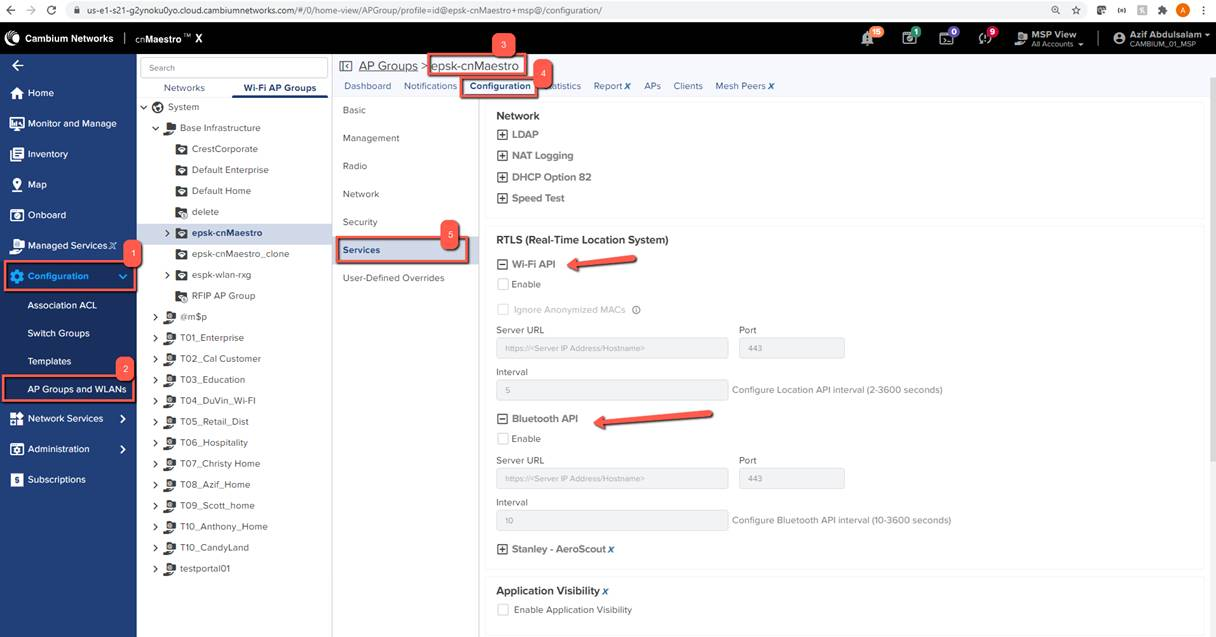
Cambium cnMaestro
For cnMaestro, the steps to be taken are the same as with cnPilot, however to
navigate to the radio & service settings please follow the steps in the below
screenshot:
If BLE is also being scanned for, make sure to enable the Bluetooth API on the
services page, and enter in the same information entered for WiFi.
Check Event Reception
Login to the Analytics Engine via SSH and run the kafka-listen command:
You will be able to see the ‘raw’ event feed going into the stream processing.
Related Articles
[template(“related”)]
Cisco CMX
Overview
The Kloudspot Analytics Engine can receive events from many types of WiFi
network.
One or more of event sources can be configured in the ‘Configuration - >
**Event Processing - > Wi-Fi’**screen.
Validate the Receiver URLs
The protocol (HTTP/HTTPS) used varies depending on the source. We support both
HTTP and HTTPS protocols using port 48082 and 48083. Refer to the specific
data source below to determine the correct one to use.
If you have set a SSL certificate for the UI, that will be used instead of the
self signed one.
You can check access to both the HTTP and HTTPS urls with a ‘ping’:
$ curl http://{server}:48082/ping
hi from http receiver
$ curl -k https://{server}:48083/ping
hi from https receiver
Cisco CMX/MSE
The Kloudspot Location Engine supports Notifications from the Cisco CMX v10.X
operating in ‘presence’ mode.
On Kloudspot Location Engine, select the ‘Cisco MSE’ Event source and click
‘save’.
Then login to Cisco CMX and configure the following notification types:
You will be able to see the ‘raw’ event feed going into the stream processing.
Cisco Meraki
Overview
The Kloudspot Analytics Engine can receive events from many types of WiFi
network.
One or more of event sources can be configured in the ‘Configuration - >Event Processing - > Wi-Fi’ screen.
Validate the Receiver URLs
The protocol (HTTP/HTTPS) used varies depending on the source. We support both
HTTP and HTTPS protocols using port 48082 and 48083. Refer to the specific
data source below to determine the correct one to use.
If you have set a SSL certificate for the UI, that will be used instead of the
self signed one.
You can check access to both the HTTP and HTTPS urls with a ‘ping’:
$ curl http://{server}:48082/ping
hi from http receiver
$ curl -k https://{server}:48083/ping
hi from https receiver
Meraki MV Sense
Follow the instructions provided on the link to configure MQTT broker in the
Meraki Dashboard:
You will be able to see the ‘raw’ event feed going into the stream processing.
Cisco WLC
Overview
The Kloudspot Analytics Engine can receive events from many types of WiFi
network.
One or more of event sources can be configured in the ‘Configuration - >Event Processing - > Wi-Fi’ screen.
Validate the Receiver URLs
The protocol (HTTP/HTTPS) used varies depending on the source. We support both
HTTP and HTTPS protocols using port 48082 and 48083. Refer to the specific
data source below to determine the correct one to use.
If you have set a SSL certificate for the UI, that will be used instead of the
self signed one.
You can check access to both the HTTP and HTTPS urls with a ‘ping’:
$ curl http://{server}:48082/ping
hi from http receiver
$ curl -k https://{server}:48083/ping
hi from https receiver
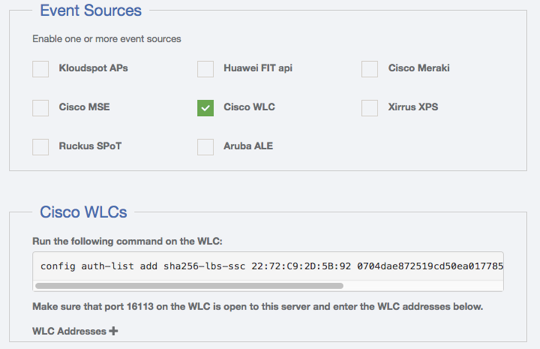
Cisco Wireless Lan Controller
To configure a Cisco Wireless WAN Controller to send events, follow the
following steps.
Ensure that the Kloudspot Analytics Engine can access port 16113 on the WLC.
Enable the Cisco WLC Event source in the Kloudspot Analytics Engine.
Copy the command from the Kloudspot UI and run on the WLC. This will allow the Analytics Engine to connect and subscribe for events.
Add the IP address for WLC to the list of WLC Addresses in the Analytics Engine UI and click ‘Save’.
Check Event Reception
Login to the Analytics Engine via SSH and run the kafka-listen command:
You will be able to see the ‘raw’ event feed going into the stream processing.
Huawei
Overview
The Kloudspot Analytics Engine can receive events from many types of WiFi
network.
One or more of event sources can be configured in the **‘Configuration - >
****Event Processing** **- > ****Wi-Fi** ’ screen.
Validate the Receiver URLs
The protocol (HTTP/HTTPS) used varies depending on the source. We support both
HTTP and HTTPS protocols using port 48082 and 48083. Refer to the specific
data source below to determine the correct one to use.
If you have set a SSL certificate for the UI, that will be used instead of the
self signed one.
You can check access to both the HTTP and HTTPS urls with a ‘ping’:
$ curl http://{abc}-rcv.apps.kloudspot.com/{xyz}
hi from http receiver
$ curl -k https://{abc}-rcv.apps.kloudspot.com/{xyz}
hi from https receiver
Use port 443
{abc} = customer vanity URL
{xyz} = type of receiver used
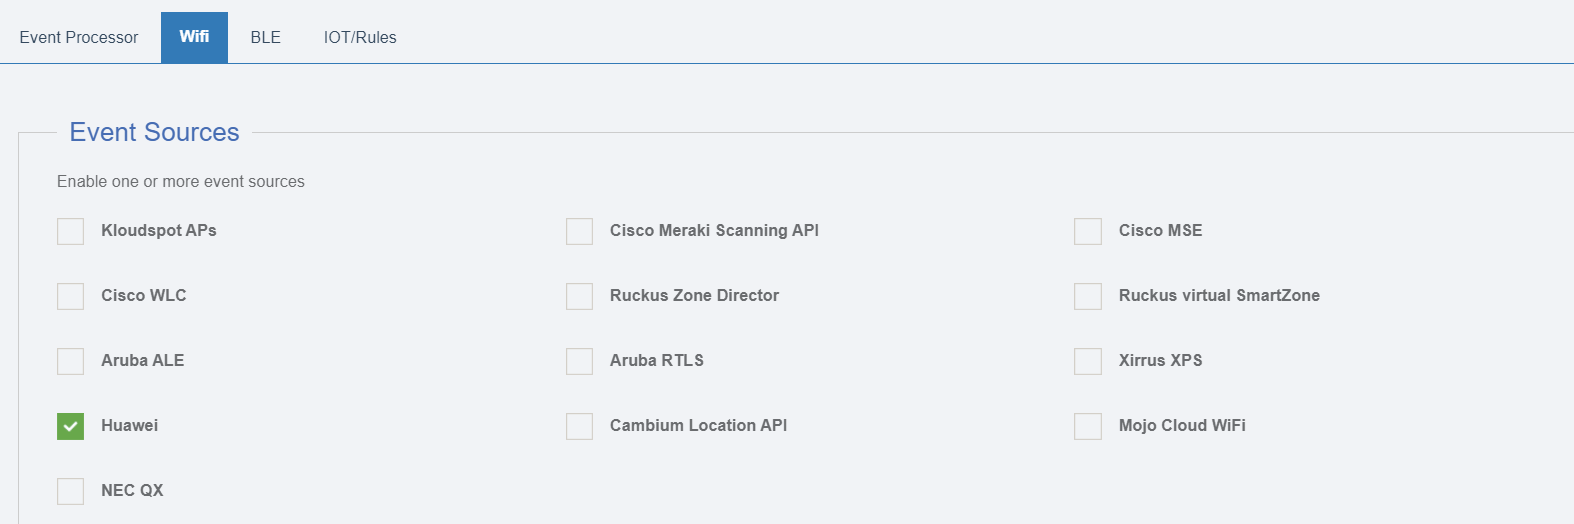
Huawei
To configure a Huawei AP, select ‘Huawei’ from the event sources available.
Enable location Services
To enable location services for Huawei APs please follow the steps below.
Open 7777/ UDP port for collecting Wi-Fi data
Open 7778/UDP port for collecting BLE data.
Accuracy: The accuracy provided for Huawei AP is approximately between 3-5
meters for WiFi and 1-3 meters for BLE.
You will be able to see the ‘raw’ event feed going into the stream processing.
Kloudspot Event Receiver
Overview
The Kloudspot Analytics Engine can receive events from many types of WiFi
network.
One or more of event sources can be configured in the **‘Configuration - >
****Event Processing** **- > ****Wi-Fi** ’ screen.
Validate the Receiver URLs
The protocol (HTTP/HTTPS) used varies depending on the source. We support both
HTTP and HTTPS protocols using port 48082 and 48083. Refer to the specific
data source below to determine the correct one to use.
If you have set a SSL certificate for the UI, that will be used instead of the
self signed one.
You can check access to both the HTTP and HTTPS urls with a ‘ping’:
$ curl http://{server}:48082/ping
hi from http receiver
$ curl -k https://{server}:48083/ping
hi from https receiver
Kloudspot
The following steps are needed to configure Kloudspot APs to send events:
Login to Kloudspot AP Management and edit the account configuration. Set the Platform Probe URL to point to the Analytics Engine HTTPS port (48083).
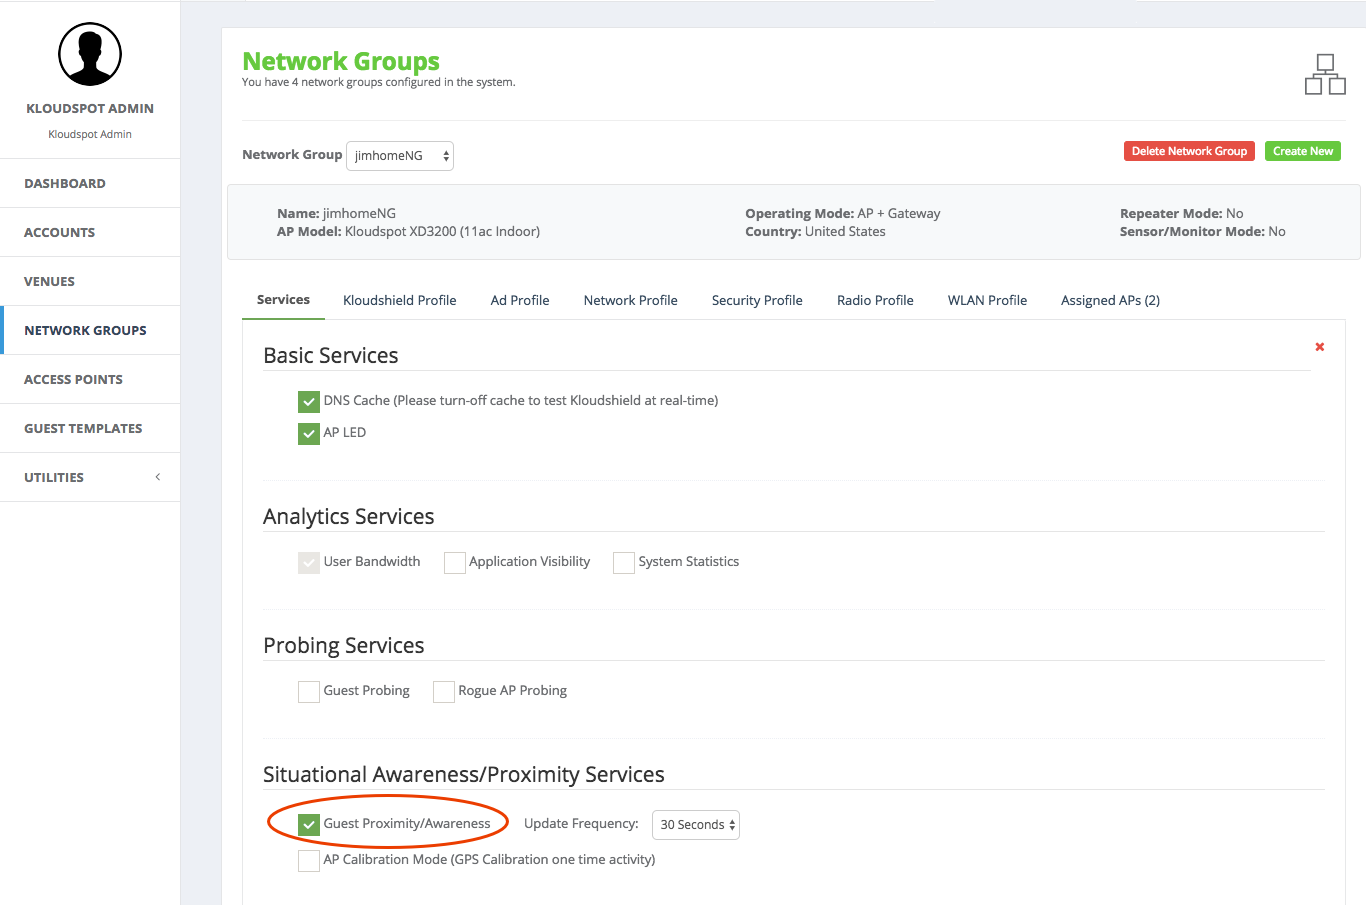
Then edit the appropriate network groups to enable ‘Guest Proximity/Awareness’
Finally, select ‘Kloudspot APs’ in the Event sources in the Analytics Engine and click ‘Save’
Check Event Reception
Login to the Analytics Engine via SSH and run the kafka-listen command:
You will be able to see the ‘raw’ event feed going into the stream processing.
NEC QX
Overview
The Kloudspot Analytics Engine can receive events from many types of WiFi
network.
One or more of event sources can be configured in the ‘Configuration - >Event Processing - > Wi-Fi’ screen.
Validate the Receiver URLs
The protocol (HTTP/HTTPS) used varies depending on the source. We support both
HTTP and HTTPS protocols using port 48082 and 48083. Refer to the specific
data source below to determine the correct one to use.
If you have set a SSL certificate for the UI, that will be used instead of the
self signed one.
You can check access to both the HTTP and HTTPS urls with a ‘ping’:
$ curl http://{server}:48082/ping
hi from http receiver
$ curl -k https://{server}:48083/ping
hi from https receiver
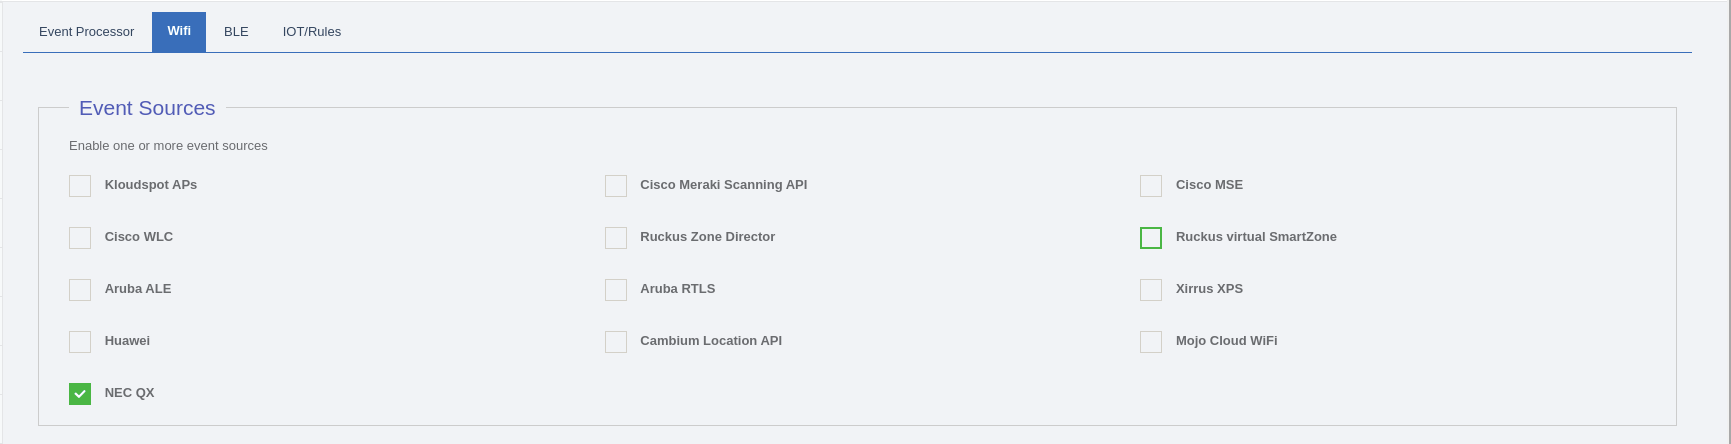
NEC QX
To configure a NEC QX AP, select ‘NEC QX’ from the event sources
available.
Enable location Services: To enable location services for NEC QX APs we need
to open 5555/UDP port.
Check Event Reception
Login to the Analytics Engine via SSH and run the kafka-listen command:
You will be able to see the ‘raw’ event feed going into the stream processing.
Ruckus virtual SmartZone
Overview
The Kloudspot Analytics Engine can receive events from many types of WiFi
network.
One or more of event sources can be configured in the ‘Configuration - >Event Processing - > Wi-Fi’ screen.
Validate the Receiver URLs
The protocol (HTTP/HTTPS) used varies depending on the source. We support both
HTTP and HTTPS protocols using port 48082 and 48083. Refer to the specific
data source below to determine the correct one to use.
If you have set a SSL certificate for the UI, that will be used instead of the
self signed one.
You can check access to both the HTTP and HTTPS urls with a ‘ping’:
$ curl http://{server}:48082/ping
hi from http receiver
$ curl -k https://{server}:48083/ping
hi from https receiver
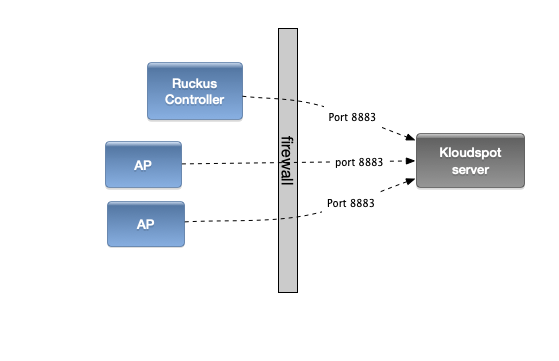
Ruckus virtual SmartZone
Port 8883 must be open from the Ruckus controller and APs to the Kloudspot
Analytics server. [See the Ruckus Zone Director instructions for
details](https://documentation.kloudspot.com/analytics/web-
ui/configuration/event-receivers#ruckus-zone-director).
Ruckus APs can send event data directly to the Kloudspot Analytics Engine. The
following steps set this up.
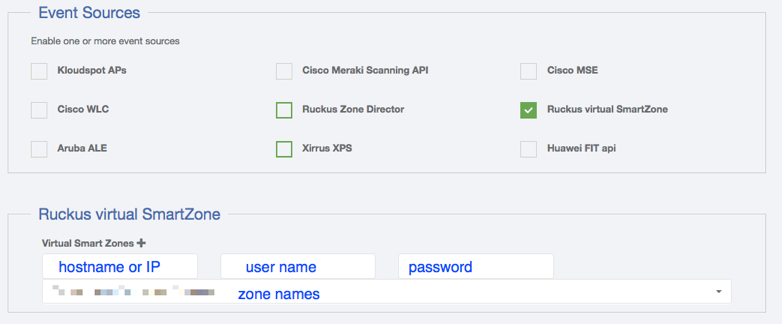
Go the the event sources screen in the Kloudspot Analytics Engine and enable the ‘Ruckus virtual SmartZone’ source.
Click the ‘+’ sign to add a virtual SmartZone contoller.
Enter the server address and credentials.
Once the server, username and password fields are valid, the Kloudspot Analytics Engine will contact the Ruckus server and download a list of zones. Select one or more zones from the dropdown.
Click ‘Save’
At this point, the Kloudspot Analytics engine will contact the Ruckus virtual
SmartZone controller and set up all the required Location Based Services
configuration.
Check Event Reception
Login to the Analytics Engine via SSH and run the kafka-listen command:
You will be able to see the ‘raw’ event feed going into the stream processing.
Ruckus Zone Director
Overview
The Kloudspot Analytics Engine can receive events from many types of WiFi
network.
One or more of event sources can be configured in the ‘Configuration - >Event Processing - > Wi-Fi’ screen.
Validate the Receiver URLs
The protocol (HTTP/HTTPS) used varies depending on the source. We support both
HTTP and HTTPS protocols using port 48082 and 48083. Refer to the specific
data source below to determine the correct one to use.
If you have set a SSL certificate for the UI, that will be used instead of the
self signed one.
You can check access to both the HTTP and HTTPS urls with a ‘ping’:
$ curl http://{server}:48082/ping
hi from http receiver
$ curl -k https://{server}:48083/ping
hi from https receiver
Ruckus Zone Director
The Ruckus APs use the MQTT protocol to
communicate with the Kloudspot Analytics server. For this to work Port 8883
must be open from the Ruckus controller and APs to the Kloudspot Analytics
server:
Ruckus APs can send event data directly to the Kloudspot Analytics Engine. The
following steps set this up.
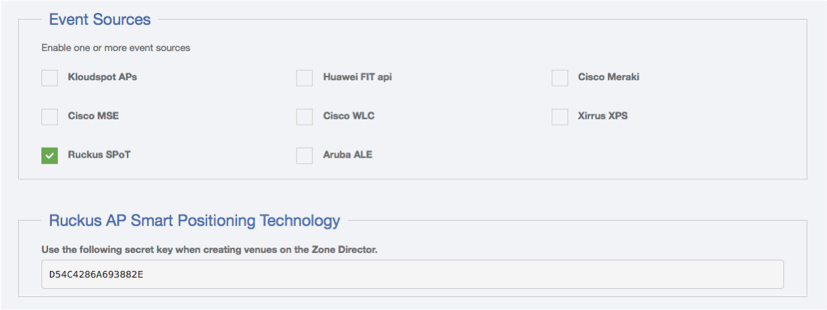
Go the the event sources screen in the Kloudspot Analytics Engine and enable the ‘Ruckus Zone Director’ source. Note the secret key and then restart the Stream Processing job.
Click ‘Save’
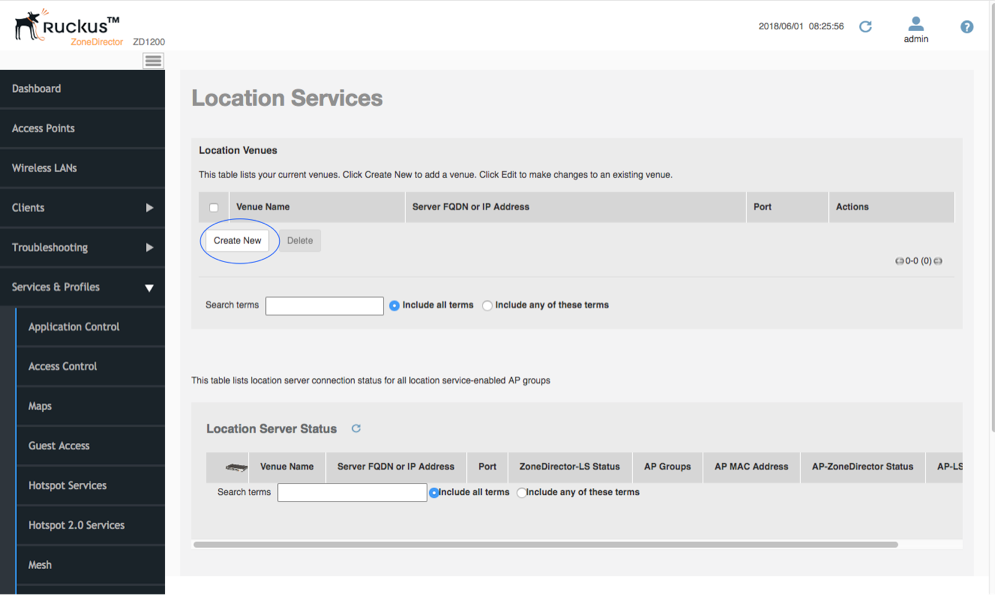
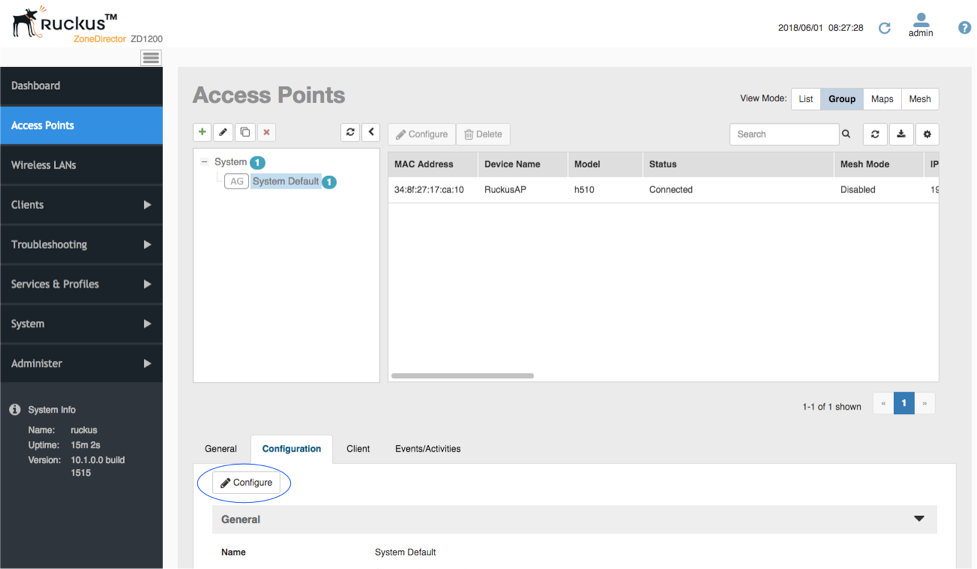
Go to the Ruckus Zone Director. Login and select the Services & Profiles -> Location Services menu entry.
Click ‘Create New’
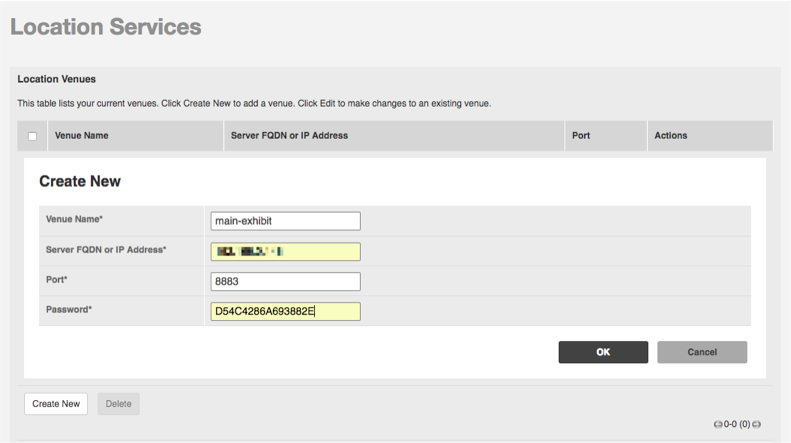
Enter the required information including the secret key from above and click OK.
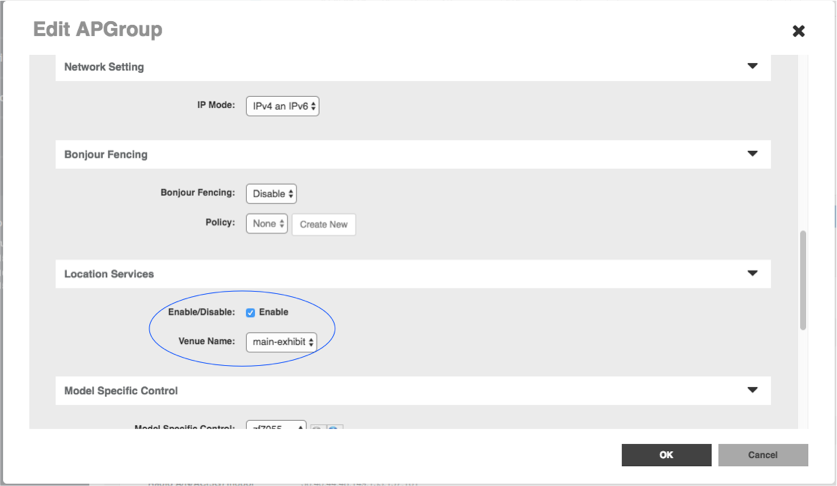
Then select the Access Points menu entry. Select the access point group for which you want to send events. Click configure.
Scroll down to Location Services and enable the venue we just set up. Click ‘OK’.
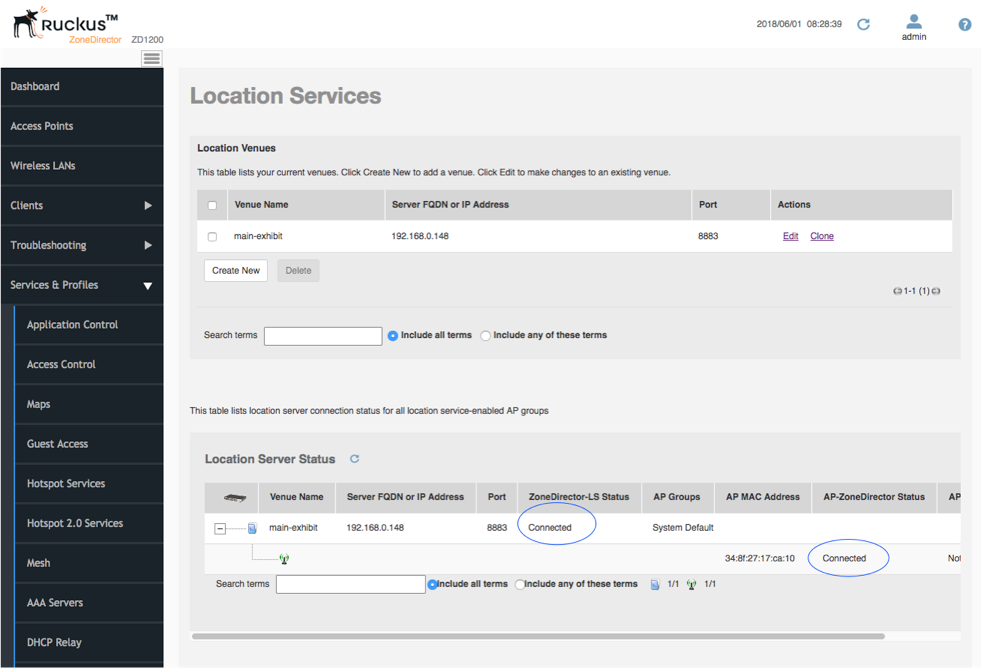
Finally select the Services & Profiles -> Location Services menu entry. You now see the director and the APs all showing connected status.
Check Event Reception
Login to the Analytics Engine via SSH and run the kafka-listen command:
You will be able to see the ‘raw’ event feed going into the stream processing.
Xirrus XPS
Overview
The Kloudspot Analytics Engine can receive events from many types of WiFi
network.
One or more of event sources can be configured in the ‘Configuration - >Event Processing - > Wi-Fi’ screen.
Validate the Receiver URLs
Most of the receivers below ‘push’ to a specific URL. The protocol
(HTTP/HTTPS) used varies depending on the source. We support both HTTP and
HTTPS protocols using port 48082 and 48083. Refer to the specific data source
below to determine the correct one to use.
If you have set a SSL certificate for the UI, that will be used instead of the
self signed one.
You can check access to both the HTTP and HTTPS urls with a ‘ping’:
$ curl http://{server}:48082/ping
hi from http receiver
$ curl -k https://{server}:48083/ping
hi from https receiver
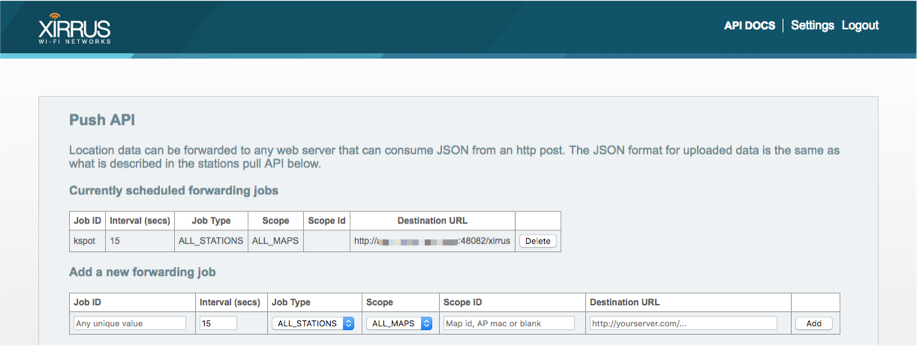
Xirrus XPS
The Kloudspot Analytics Engine can receive location update events from the
Xirrus Positioning System (XPS) as follows:
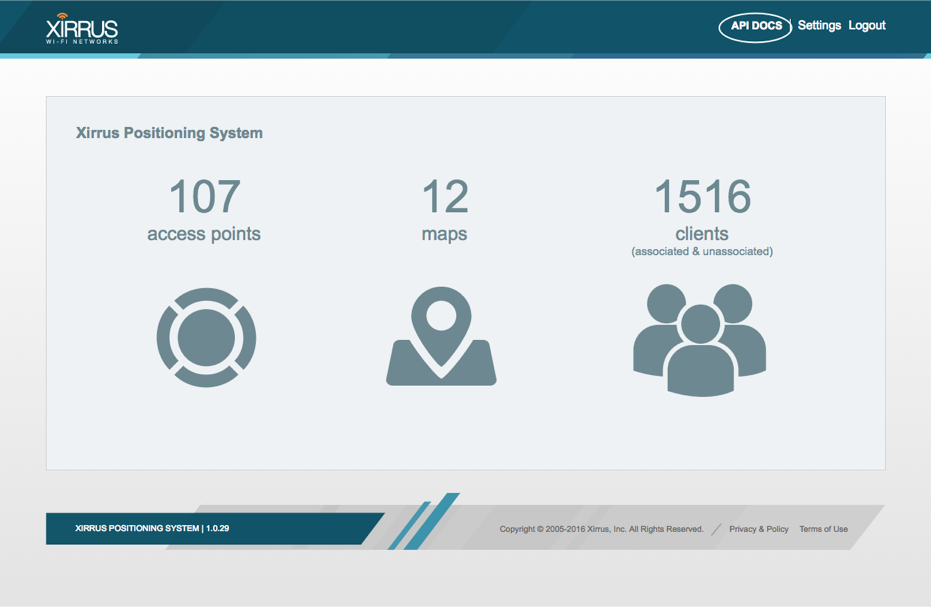
Enable the Xirrus Event source in the Kloudspot Analytics Engine.
Next login to XPS, click on API Docs
Then add a new forwarding job with the following URL:
http://{server}:48082/xirrus
You should immediately start receiving
events from the XPS.
The feed sent from the XPS doesn’t include information about APs. In order to
deal with this, some special configuration (including setting an External
Reference ID) is needed when setting up the location configuration in the
Analytics Engine. Please ask your Klouspot contact with help setting this up.
Check Event Reception
Login to the Analytics Engine via SSH and run the kafka-listen command:
You will be able to see the ‘raw’ event feed going into the stream processing.
User Roles and Permissions
After the integration part you can add users with different roles to KloudInsights, for that refer to the User & Permission Management section from the KloudHybrid Admin Guide.
Location Configuration
The next step is to add a location to KloudInsights, see the Create your office in Kloudhybrid section in the Kloudhybrid admin guide.
Action Templates
After completing the above steps, KloudInsights is ready to create rules, build dashboards, and create reports.
As part of creating a rule, an action template should be created to send it. Follow the next steps to know how.
If you have already created an Action template, learn to the Creating Rules section to learn how to create a rule.
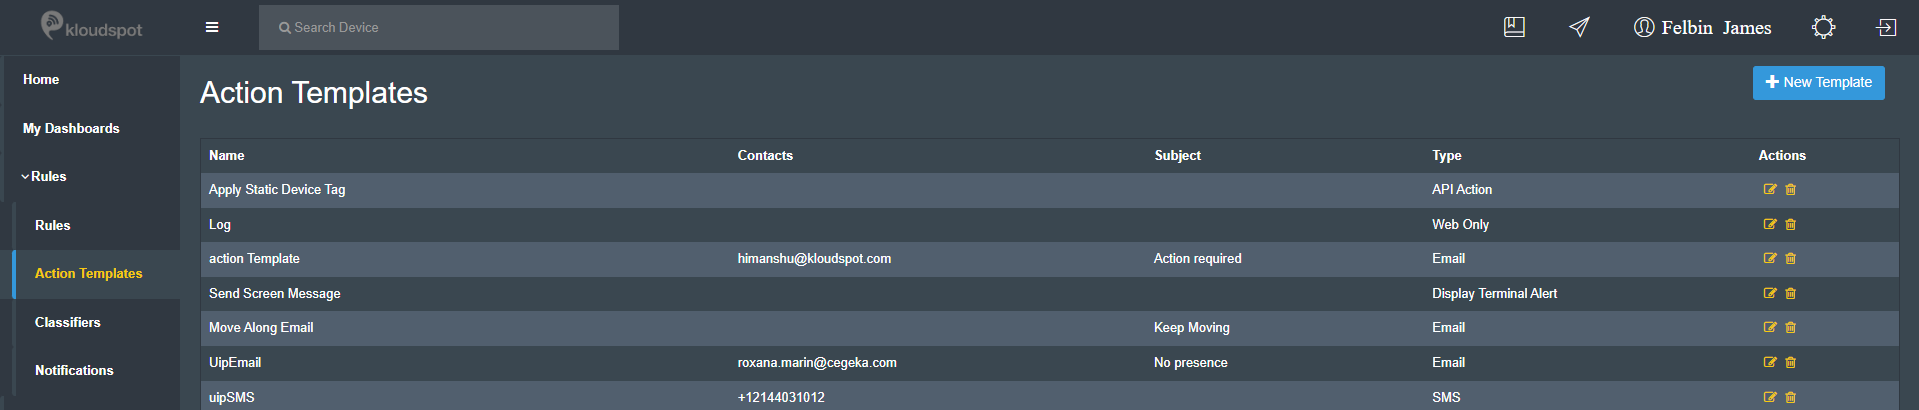
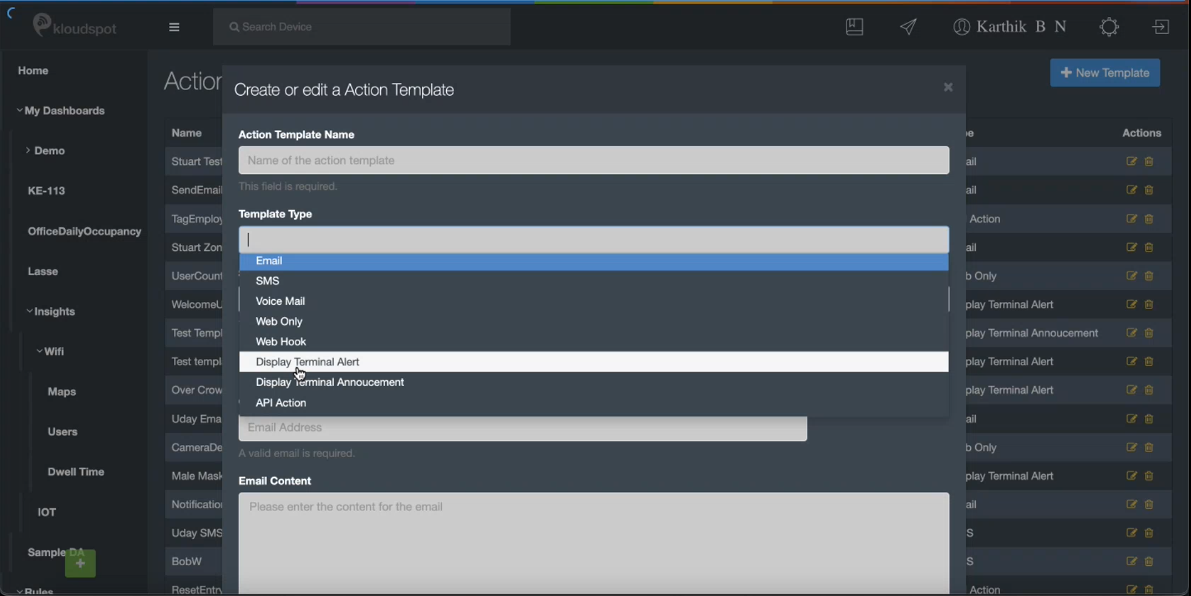
A rule must be associated with one or more actions. This screen lists all the
templates defined in the system. The following action types are currently
supported:
SMS: Send an SMS to a specified telephone number.
Email: Send an email to a list of email addresses.
Voice: Kloudspot is integrated with Plivo to allow text to voice translation.
Web Hook: This allows simple integration with other systems. For example, this can be used to send events to a Slack channel.
Display Terminal: Trigger a change to a KloudDisplay terminal.
API Action: Add/remove/replace tags.
WhatsApp:Enable notifications and message sending via Meta authentication.
Most of the formats support the use of templated messages where information
from the event can be used to construct the sent message. The template editing
page includes information on the available template variables, more
information on the template language is available
here.
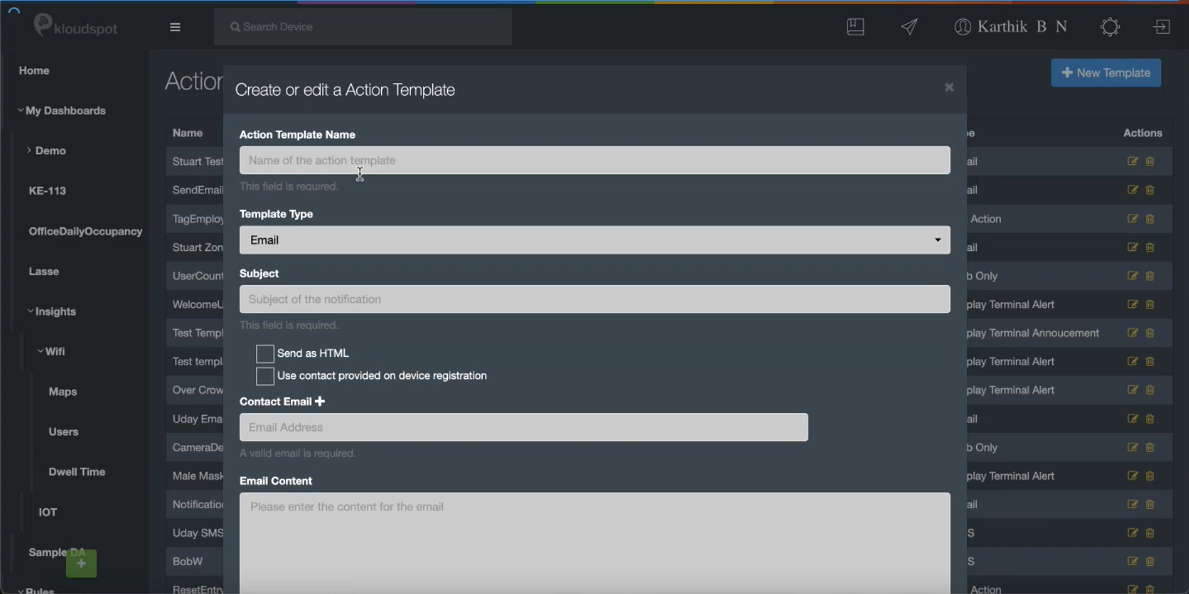
Configure an Action Template
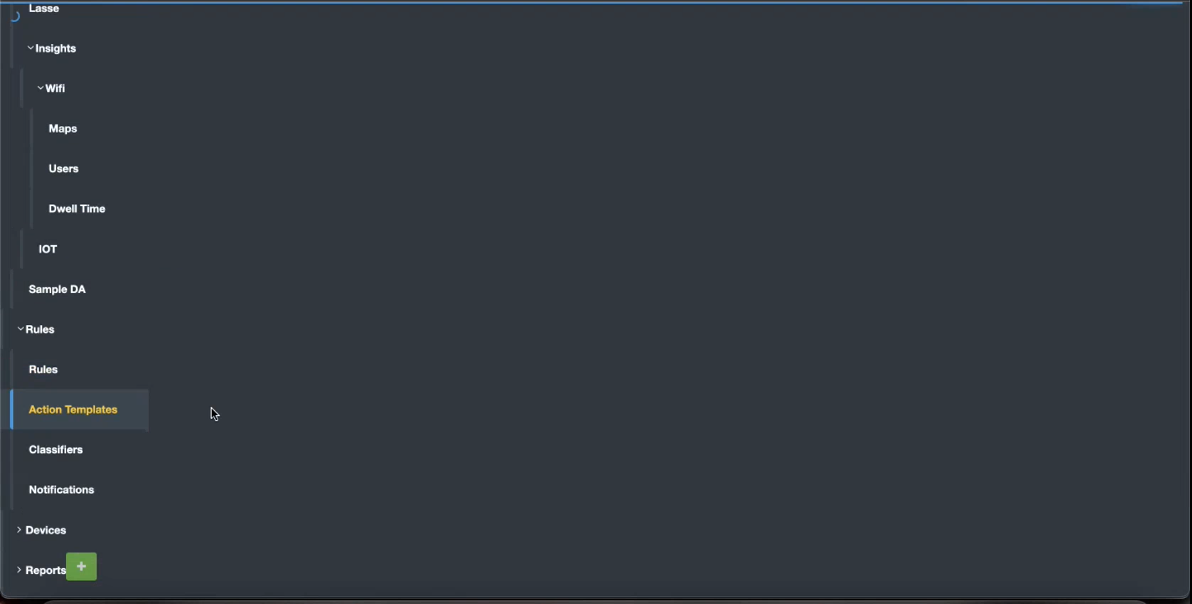
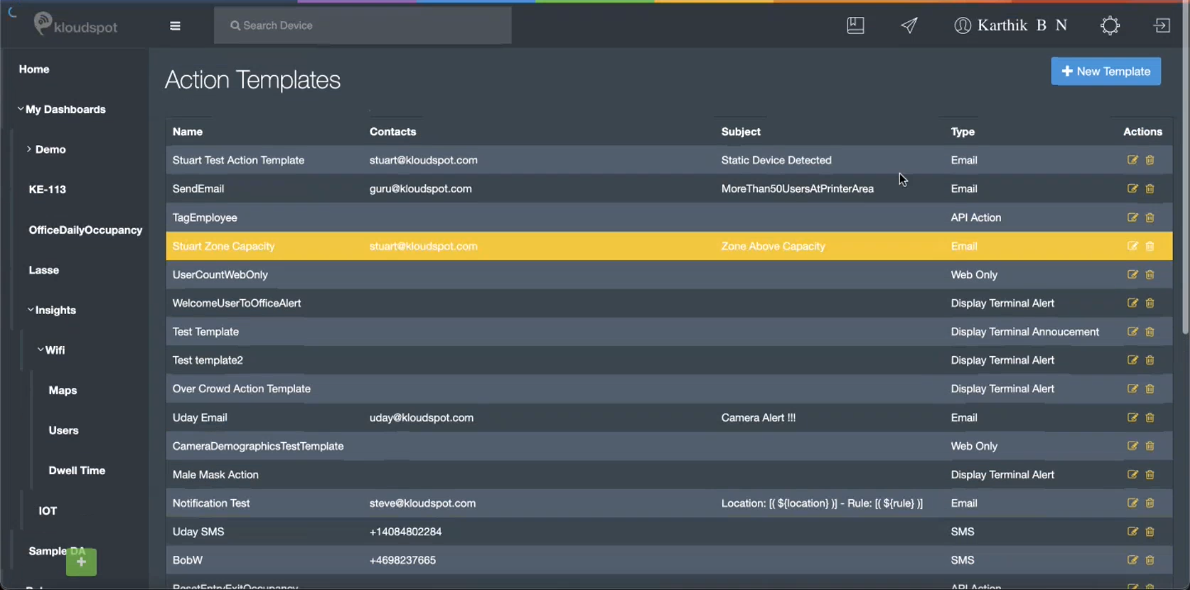
Action templates are the actions performed by the system when a particular
rule is met. To configure an action template, click on Action Template in
the left-hand side menu.
Click on +New Template to create an action template.
2. A Create or Edit an Action Template appears.
3. Enter the name of the template in Action Template Name.
4. Select the type of action you want from the drop-down under Template Type. In this example, we select Email.
5. Specify the subject of the template in Subject.
6. To receive the notification as HTML, check Send an HTML box.
7. Select Use contact provided on device registration to use the contact
preset when the device was registered.
8. Enter the email address in the Contact Email section.
9. Finally, enter the content of the email in the Email Content section.
Creating Rules
The rule editor is an easy way to create automated policies that trigger
actions once a condition is met. The rule editor is where you combine the
three key elements of a rule:
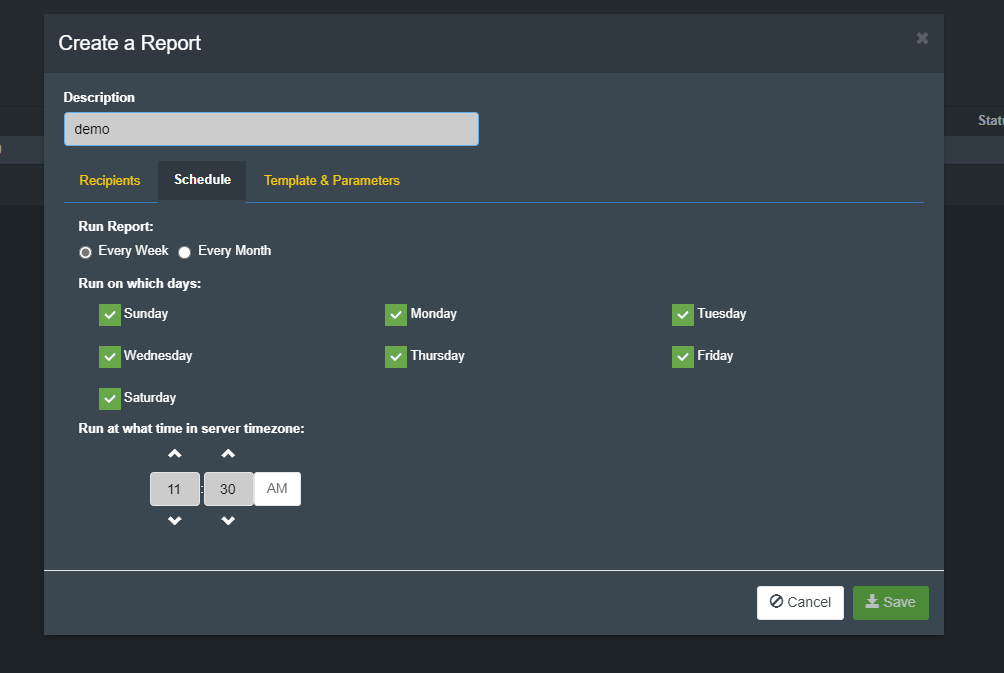
Schedule: When does the rule run?
Action: What happens when the rule is triggered?
Condition: Under what circumstances should the rule be triggered?
To create a rule, you first need to create an action template. If you haven’t created an action template yet, refer to the Action Templates section to create one.
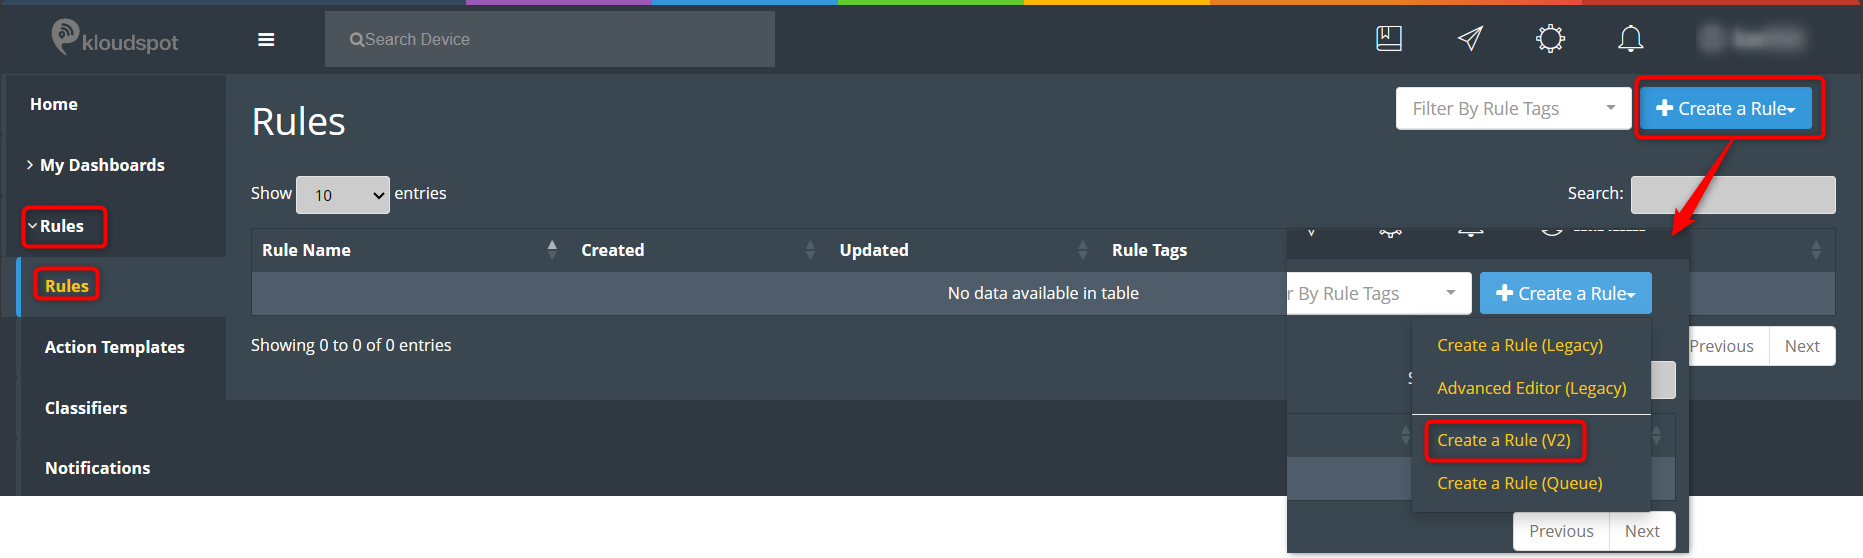
Creating a Rule
To initiate the rule creation process, navigate to Rules > Rules. Look for the Create a Rule button in the top-right corner of the page. Clicking on it will reveal three rule options:
Create a rule (Legacy)
Advanced Editor (Legacy)
Create a rule (V2)
For this guide, we’ll focus on the latest and most advanced option – “Create a Rule (V2).”
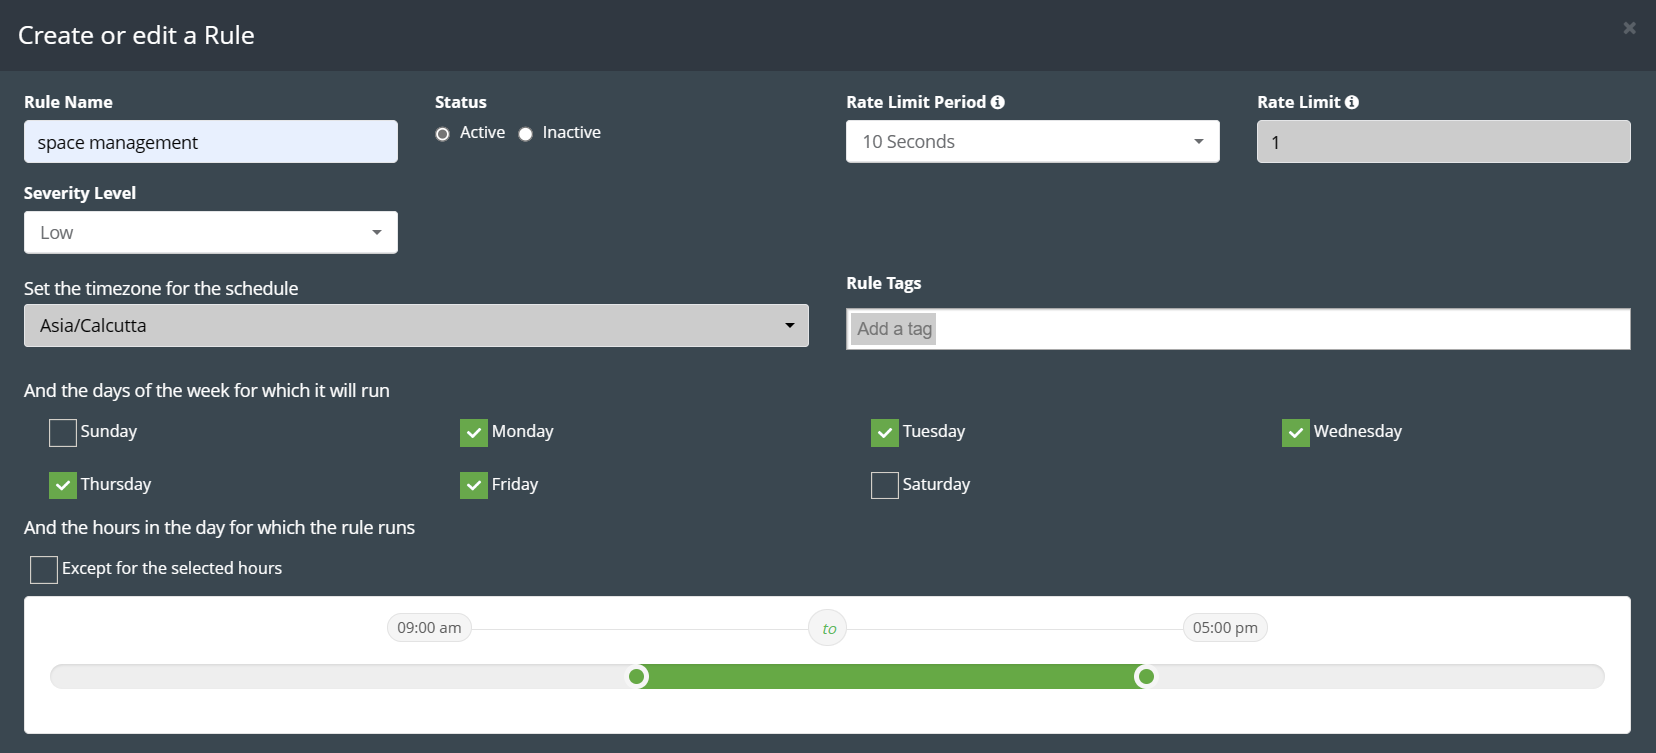
Click on Create a Rule (V2), and a new page will appear.
In the Rule Name section, enter a descriptive name for your rule.
Decide the rule’s status by checking the “Active” or “Inactive” box.
Set the Rate Limit Period and severity level of the rule.
Rate Limit Period: By configuring the Rate Limit Period appropriately, you can strike a balance between staying informed about potential security breaches and avoiding notification overload, thus enhancing the effectiveness of your Rule.
Limit: When setting a Rate Limit, you are defining the maximum allowable number of notifications that can be generated within a specific Rate Limit Period.
Severity level: You can select the impact of the rule. Three Severity Levels are available, Low, medium, and High.
Choose the time zone, specifying the days and hours the rule should run.
For example: If you want this rule to run from Monday to Friday from 9 am to 5 pm then check the days from Monday to Friday. Then select 9 to 5 in the time selection bar.
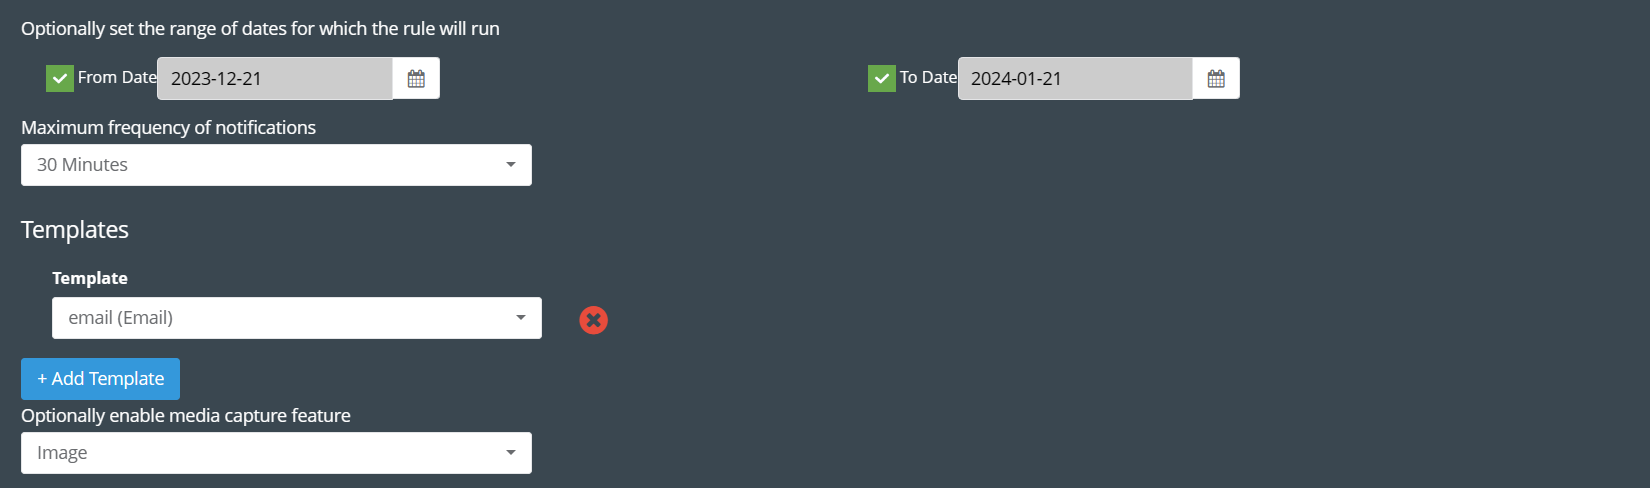
Optionally, set a date range for the rule’s activation.
For example: If you want this rule to run from December 21 to January 21, check the “from date” check box and select December 21. Then check the To Date checkbox and select January 21. This way you can run this rule for one month.
Select the frequency of notifications to stay informed about triggered rules.
Add a pre-prepared template using the Add Template section.
Optionally, enable the media capture feature to receive captured media when vision or camera rules are triggered.
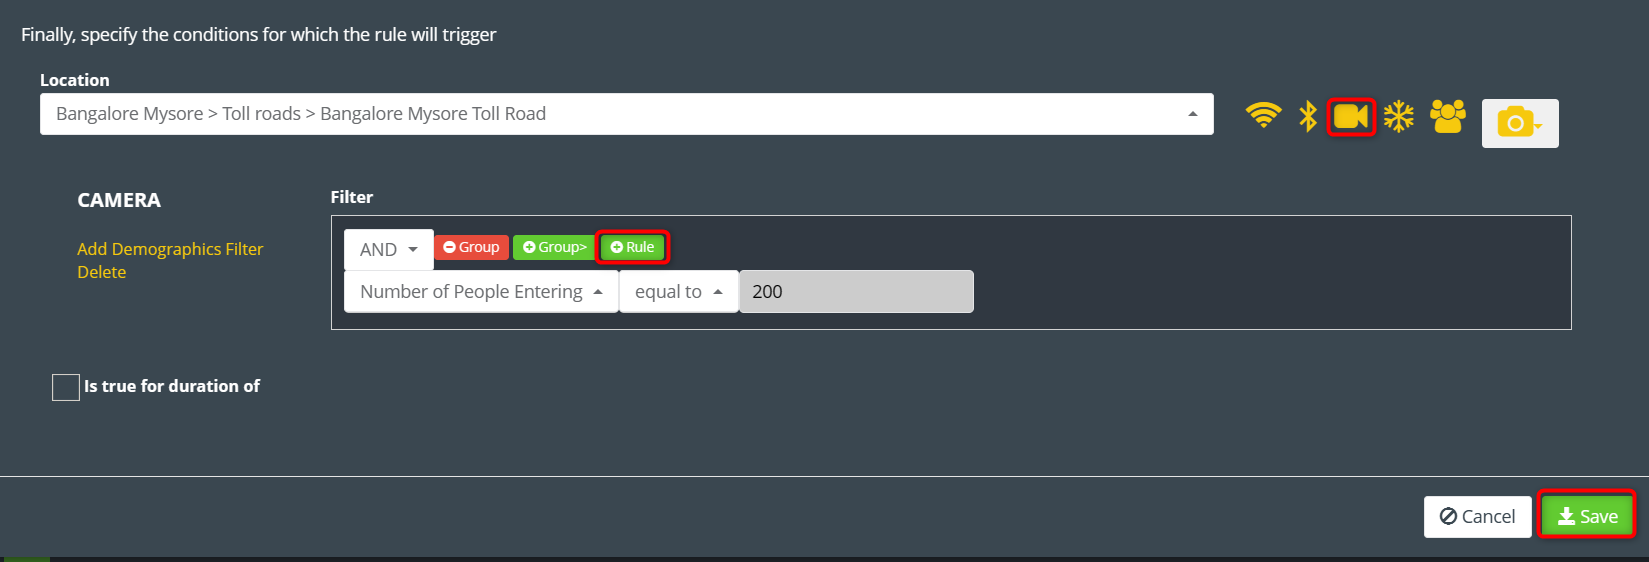
Specify the location where the rule will apply.
Add rules (WiFi, BLE, Camera, Air Quality, WiFi Density Condition, Vision Entity Condition) by clicking the corresponding icons.
For a camera rule, click on the Camera Icon.
Note: This is an example, you can create rules like WiFi, BLE, Air Quality, WiFi Density Condition, Vision Entity Condition etc, in the same way.
In the rule filter section that opens, click on the Rule button.
Select the main condition from the dropdown list.
Choose the secondary condition and add a value.
Example: “Number of people entering” is “equal to” 200.
Optionally, add more demographic filters by clicking the Add Demographics Filter button.
Click the Save button to preserve your configured rule.
Classifiers
Classifiers, with their incredible abilities, serve as powerful tools to
categorize and arrange various forms of data. They excel at recognizing and
labeling feature tags, device attributes, human characteristics, vehicle
traits, parking spaces, vehicle occupancy in parking areas, and even tracking
tools in a toolbox. By employing classifiers, we can efficiently arrange and
group data according to pre-established criteria. This process allows us to
extract valuable insights and create meaningful visual representations, such
as interactive dashboards, that present the classified data in a structured
manner. Whether we are analyzing patterns, tracking trends, or making data-informed decisions, classifiers play a pivotal role in organizing information
and simplifying complex datasets.
Types of ‘classifiers’
1. Tag: Tags are used to label and classify data based on specific keywords or descriptors. They help in organizing information and making it easily searchable and retrievable.
2. Device Attribute: Device attributes refer to the characteristics and properties associated with electronic devices or hardware components. Classifying device attributes helps in categorizing devices based on the following conditions:
MacAddress, Zone, Floor, site, Zone Tag, Associated, SSID, RandomizedMac,
Returned User, Session zone dwell (in milliseconds), Session floor dwell (in
milliseconds), Session site dwell (in milliseconds), Tags, Number of days
seen, Signal strength (RSSI in dbm), Probe Count, Time Of The Day, Day Of The
Week
3. Human Feature: Human features encompass the distinct characteristics
and traits of individuals. Classifying human features helps in categorizing
humans based on the following conditions:
Gender, Area Of Interest, Tracking state, Face Mask, Medical Gown, Medical
Eye Glass, Medical Cap, Medical Gloves, Zone By Center, Zone By maximum Area,
Zones intersected, Dwell in camera view (in milliseconds), Age, Emotion,
Direction (entry/exit), Time Of The Day, Day Of The Week
4. Vehicle Feature: Vehicle features involve the attributes associated
with automobiles and other modes of transportation. Classifying vehicle
features helps in categorizing vehicles based on the following conditions:
Type, Tracking state, Dwell in camera view (in milliseconds), Time Of The
Day, Day Of The Week, First slot parking, EE, First parking occupancy
(percent), Second parking occupancy (percent), Is First slot parking zone, Is
Second slot parking zone, Is Multi Slot adjacent two vehicle parking.
5. Parking Slot: Parking slots are designated areas where vehicles can
be parked. Classifying parking slots helps in categorizing parking slots based
on the following conditions:
Tracking state, Dwell in camera view (in milliseconds), Is A Parking Zone,
Time Of The Day, Day Of The Week.
6. Vehicle Parking Occupancy: Vehicle parking occupancy refers to the
state of whether a parking slot is occupied by a vehicle or not. Classifying
vehicle parking occupancy involves the following conditions:
Vehicle Type, Tracking state, Dwell in camera view (in milliseconds), Time
Of The Day, Day Of The Week, Multi slot parking, Main Parking Occupancy
(percent), Secondary Parking Occupancy (percent), Is Main Slot A Parking Zone,
Is Adjacent slot a parking zone, Is Multi Slot Adjacent Two Vehicle Parking.
7. Parking Slot Occupancy: Parking slot occupancy refers to the state of
whether a parking slot is occupied or not. Classifying parking slot occupancy
involves the following conditions:
Tracking state, Dwell in camera view (in milliseconds), Time of the day,
Day Of The Week, Multi-Vehicle Parking, Main Vehicle Parking Occupancy
(percent), Second Vehicle Parking Occupancy (percent), Is A Parking Zone.
8. Toolbox: This condition is used to classify changes in the toolbox.
Classifying Toolbox involves the Area condition.
How to add a classifier
Adding classifiers to the KloudInsights platform allows you to categorize and
organize data effectively.
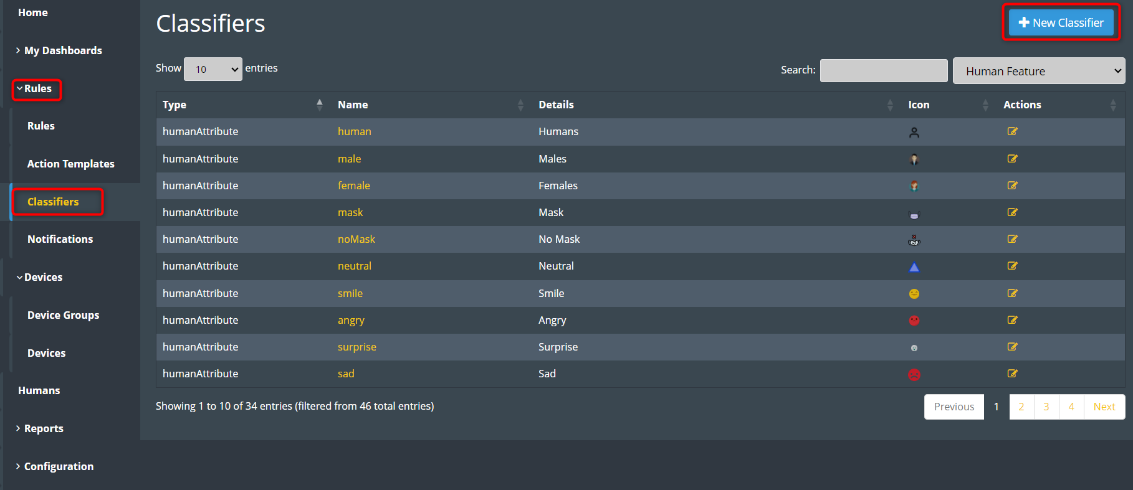
Login to the KloudInsights platform.
Once logged in, locate and click on the “Rules” option in the navigation menu.
From the drop-down menu, select “Classifiers.” This action will open the classifier window, displaying the currently available classifiers.
To create a new classifier, click on the "+New Classifier" button located at the top right corner of the classifier window.
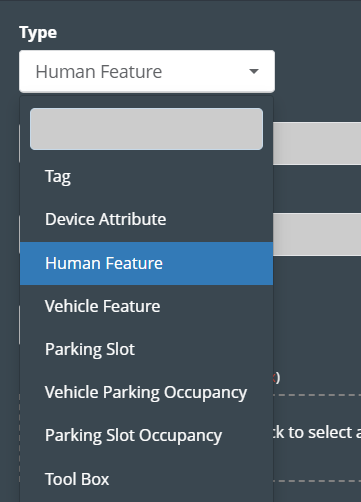
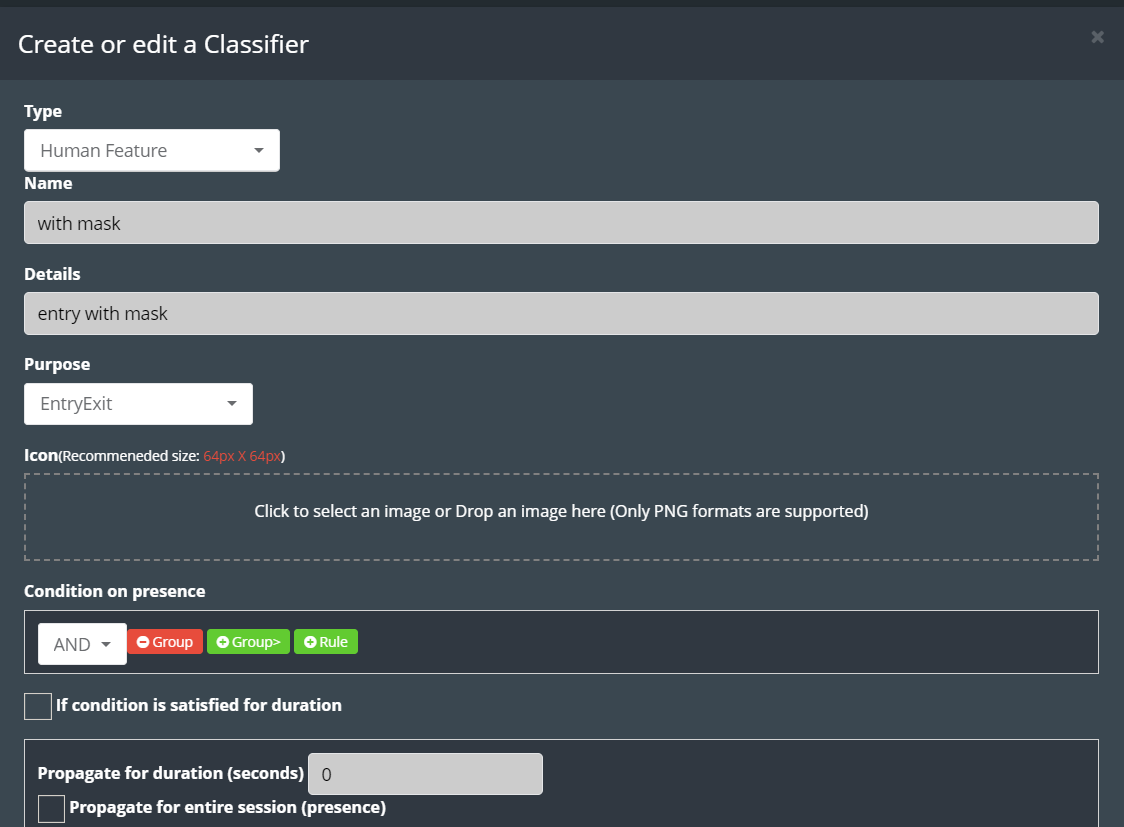
5. In the “Create or Edit a Classifier” popup window that appears, choose
the desired classifier type from the “Type” dropdown list.
6. In the “Name” section, provide a suitable name for the classifier.
7. Specify additional details about the classifier in the “Details”
section.
8. Then select the purpose from the drop-down list.
9. If desired, select an icon for the classifier by either clicking on the
“Icon” section or dropping an image onto it.
Note: only PNG format images are supported, and the recommended size for
the icon is 64px * 64px.
10. Each classifier has its own set of conditions. In the “Conditions”
section, choose the relevant condition(s) for your classifier.
11. You can join multiple conditions using logical connectors like “AND,”
“OR,” etc.
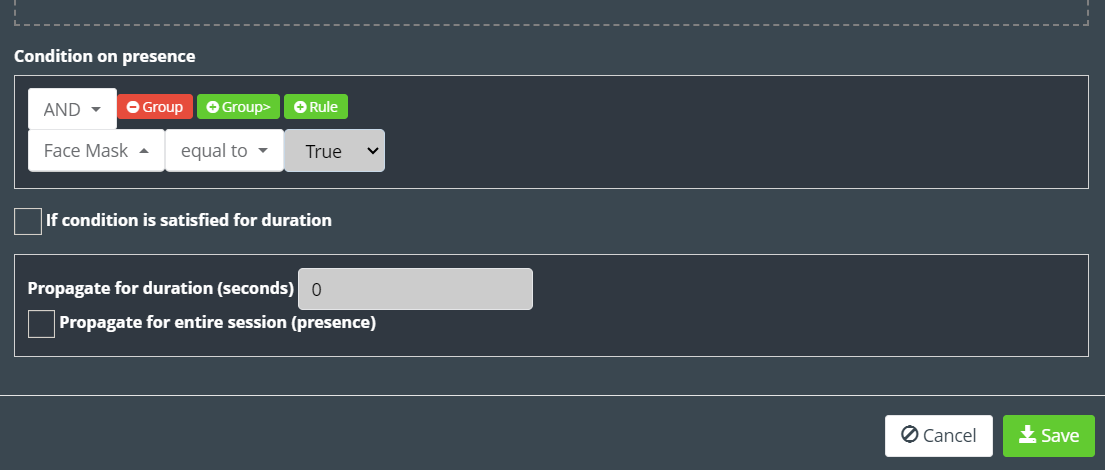
Example: To create a classifier for people wearing face masks, select
“EntryExit” from the “Purpose” dropdown list.
Choose the “AND” connection in the “Condition on presence” section.
Click the “Rule” button to add conditions.
Select the condition “facemask > equal to > True.”
According to this condition, if someone enters with a mask, they will be
classified accordingly.
Utilize the information in this classifier by using the dashboard for various
purposes.
12. Finally, click on the “Save” button to save the newly created
classifier.
Devices & Device Groups
Devices
The Device section within KloudInsights provides a centralized hub for managing devices. This functionality is crucial for creating device-based rules and dashboards. This guide outlines the steps to add, edit, and delete devices efficiently.
Add new devices.
Navigate to Devices > Devices.
In the window that opens, click on the New Device button.
A popup window will appear; enter the following details in the Create tab:
MAC address
Tags
First Name
Last Name
Email
Phone number
Navigate to the Icon tab.
Optionally, add an icon corresponding to the MAC address.
Click on the Location tab and select the relevant location information.
Click the Save button to store the device information.
Uploading Multiple MAC Addresses
To add multiple MAC addresses simultaneously, create a CSV file containing the MAC address list.
Click on the Upload button to refer to the instructions in the popup window to format the CSV file correctly.
If you have a pre-existing CSV file, select it and click the Upload button.
To download the currently added MAC addresses, click on the Download button.
To remove all added devices, click the Delete All button.
Device Groups
The Device Groups feature allows you to organize devices based on a variety of parameters such as MAC address, SSID, and tags. This segmentation enables the creation of device-specific rules as well as dashboards.
Creating Device Groups
Navigate to the Devices > Device Groups.
Click on the New Device Groups button to begin the process.
Choose the type of group based on your criteria:
User Group: For grouping devices based on MAC addresses.
SSID Group: For grouping devices based on SSID.
Tag Group: For grouping devices based on tags.
Enter your group name.
Add Devices to the Group depending on the group type selected:
If User Group is selected: Enter the MAC addresses of the devices to be included in this group.
If SSID Group is selected: Choose the relevant SSID for grouping devices.
If Tag Group is selected: Select the tags associated with grouping devices.
Click the Save button to confirm and save the newly created device group.
Rule Notifications
Rule Notifications provide a centralized view of triggered rules within the system. When a rule is activated, users can review the relevant information on the Rule Notification page. This section outlines the steps to access, filter, refresh, and clear Rule Notifications.
To access the Rule Notifications page, navigate to Rules > Notifications.
The Rule Notification page provides a summary of all triggered rules. The following information is displayed for each rule:
Rule Name
MAC Address
Location
Trigger
Action
TimeStamp
To simplify the process of finding specific rules, users can utilize the filter option. Follow these steps to filter rules:
a. Click on the Show Filter button.
b. Specify filter criteria for MAC Address, Rule Names, Location, Action, and Date.
c. Enter the required information.
d. Click on the Apply Filter button.
Users can refresh the Rule Notification page by clicking on the Refresh button.
To clear the Rule Notification page and remove all displayed entries, click on the Delete All button.
Creating dashboards
One of the key features of the Kloudspot Analytics platform is the ‘dashboards’ feature, which allows users to gather and present the data they are interested in using a flexible widget-based interface.
1. To add a new dashboard, click on the New Dashboard button at the bottom of the menu bar.
2. Enter the dashboard name and description in the popup window that opens and click on the Save button.
3. Then click on the Add widget button on the dashboard.
4. In the widget list that opens, Here we are adding a camera widget, but the process is essentially the same for all the widgets. Click on the camera tab, and add the
widgets you want.
5. If you want to change the location of the widget, click on the
settings button and change the location.
6. Click the Save button to save the location.
7. Refer to the Dashboards section to learn more about the various dashboards available.
Dashboards
Overview
To see the dashboard you made, simply click on “My Dashboard” in the menu. If you’d like to create a new dashboard, check out the Creating Dashboards section for guidance.
Widgets
Kloudspot Analytics offers a wide variety of widgets that users can pick and
choose from to create a dashboard.
Analytics (1)
Footfall Density
A floor-by-floor statistical view of device density across a site
Footfall: The total number of devices that enter a physical space or location over
a given period of time.
Avarage density is calculated per square area. These are further color-coded based on
the density on the area or floormap. In configuration, we can predefine the color
code (based on numerical measure) for Avarage density.
Here, density is divided into ranges and on the basis of those ranges, it is
given tags like A , B, C , D , E .
Calendar (5)
Bluetooth timeline
This widget is available only for Bluetooth devices.
This widget gives a timeline view of user dwell times at a given location.
We can search for devices (using a Mac address or name) connected via Bluetooth.
You can select a date range (duration of 7 days) to monitor and analyze the
user engagement in different zones on a site.
User timeline
This widget is available for Wi-Fi devices.
We can search for devices connected via Wi-Fi. You can select a date range
(duration of 7 days) to monitor and analyze the user engagement in different
zones on a site.
This widget gives the timeline view of user dwell times at a given location.
Here we can add maximum 25 devices.
User Footfall
No. of unique devices seen on the site per day in given period of time for the
selected location. This calendar also shows the weather information.
In the settings menu, we have options of selection between 2 devices that are
Wi-Fi device and Bluetooth device.
In setting, we also have option “Attributes” selection functionality which
basically filters users/ client on the basis of field selected.
User Dwell Time
This shows the Avarage dwell time spent by unique devices on the site per day
along with weather information shown in the calendar view.
Here in settings, we have the option of “Dwell type” that has “Average Dwell
Time” and “Average Visit Length” (please select one).
Average Visit Length: it shows average of the amount of time user spends in a
given location in given time interval divided by Number of times user visit a
location in given interval.
In the settings,
there are options available to select the device type in the settings options, i.e either a Wi-Fi device or a Bluetooth device.
Option available for “Attributes” selection functionality, which basically filters users or client on the basis of field selected.
User Calendar
This widget gives information about both the “User Footfall” and “User Dwell
Time” per day.
This widget shows the calendar view of both “User Footfall” and “User Dwell
Time”.
In the settings,
There are options available to select the device type in the settings option, i.e either WIFI Device or Bluetooth device.
Option available for “Attributes” selection functionality, which basically filters users or client on the basis of the field selected.
Maps (20)
User Distribution FloorMap With Statistics
The widgets show the users present in different zones on the floormap. It also
shows additional data w.r.t the total visitors per day, as shown in figure
below.
Live User Heatmap
The presented widget is designed to visualize user footfall and density at a specific location. It includes various options to enhance the user experience and analysis:
Heat Map: This feature illustrates the density of users on the map, with high-density areas shown in red.
Zone Capacity: The floor map can be segmented into different zones, allowing users to examine footfall within specific areas.
Zone Capacity Key: This section provides percentage ranges (A, B, C, D, E, F) along with corresponding colors, representing different levels of user density in the zones.
Refresh Interval (sec): Users can set a time interval to automatically update the widget’s data, ensuring real-time information on user footfall.
Include Tags: This filtering option enables users to view footfall data for specific user groups based on tags, such as VIPs, staff, or students.
Exclude Tags: Similarly, this option allows users to filter out data for certain user groups, providing more focused footfall analysis.
Floor Switching: In case the location has multiple floors configured, users can easily switch between floors to analyze footfall on different levels of the building.
Overall, this versatile widget provides valuable insights into user footfall and density across the location while offering flexible customization options to cater to various analysis needs.
User TreeMap
In settings, select options for either Wi-Fi device or a Bluetooth device.
The user treemap shows the user count on each zone configured across the
floormap and its children on the basis of date we select.
We can see the user count of all divisions if we have more divisions on the floormap.
In settings, we also have the option “Attributes” selection functionality, which
basically filters users or client on the basis of the field selected.
User Distribution FloorMap
This is a view of different users present on the floormap based on different
parameters available in the search functionality options on this widget like
floormap, zones, heat map, access points, connected users, probing users,
bluetooth users, geolocated users only, group zone users, exclude passerbys.
In setting, we have option of “Refresh Interval(sec),” which refreshes the widget
on the basis of given time interval.
We also have the option of “include tags”, that filters on the basis of some tags
and also other option for “exclude tags”, that filters on the basis of the same
tags that are in the include tags.
User Counts By Location
In settings, select options for either a Wi-Fi device or a Bluetooth device.
This table shows the number of users seen at every zone on a selected date. You
can also select the time range to get more detailed information on the
footfall count.
Here are options available for “from date” and “to date” which takes dates
input in the range of 7 days for which we want to see the user counts.
The “Filter Zones” dropdown allows us to filter locations for which we want to
see user counts. The selection of “hours” gives user counts for particular
hour range. However, by default, it gives user counts for whole day (24 hours).
In settings, we also have the option “Attributes” selection functionality, which
basically filters users or client on the basis of field selected.
Location Occupancy Chart
The “Location Occupancy Chart” is a representation that provides an overview of the occupancy status of each zone within a specific location. This chart displays the occupancy on an hourly basis as a percentage of the total capacity for each zone, giving users a quick and clear understanding of how full each area is.
Important Features of the Location Occupancy Chart:
Zones: Each zone within the location is listed on the chart, along with their respective capacities. This information allows users to know the maximum number of users that can be accommodated in each area.
Occupancy Percentage: The chart shows the current occupancy of each zone as a percentage of its total capacity. This percentage is calculated by dividing the number of current users in the zone by its maximum capacity and then multiplying by 100.
Color Indicators: To provide a visual cue, the zones may be color-coded based on their occupancy status. For example, 0% indicates with no occupancy, and as percentage increase the color become darker. Making it easy to identify areas that are approaching or have reached their capacity.
By using the Location Occupancy Chart, users can make informed decisions regarding crowd management, resource allocation, and overall safety measures. It allows them to proactively address any potential issues related to overcrowding or underutilization in different zones, ensuring a smooth and optimized experience for all users within the location.
User Distribution Heatmap
This is a user distribution information, where you can view the user movements
from one to another throughout the day.
Zone Traffic On Floor Map
This widget shows the user flow/ traffic from one zone to another.
Site Traffic On Geo Map
The widget show the movement of users between different sites. It provides valuable insights into the flow of users from one site to another and allows users to monitor real-time traffic as well as view traffic data for specific dates using the “Live traffic” and “Custom” options.
Features of the Traffic Visualization Widget:
Traffic Flow between Sites: The widget presents a graphical representation of user traffic, showing the paths users take as they move from one site to another. This flow may be represented as arrows or lines connecting the sites.
Live Traffic: The “Live traffic” option enables users to view real-time data on user movement between sites. This provides an up-to-date and dynamic view of the current traffic patterns.
Custom Date Option: The “Custom” option allows users to select a specific date and view the traffic data for that particular day. This feature enables the historical analysis and comparison of traffic trends on different dates.
By using this Traffic Visualization Widget, users can gain valuable insights into user behavior, identify popular routes between sites, and make informed decisions regarding resource allocation and traffic management. The ability to view both real-time and historical data provides a comprehensive understanding of user movement patterns, helping to optimize operations and enhance the overall user experience.
Live User Movements on Floor Map
The live user widget shows the live movement of a user on the entire floormap.
Live User Movements Between Zone
The widgets shows the count of user footfall in each zone on the floormap.
Live User Heatmap On A Floor
Multi Sensor heatmap
The Multi-Sensor HeatMap widget in the side panel is a powerful tool that allows users to gain a comprehensive overview of various environmental and occupancy metrics within a particular area or building. Here’s a breakdown of the features and information provided by the widget:
Occupancy: This shows the real-time or historical data on the number of people present in the monitored space. It helps in understanding the occupancy patterns and trends.
Air Quality Index: This displays information about the air quality index within the zone.
Temperature: This presents the current temperature in the monitored space. Temperature levels can affect comfort and energy efficiency, making it essential to keep track of them.
Humidity: This indicates the humidity levels in the area. Monitoring humidity is crucial for maintaining a healthy indoor environment and preventing issues like mold growth.
Illuminance: This refers to the measurement of light intensity in the monitored space. It helps in understanding the lighting conditions and may be important for tasks that require specific lighting levels.
Meeting Room Availability: This feature shows the availability status of meeting rooms, indicating whether they are vacant or booked. It helps in finding available rooms quickly.
Top Busy Zone: This heatmap highlights the areas within the space that are most occupied or frequently used. Identifying the most busy zones can aid in space planning and resource allocation.
Sensor Information: This section provides detailed information from individual sensors placed in various locations within the monitored area. The information may include:
Occupancy: Sensor data on the number of people in specific zones or rooms.
Dwell Time: The average time people spend in specific areas, helping analyze user behavior and space utilization.
Users: Information about individuals present in the space, possibly linked to their profiles or devices.
Room Heatmaps: Visual representations of occupancy patterns and heatmaps for different rooms, indicating popular or less-used areas.
Temperature and Humidity: Detailed readings of temperature and humidity from individual sensors.
Illuminance: Specific light intensity measurements from sensors.
Live User Movements
Visualization displays user movements on a floor map in real-time on the
basis of different parameters present in the search functionality for this
widget, like zones, access points, probing users, Bluetooth users, exclude
passerby, show movements, and heatmap.
This widget allows searching for particular user movements on the basis of a Mac
address, name or tag.
The widget also consists of an option to “include tags” that filters on the
basis of some tags and another
Option, which is “exclude tags” that filters on the basis of same tags that are
in include tags.
Live User Path Movements
The live user path movement visualization widget is used for tracking and analyzing user activity on a floor map. It offers various features for customizing and filtering the displayed data. Let’s break down the main features of this widget. You can use filters like Zones, Probing Users, Bluetooth Users, and Exclude Passerby. Also, inside the bar you can filter the user as well.
Site Device Density Map
A consolidated view of device density across a site.
Live User Movements Between Zone Tags
In settings, select options for either a Wi-Fi device or a Bluetooth device.
This is a real-time visualization of user movement (in percentage) between zone tags on a selected location. Here we give some custom tags on zones and can view the user’s movements.
In this widget, we have the search filter “Filter Zones By Tags” and “Display Metric”.
Last Known Location on FloorMap
Locate any wi-fi or bluetooth device by displaying the last known location on a
floormap.
Here, we have “search user” functionality that allows to search a user by its
name or just entering Mac address of the device to be looked for on the
floormap.
Floormap Device Density
(..need to attach widget image)
A consolidated view of device density on a floormap
Dwell Time Map
This widget displays a map that shows users according to their dwell time on
the basis of time intervals and shows the users on the map with different
colours on the basis the given time intervals.
Dwell time is the amount of time that user spends in a particular location.
Allows you to select from “Map” view or “Satellite” view and in “Duration” we
can select the options like “Today”, “Yesterday” and “Custom” to show users
data accordingly. In “Custom” we can select date range (max upto 7 days) for
users.
On filling in all the required details, click on “load users” which gives all
users according to given time interval on the widget and on selected fields.
Matrix (2)
Multi-day Location Counts
Tabular representation of user distribution in different zones for the
selected date range.
Others (7)
RSS Feed
Add any RSS Feed to your dashboard with ease.
Site Reporting Dashboard
Site Reporting Dashboard with Key Elements
Rule Alarm
Display an alarm when a specified rule is triggered.
Cisco meraki Logs
(…need to attach widget image)
List of the each access points logs
Webpage
Add any external gadget/webpage to your dashboard with ease
Cisco Meraki clients details
List of the connected client devices for a specific network based on the SSID
that was chosen.
KPI
Display a list of KPIs for selected zones.
Path (7)
Path Distribution
Outbound User Traffic Flow
Path Distribution Matrix
Inter-Site Path Distribution
Inbound User Traffic Flow
Inbound User Traffic Flow
Outbound User Traffic Flow
Time (3)
Dwell Time Chart
Dwell time information for each zone on the site.
Dwell Time Chart By Attribute
(…Need to attach widget image)
A bar chart that displays a distribution of all the venues with respective
user dwell times.
Live Floor/Site Device Density
(…Need to attach widget image)
A Live Streaming Density of given Floor/Site
User (12)
Multi-Location Repeat Users
Zone wise user count information for the selected date range and zones.
User Overview
Select a zone for information on the Connected users and Probing users.
User 360
Every detail about the specific user registered in the system.
Heap Map
For a zone, shows the footfall in for every hour for the last 7 days. The
color code represents, darker the color, higher usercount.
User Details
Based on the users type selected, here, ‘Probing users’. Select a user to see
it’s more details like days seen, Last seen and the session summary as shown
in figure below.
User counts by presence attributes
This bar graph is a combined information of the probing users and associated
users in a zone for the selected time period.
Bluetooth Device Details
Similar to user details, shows summary of selected user.
User Demographics
More detailed information of the user such as contact details, login details,
etc as shown in figure below.
Inter-Site User Movements
Probing/Associated Users Chart
Graphical representation of the probing and associated users for a specific
zone.
Repeat Users
Graphical representation of the no. of repeated users in each zone.
Queue Wait Times
Coming Soon!
Camera (14)
Gender Demographics Calendar
This widget provides businesses with a calendar view of user gender data as
detected by cameras at a given location. By analyzing this data, businesses
can gain insights into the gender distribution of their customers and adjust
their marketing strategies accordingly.
Live User Heatmap From Camera On Floor Map
The widget produces a heatmap that illustrates the density of people in a
specific region, with darker colors indicating higher density and lighter
colors indicating lower density. The heatmap is updated in real-time, and the
widget also offers historical data. If desired, it is possible to obtain an
animated representation as well.
Note: To get this, an ROI (region of interest) needs to be drawn at the
point where the camera is added. Refer to the insights user manual to know how
to draw it.
Inbound Entity Traffic Flow
1. The “Inbound Entity Traffic Flow” widget is a powerful tool for visualizing the flow of entities from different zones into a specific zone. This widget generates a flow chart that illustrates the movement of entities, such as people, or vehicles, from their origin zones to selected zone.
2. Select Entity Type from the dropdown list then select Zones, Depth, and Date.
Path Distribution
The Path Distribution widget provides businesses with a chord diagram to
visualize the most common paths taken by users from and to any given location.
By analyzing this data, businesses can optimize product placements and signage
to increase sales.
Path Distribution Matrix
This widget shows the movement of an entity from one zone to another in the
form of a square chart and displays the entity count.
Outbound Entity Traffic Flow
The “Outbound Entity Traffic Flow” widget is a powerful tool for visualizing
the flow of entities from one specific zone to another zones. This widget
creates a flow chart depicting the movement of entities such as people, or
vehicles from a selected zone to another zone.
Camera Footfall Calendar
The Camera Footfall Calendar provides businesses with a calendar view of user
footfall at a given location. By analyzing this data, businesses can identify
peak traffic times and optimize staffing schedules accordingly.
Live User Movements From Camera On Floor Map
The Live User Movements From Camera On Floor Map widget displays a
visualization of user movements on a floor map in real-time. This widget can
help businesses optimize store layouts and staffing schedules to ensure that
customers have a positive shopping experience.
Camera Footfall Analytics
The Camera Footfall Analytics widget is a robust tool for businesses that
captures data on entry/exit count, and occupancy. The widget also generates a
bar chart that displays footfall information. You can select different cameras
from the dropdown list.
Live Video Stream with Analytics
The Live Video Stream with Analytics widget displays analytics from a selected
camera. It captures data on entry, exit, and occupancy, and providing insights
into how many people are entering and leaving a specific location, as well as
how many people are in the area at any given time.
Camera Characteristics Trends
The Camera Characteristics Trend widget is a powerful tool for businesses and
organizations looking to better understand the demographics of their customer
base or audience. By selecting specific demographic categories such as male,
female, mask, no mask, smile, or angry, the widget will generate a line chart
that displays trends in those characteristics over time.
Note: If you choose additional demographic categories, the X-axis will
expand to accommodate them.
Live Video Stream
The Live Video Stream widget displays a smooth live video stream from a
selected camera. This widget can help businesses monitor customer behavior in
real-time and make adjustments to their operations as needed.
Live Video Stream with Heatmap
The Live Video Stream with Heatmap widget displays a live video stream and
heatmap from a selected camera. This widget can help businesses monitor
customer behavior in real-time and make adjustments to their operations as
needed.
Camera Demographics Trends
The Camera Demographics Trends widget displays a timeseries chart showing the
trend of user demographics and camera feature analytics over a given time
period. This widget can help businesses identify trends and make data-driven
decisions.
Camera Occupancy Trends Over Time
This widget is a powerful tool that uses data from Kloudvision cameras to
track the occupancy levels of a queue over a given period of time. This widget
provides valuable insights about the overall efficiency of the queue
management system.
Live Camera Count Heat Map
The Live Camera Count Heat Map widget is a powerful tool that uses Kloudvision
cameras to display the total number of people in a zone. This shows how many
people were in a zone in the form of a heat map.
Live User Heatmap On A Floor Camera Image
The Live User Heatmap On A Floor Camera Image widget displays a visualization
of user movements on a camera image in real-time displayed in the form of a
heatmap. This widget can help businesses optimize store layouts and signage to
increase sales.
Entity Demographics
Entity Demographics widget provides a visualization of the distribution of
entities at a given location, including a brief summary of each entity’s
information. This widget can help businesses gain insights into the
demographics of their customers and adjust their marketing strategies
accordingly.
Outbound User Traffic Flow
The “Outbound User Traffic Flow” widget is a powerful tool for visualizing the
flow of entities from one specific zone to another zones. This widget creates
a dot chart depicting the movement of entities such as people, or vehicles
from a selected zone to another zone.
Inbound User Traffic Flow
The “Inbound User Traffic Flow” widget is a powerful tool for visualizing the flow of entities from different zones into a specific zone. This widget generates a dot chart that illustrates the movement of entities, such as people, or vehicles, from their origin zones to selected zone.
Select Entity Type from the dropdown list then select Zones, Depth, and Date.
Environmental Sensors (1)
Environmental Sensor Trends
A timeseries chart displaying a trend of air quality measurements of an
environmental sensor in a given time period
Reports
Overview
The reporting system allows report creation jobs to be scheduled for regular
execution with the results emailed to a set of recipients, and also has a file
transfer feature.
Reports display the essential findings of the platform in human-readable
manner. Reports can also be exported and printed for further use.
To generate a report, click on Report in the left-hand side menu.
To find out the types of reports generated, click on Report Types under
Reports.
Report Types
To generate a report, click on the Play button to the right of the
specific report type. We can run and generate the custom reports even by
uploading report definitions in the format of json or yaml by clicking on the
bottom left.
Select the parameters (e.g. Site ) under Report Parameters tab.
Click on Run Report to generate the report.
To find the history of generated reports, simply click on History under
Reports.
History
You can download the report by clicking the download button to the right
of the specific report. The report is downloaded in the PDF format. A sample
report is below:
You can also delete a specific report by clicking the delete button to the
right of the specific report.
Generating reports can be automated by scheduling them. To schedule a report,
click on Scheduled under the Report section.
Scheduled
To schedule a new report, click on + New Report in the top right of the page.
Enter the description of the report in Description field.
To enter the recipient’s details, click on Recipients.
Enter the email address (where the report will be sent) in the Email Recipients section.
Select the files to be sent in File Transfer.
To customize the schedule settings, go to the Schedule tab.
You can configure to run a report on weekly and monthly basis under Run
Report.
Alternatively, you can also schedule your reports to run on specific weekdays.
Simply check the boxes adjacent to the days when you want the report to run.
Specify the time when the report will run in the time section.
Report types
We have various report types within Insights currently shipped by default with
the system.
Below is a list of all the report types and the sample report for each.
Bluetooth Usage Report:
(for Bluetooth devices only)
This report contains details of devices connected via Bluetooth for the
selected date range and locations.
This report contains the details of devices connected via Bluetooth for the
selected locations and date range.
The report can be exported in CSV format. A sample Bluetooth Usage Report
looks like:
Select ‘run report’ and fill in the details below to run this report.
To run a report:
Click on the play button at the right end of the report row.
A pop-up appears.
Select the locations in the Locations dropdown.
Choose the period for which the report is generated by selecting DATERANGE i.e. f rom and t o- dates .
Check the TAGGED box if you want to run a tagged report.
Click on Run Report to generate the report.
Devices by day
(for Wi-Fi devices only)
This report contains the information of wi-fi devices seen for the selected
dates in CSV format.
To run a report:
Click on the play button at the right end of the report row.
A pop-up appears.
Check the Date Range under Report Parameters.
Select f rom and t o- dates.
To include only the data for known devices, check the KnownDevicesOnly.
Click on Run Report to generate the report.
Here is how a sample report looks like.
Devices Daily History
( for WiFi devices only )
This report generates a CSV containing information about device history by day
for selected locations and a date range.
To run a report:
Click on the play button at the right end of the report row.
A pop-up appears.
Check the Date Range under Report Parameters.
Select the starting time of the day in the START OF THE DAY section.
Select the locations by clicking on the drop-down menu under LOCATIONS.
Click on Run Report to generate the report.
Here is how a sample report looks like.
Devices in specific time and location
( for Wi-Fi devices only )
This report generates a CSV containing information of devices seen by day for
a date range and time on a selected site.
To run a report:
Click on the play button at the right end of the report row.
A pop-up appears.
To select the date range for which the report is needed, enter the From and To dates under Report Parameters.
To get the report for only the registered users, check the box next to Registered User.
To get the report for only the known devices, check the box next to Known Devices Only.
Select the location by clicking at the drop-down menu below Locations.
To get the report for users with email, check the box next to User With Email.
Click on Run Report to generate the report.
Here is how a sample report looks like.
Footfall and dwell
( For WiFi devices only )
This report will generate a CSV containing information of footfall and dwell
of devices for selected locations on a daily and an hourly basis.
To run a report:
Click on the play button at the right end of the report row.
A pop-up appears.
Select the location from the the drop-down options below LOCATIONS under Report Parameters.
To show the dwell report, check the box adjacent to SHOWDWELL.
Check the box before Select Date Range. Enter the date range by choosing the From and To dates below DATERANGE.
Select the tags that the report should include by choosing from the drop-down menu under INCLUDETAGS.
Select the tags that the report should exclude by choosing from the drop-down menu under EXCLUDETAGS.
Click on Run Report to generate the report.
Here is how a sample report looks like.
Footfall and dwell by day
Footfall and dwell by hour
Highs and lows by footfall and dwell
( For WiFi devices only )
Report of locations having highest and lowest footfall and dwell based on the
selected zone limit.
The following figure is a sample of the 4 different types of reports generated
as follows:
Bottom zones of the day by dwell
Bottom zones of the day by footfall
Top zones of the day by dwell
Top zones of the day by footfall
Monthly site report
(For WiFi devices only)
This report contains Information about the selected site for the entire
month.
To run a report:
Click on the play button at the right end of the report row.
A pop-up appears.
Select the site for the monthly report by clicking on the drop-down menu under Report Parameters.
Click on Run Report to generate the report.
Here is how a sample report looks like.
NOTE: Will provide a link to the entire sample PDF report.
Movement CSV report
(For WiFi devices only)
This report contains a report showing top movements into and out of zones
for a list of selected zones.
To run a report:
Click on the play button at the right end of the report row.
A pop-up appears.
Check the Select Date box under Report Parameters to enable selecting the date. Choose the date by
clicking at the calendar icon, or
Entering the date manually in YYYY-MM-DD format.
Click on Run Report to generate the report.
Here is how a sample report looks like.
Movement CSV report- 30 minutes
(For WiFi devices only)
This report contains a report showing top movements into and out of zone for
a list of zones every 30 minutes.
Sample Movement CSV report for 30 minutes: Need to attach figure below showing
a sample Movement CSV report.
Image…
Movement report
(For WiFi devices only)
This report contains the PDF Report showing top movements into and out of
zones for a list of selected zones.
To run a report:
Click on the play button at the right end of the report row.
A pop-up appears.
Select the type of report by clicking at the Report Template drop-down options.
Select the locations for which the report is to be generated by clicking at the LOCATIONS drop-down menu.
Select the date range under Report Parameters by
Clicking on the calendar icon, or
Entering the date manually in YYYY-MM-DD format.
Click on Run Report to generate the report.
Here is how a sample report looks like.
Overview Report
(For WiFi devices only)
This report contains a Report showing device information for the selected day
and the previous week.
To run a report:
Click on the play button at the right end of the report row.
A pop-up appears.
Select the type of report by clicking on the Report Template drop-down options.
Select the locations for which the report is to be generated by clicking at the LOCATIONS drop-down menu.
If you want to generate the report for each location, check Each Location under Report Parameter.
Choose the date of the report under Report Date by
Clicking at the calendar icon, or
Entering the date manually in YYYY-MM-DD format.
Click on Run Report to generate the report.
Sample Overview report
The figure below shows a sample overview report in a PDF format.
NOTE: Will provide link the entire sample PDF report.
Overview (previous day)
(For Wi-Fi devices only)
This report shows device information for the previous day
and week.
To run a report:
Click on the play button at the right end of the report row.
A pop-up appears.
Click on Run Report to generate the report.
Sample Overview report: The device information for this report is the same as
the Overview report, except that it has Overview information for the previous day.
Overview and Social
(For Wi-Fi devices only)
Report showing overview of user and social data for the selected day and the
previous week.
To run a report:
Click on the play button at the right end of the report row.
A pop-up appears.
Select the desired template from the drop-down options below Report Template.
Select the locations for which the report is to be generated by clicking at the LOCATIONS drop-down menu.
If you want to generate the report for each location, check Each Location under Report Parameter.
Select the tags that the report should include by choosing from the drop-down menu under INCLUDETAGS.
Select the tags that the report should exclude by choosing from the drop-down menu under EXCLUDETAGS.
Choose the date of the report under Report Date by
clicking at the calendar icon, or
Entering the date manually in YYYY-MM-DD format.
Click on Run Report to generate the report.
Sample Overview and Social Report: The figure below shows a sample Overview
and Social Report in a PDF format, there are different reports generated for
various zones within the site. Following is a sample report in pdf format.
NOTE: Will provide a link to the entire sample PDF report.
Overview- Period
(For WiFi devices only)
This report contains the Reports showing overview of device and user data for
the selected period.
To run a report:
Click on the play button at the right end of the report row.
A pop-up appears.
Click on Run Report to generate the report.
Sample Overview-Period Report: The report for Overview-period report in a PDF
format is same as that of the ‘Overview’ report as shown above.
Other Information
The other information section provides valuable insights into areas such as the audit log system and the overall health status of KloudInsights.
All security related operations are logged to the database.
Logging
This screen provides control over the application log levels.
System Health
This screen provides an overview of the ‘heath’ of the system including:
Health of the main components.
Version of the application
License Status
Face Recognition System (FRS)
Overview
The Face Recognition System (FRS) is a powerful feature integrated with KloudVision that enables seamless entry and exit to premises using facial recognition technology. This document provides an overview of the registration and instructions on how to customize and utilize it effectively within your system.
It consists of six key steps that ensure optimal performance and functionality.
Step 1: Configure FRS Camera
Before setting up the Facial Recognition System (FRS) in KloudInsights, it’s essential to configure the camera intended for FRS integration. This process is facilitated through KloudVision, enabling seamless setup and alignment of your chosen camera for optimal FRS functionality.
Step 2: Customize FRS Workspace Settings to Suit Your Needs
To make the FRS align with your specific requirements, it is essential to customize the workspace settings. This step allows you to configure various options and features, tailoring the system to your desired specifications. By accessing the FRS workspace settings, you can enable or disable specific functionalities.
Step 3: User Management and Invitation
Efficient user management is critical for the smooth operation of the FRS. This step provides instructions on how to manage users effectively and send invitations for FRS registration. Additionally, the document explains two methods for user invitation:
Bulk FRS Registration: This method allows you to send registration links to multiple users simultaneously. It is particularly useful when onboarding a large number of users.
Individual User Invitation: With this method, you can send personalized invitation links to specific individuals, enabling a more targeted approach to user registration.
Step 4: Face Registration Process for Users
At this stage, users have the opportunity to register their faces using the unique link received in the email invitation. Following the instructions provided, users can seamlessly provide the necessary images for registration. By adhering to these instructions, users can ensure the successful enrollment of their facial data, enabling a smooth and reliable check-in and check-out process within the system.
Step 5: Human Management
As users successfully complete their registration in the FRS (Facial Recognition System), they are automatically added to the Human section. This section serves as a comprehensive repository of all registered users, providing essential information about each individual, including their identity, first name, last name, email ID, tags, namespace, image, ID image, and status.
Step 6: User Check-in and Check-out
During this stage, when a user enters or exits a designated location, their face is automatically detected and matched with the entries in the FRS database. The system records the exact entry and exit times for each user, ensuring accurate check-in and check-out data is maintained. This seamless process not only enhances security measures but also enables efficient monitoring and management of user movements within the specified area.
Step 7: Tracking Check-In and Check-Out Status with the Widget
To efficiently monitor the check-in and check-out activities of users, the FRS provides a widget that displays summarized information. This step guides you on how to utilize the widget effectively. By using the widget, you can track the real-time status of users, view their check-in and check-out times, and quickly identify any discrepancies or unusual patterns. The widget serves as a convenient tool for monitoring and managing user activity, ensuring the smooth operation of the FRS.
To know the camera specifications suitable for face recognition, refer to the System Requirements document.
Step 1: Configure FRS Camera
Facial Recognition System (FRS) functionality within KloudInsights requires configuration of the FRS cameras.
If you’re already a KloudVision user, proceed to log in using your credentials.
If you do not have KloudVision access, contact Kloudspot’s support
team to obtain the necessary access credentials.
Once logged into KloudVision, refer to the FRS configuration document. This document provides detailed instructions on configure the FRS cameras.
Step 2: Customize FRS Workspace Settings to Suit Your Needs
Note: To proceed with these steps, make sure you have access to your KloudInsights account.
Once logged in, navigate to the Configuration menu. You can find it in the menu bar of the KloudInsights dashboard.
From the Configuration menu, select “FRS Settings.” This will open the FRS Workspace Settings page.
On the FRS Settings page, you will see a General Settings section. This section contains six customizable options. Let’s go through each option:
a. Approval needed for Employee Registrations: Enable this option if you want the admin to approve newly registered employees before activating their face ID. If this option is disabled, employee registrations will be automatically activated.
b. Approval needed for Guest Registrations: Enable this option if you want the admin to approve newly registered guests before activating their face ID. If this option is disabled, guest registrations will be automatically activated.
c. ID Card upload needed: If you enable this option, registered users will be prompted to upload their ID card during the face registration process. Face registration will only be activated if the user provides the ID card.
d. Auto check-in: Enable this option if you want registered users to be able to check in to a premise using their face without any physical contact. Enabling this feature allows for a touchless check-in process.
e. Send FRS Self-Registration email for new users: By enabling this option, the FRS Self-Registration email will be automatically sent to newly added users. This email contains instructions and a registration link for users to complete their face registration process.
f. Send Notifications on Face Match: Enabling this option allows you to receive notifications whenever there is a face match in the FRS. This can help you stay informed about potential security events or user activities. Provide the email address in the corresponding field where you want to receive these notifications.
After configuring the desired settings, click on the “Save” button to save the changes you made to the FRS Workspace Settings.
Step 3: User Management and Invitation
Note: Before proceeding, ensure that you have configured the FRS Workspace Settings as per your requirements.
From the menu bar, go to Configuration and select “Users”. This will redirect you to the User Management page.
On the User Management page, you have two options to send the FRS registration links: Bulk FRS Registration and Individual User Invitation.
a. Bulk FRS Registration:
Locate the “Bulk FRS Registration” option on the User Management page.
Click on the option to initiate the process of sending invitation links to all users simultaneously.
This method is useful when you want to send registration links to multiple users at once.
b. Individual User Invitation:
On the User Management page, find the user whom you want to invite for FRS registration.
Locate the FRS registration icon (usually represented by a human symbol) located on the left side of the user’s profile.
Click on the FRS registration icon to access the individual user invitation option.
This method allows you to send personalized invitation links to specific individuals.
Step 4: Face Registration Process for Users
By following below steps, users can successfully complete the face registration process. The provided information and captured images will be used for check-in and Check-out purposes within the system. This enhances the accuracy and reliability of the face recognition system.
Note: Users should have received an invitation email with a registration link before proceeding with the face registration process.
Once users receive the invitation email with the registration link, they should click on the provided link. This will redirect them to the registration page.
On the registration page, users need to provide their personal details. Typically, this includes entering their name and any additional information specified by the system. Fill in the required fields accordingly.
Users may also have the option to add tags that describe their profile or interests. This is an optional step to enhance their profile information.
After providing the required information, users can proceed to the next step by clicking on the “Next” button.
In the registration process, users may be prompted to capture a series of pictures for further verification or identification purposes. Look for a camera icon or similar indication.
Click on the camera icon to initiate the image capture process. Users should take 5 pictures of good quality, ensuring clear and well-lit images.
Once the user has given the images as per the given instructions, they can proceed to the next step by clicking on the “Next” button.
To finalize their registration, users should click on the “Submit” button.
Step 5: Human Management
As users successfully complete their FRS (Facial Recognition System) registration, they are added to the Human section. The Human page serves as a comprehensive repository of registered users, providing essential information about each individual. This includes their identity, first name, last name, email ID, tags, namespace, image, ID image, and status. The Human section plays a vital role in maintaining and organizing user profiles within the FRS. By accessing this page, administrators can effectively manage and monitor registered users, ensuring accurate identification and facilitating seamless interactions within the system.
Human Activation and Deactivation
To activate a user, navigate to “Human” page from the KloudInsights application.
Then, find the corresponding user in the list and click on the Activate button.
To deactivate a user, find the corresponding user in the list and click on the deactivate button.
Activation grants access to the system and its functionalities, while deactivation temporarily restricts access.
Add a New Human
An admin can manually register a user’s face other than through the registration link.
Navigate to the Human page within the KloudInsights.
On the Human page, locate the “New Human” button and click on it. This will open the “Create or edit a Human” popup window.
In the “Create or edit a Human” window, provide the necessary information about the new user. This typically includes identity details, such as first name, last name, and email ID. Fill in the required fields accordingly.
Next, you need to upload images of the user’s face. Click on the “Upload Image” button within the “Create or edit a Human” window. This will open a file selection dialog.
Select the images you want to upload for the user’s face. It is recommended to capture images from at least five different angles to ensure accurate facial recognition. These angles may include front-facing, left profile, right profile, top, and bottom views.
Once you have selected the images, click on the “Save” button to save the new human profile with the associated images.
The system will process the uploaded images and add the new human to the FRS database. The user will now be available for identification and verification through facial recognition.
Human Bulk Upload
This section provides detailed steps to efficiently perform a bulk upload of human profiles in the FRS
(Facial Recognition System). This feature streamlines the registration of multiple users, enhancing the
effectiveness of the FRS within your system. The process consists of three main steps.
Step 1: Collect the User Image
Before initiating the bulk upload process, ensure you have images of individuals from five
different angles for accurate facial recognition.
Save these images in separate folders, with each folder containing images of a specific person.
Consider naming each folder according to the person added to it (e.g., name of the user, email
ID, employee ID, etc.).
Create a common folder where you will consolidate these individual folders.
Step 2: Upload Images to FRS Human Page
Log in to your KloudInsights account and navigate to the Humans page.
On the Humans page, locate the “Upload” button and click on it to open the “Upload Images”
popup window.
In the “Upload Images” popup window, click on the “Choose file” button and navigate to the
common folder where you have saved the individual image folders.
Select the common folder, which contains the individual folders named after the respective
individuals.
In addition to image upload, provide additional details for the bulk upload. Select the
appropriate “namespace” and “tag” that you want to assign to the uploaded human profiles.
In the “Type” field, select the “Known Humans” option to indicate that these individuals are
already known, and their profiles should be created based on the uploaded images.
Click on the “Upload” button to initiate the bulk upload process. The system will process the
images and create individual human profiles.
Step 3: Upload a CSV File with Information
After adding the required images to FRS, proceed to upload the CSV file containing additional
metadata.
Click on the “Upload CSV” button from the Humans page. In the Upload Metadata popup
window that opens, click the “Download a sample CSV” button to download the sample CSV
file.
Populate the CSV file with the required information:
a. Add first name, last name, full name, email Address, tags, and namespace in their
respective columns.
b. Enter the unique folder name (where the user’s image has been added) in the identity
column.
Save this CSV file. Upload the CSV file by clicking the “Choose File” button in the Upload
Metadata popup window.
The information provided in the CSV file will be associated with the uploaded images.
The FRS will utilize this information for recognition. When individuals in the uploaded images are
detected by the camera, their entry and exit will be recorded.
Step 6: User Check-in and Check-out
There are three methods available for users to perform check-in and check-out. To know the camera specifications suitable for face recognition, refer to the System Requirements document.
Check-in and check-out using the kiosk.
Check-in and check-out using the camera.
Seamless entry and exit.
Check-in and check-out using the kiosk.
Note: Ensure that the kiosk or tablet is properly set up and connected to the FRS system before proceeding with the check-in and check-out process.
Position the kiosk or tablet at the entry gate where users will perform the check-in and check-out process.
Prompt the user to stand in front of the kiosk or tablet, ensuring that their face is properly positioned within the camera’s view.
The FRS system will automatically scan the user’s face and compare it with the faces in the FRS database to find a match.
If the user’s face matches a face in the FRS database, it indicates a successful match, and the check-in process can proceed. If there is no match, the user may not be registered in the system or may need further verification.
To perform the check-in process, instruct the user to tap on the check-in button displayed on the kiosk or tablet’s interface.
Once the user taps the check-in button, the system will record the check-in time and update the user’s check-in status accordingly.
For the check-out process, instruct the user to tap on the check-out button displayed on the kiosk or tablet’s interface.
When the user taps the check-out button, the system will record the check-out time and update the user’s check-out status accordingly.
Check-in and check-out using the camera.
Users can easily perform check-in and check-out using a camera installed at the entry gate, integrated with the FRS.
Install the camera at the entry gate in a position that allows it to capture the faces of users as they approach.
Ensure that the camera is connected to the FRS system and properly configured to perform facial recognition.
When a user comes in front of the camera, the camera will automatically scan their face.
The FRS system will compare the scanned face with the faces stored in the FRS database to find a match.
If the user’s face matches a face in the FRS database, it indicates a successful match, and the check-in process can proceed. If there is no match, the user may not be registered in the system or may need further verification.
If an auto-open door or other security system is installed, it can be triggered at this point to allow access for the checked-in user.
The FRS system will record the check-in time and update the user’s check-in status accordingly in the system.
Similarly, for the check-out process, instruct the user to approach the camera again to have their face scanned.
Once the user’s face has been scanned, the FRS system will compare it with the faces stored in the FRS database to find a match.
The FRS system will record the check-out time and update the user’s check-out status accordingly in the system.
Seamless entry and exit.
Users can achieve seamless entry and exit using cameras placed at the entry gate and exit gate.
Place cameras at both the entry gate and exit gate in positions that allow users to capture their faces as they approach.
Ensure that the cameras are connected to the FRS system and properly configured for facial recognition.
As a user approaches the entry gate, the camera placed there will automatically scan their face.
The FRS system will compare the scanned face with the faces stored in the FRS database to find a match.
If the user’s face matches a face in the FRS database, it indicates a successful match, and the check-in process can continue.
In this case, there is no need for a security check or any other obstacles. The user can check in seamlessly.
The FRS system will record the check-in time and update the user’s check-in status accordingly in the system.
Similarly, when the user approaches the exit gate, the camera placed at the exit gate will automatically scan their face.
The FRS system will compare the scanned face with the faces stored in the FRS database to find a match.
If a match is found, it indicates a successful match for check-out.
The FRS system will record the check-out time and update the user’s check-out status accordingly in the system.
Step 7: Tracking Check-In and Check-Out Status with the Widget
To efficiently monitor and view the check-in and check-out status of all users, a dedicated widget is available. The widget offers a convenient and summarized display of users’ check-in and check-out information. Below is an example of how the widget might appear:
For guidance on creating a dashboard and adding a widget to it, refer to the “Creating Dashboards” document.
The widget showcases essential details, such as usernames, identity, direction, Time, and location. With this simplified presentation, administrators can easily track user movements and identify any anomalies or discrepancies.
KloudBot
KloudBot, the latest addition to our suite of tools, revolutionizes how you access and interact with Kloudspot’s advanced analytics and insights. Seamlessly integrated with Microsoft Teams, KloudBot brings real-time information about device locations, points of interest, footfall summaries, and dwell time directly to your fingertips. Whether you’re a team manager, project overseer, or simply need to stay in the loop with your organization’s operations, KloudBot empowers you to make informed decisions swiftly and efficiently. Discover a new level of efficiency and clarity in your workflows with KloudBot.
1. Once logged in to Microsoft Azure. Search for Azure Bot in the search bar on the home page.
2. Select the Azure Bot option from the search result.
3. Then fill in the information in the window that opens as shown in the
picture and click the Review + create button.
4. You can select a resource group location according to your location.
5. On the next page, make sure the information entered is correct and click
the Create button.
6. After a short loading, you will get the message your deployment is
complete.
7. Then click on Go to resource button to open the resource.
8. Then add an Icon in the Bot profile menu and click Apply button.
9. Then go to the Configuration menu and fill in all the information.
Messaging endpoint: This is the URL from Kloud insights. Now leave it
blank. Check the Configure the KloudBot in KloudInsights. section to know more
about this.
10. Then click on the Manage button. It will guide you to the
certificates and secret page. Here you can create a new client secret.
11. The App ID will be generated automatically in the Microsoft App ID
column.
Note: The App ID will need to be entered into KloudInsights later, so
copy and paste it somewhere for later use.
12. Create a new client secret by clicking on the +New Client secret
button.
13. Then enter a description and choose an expiry month. Then press
the Add button.
14. New client secret is created successfully.
15. Then copy the Value from the new client secret and paste it somewhere
else for later use.
16. Next click on the Add OAth Connection Settings.
17. On the new connection settings page that opens, enter the Name and
select Azure Active Directory v2 as the service provider.
18. Copy and paste the Client ID and Client secret received while
registering the app here. Client ID and Client secret are obtained from the
App. Check the Register an App section to know how to get it.
19. Tenant Id will be common.
20. Copy and paste the following scopes in the scope column.
5. Application (Client) ID can be obtained from the window that opens
immediately after registration. Copy it and paste it somewhere for later use.
Create a new client secret
1. Next, we need the client secret, for that, navigate to Certificates and secrets > + New client secret.
2. Then enter a description and choose an expiry month. Then press
the Add button.
3. Then copy the Value from the window that opens and paste it somewhere
else for later use. This is the secret key.
Add an API permission
1. Next, API permissions should be given to the application by navigating to API permissions > +Add a permission > Microsoft graph.
2. Under the Delegated permissions window, allow all the permissions in the
OpenId permissions, calendars, chat, and contacts sections as shown in the
figure.
3. Then click on the Add permissions button.
Set App Id URI
1. Click the Set button from the Expose an API window to generate the App ID URI.
2. Click the Save button to save the Application ID URI.
Add a scope
1. Navigate to Expose an API > +Add Scope to add a new Scope. Then fill the Add a scope window as shown in the figure. Then click the add scope button to save the scope.
Configure the KloudBot in KloudInsights.
1. log in to KloudInsights and Navigate to settings >API Keys.
2. In the API Keys window that opens, click on the +New API Key button.
3. In the popup window, select Administrator from the Role list and click
the Add Key button.
4. New ID and Secret key are created. Then copy the ID and Secretkey from the API Keys and paste it somewhere else for later use.
5. Then navigate to Configuration > Integrations > Applications.
6. Scroll down and find the Teams App Settings.
7. Enter the Name, Language, and connection name and select the
capabilities.
8. You can select capabilities based on requirements.
9. Enter the Microsoft App ID and secret ID obtained when the Azure bot
was created in the Bot Id and Bot password columns. Refer Create an Azure
bot section for more details
10. Enter the ID and secret Key obtained from the API Keys in the API
Client ID and API client Secret columns.
11. Finally click on the Save button to save changes.
12. Immediately you will get the messaging endpoint URL.
13. Return to the Azure portal and paste the messaging endpoint URL into the
Messaging endpoint column.
14. Click the Apply button to save the changes.
15. Then go to the Test In Web Chat menu and check that the app is
working properly.
16. If the app is working properly, the next step is to integrate it into the
teams app.
17. To do so, navigate to Channels menu and Select the Web Chat
option from the channel list that opens.
Note: If you are opening the Channel menu for the first time, the Web
Chat Channel will be in the Available channels list.
18. Select the Default Site option. Then, in the new window, check the
Enable Preview and Block attachment upload from user checkboxes then
click the Apply button.
19. Return to the Channel menu and click on the Microsoft Teams
channel.
20. Immediately the terms of service popup window will open, check the
checkbox, and click the Agree button.
21. In the window that opens, on the Messaging tab, check the Microsoft
Teams commercial(most common) check box and click the Apply button.
22. Your application is successfully integrated into Teams App.
Add KloudBot to Teams App
1. First, download the app from KloudInsights. For that. Login to the KloudInsights.
2. Then navigate to Configuration > Integrations > Applications.
3. Scroll down and find the Teams App Settings.
4. Download the App by clicking the Download App button.
5. Then open teams App and navigate to Apps > Manage your apps > Upload an
app.
6. Select Upload a custom app option and then upload the App downloaded
from Insights.
7. Your app has been successfully added to Teams
KloudBot User Guide
Introduction
With Kloudspot, you can now easily access real-time information about device
locations, points of interest, footfall summaries, and dwell time summaries
through your Microsoft Teams app, whether you are using it on your mobile
device or on the web. This integration allows you to interact with Kloudspot’s
advanced analytics and insights directly from your Teams platform, enabling
you to make informed decisions quickly and efficiently. Whether you’re
managing a team, overseeing a project, or simply need to stay up-to-date with
your organization’s operations, this integration offers a seamless way to
access valuable data and insights.
Find My Kloudspot
1. Open the Teams app.
2. Click the more button from the menu bar.
3. The Popup window will open with the search bar.
4. Search for My Kloudspot and click on It.
5. My Kloudspot window will open.
6. Click Add button to add the My Kloudspot.
7. My Kloudspot Analytics Bot is successfully added to the Teams app.
Getting started
1. As soon as you add KloudBot, a window will open with the key information.
2. You can click on each button to learn about what are the keywords under the function.
Note:User search and Upcoming Meetings are not clickable, check
the Get information about a User and Get Upcoming Meetings details sections
for how to use this.
Find
1. Click on the Find Button.
2. A popup button will open with more information. The find command is used to find someone with the help of the Device he uses.
Commands
Use
Find < Name>
You can locate a device on a map for example: find john : Gives the last known location of the devices that match the keyword ‘john’
AP Status
1. Click AP Status.
2. A popup button will open with more information. This gives you a list of currently available APs and their status.
Commands
Use
apstatus
Gives a list of all APs along with their statuses
apstatus up
Gives a list of all APs that are currently up
apstatus down
Gives a list of all APs that are currently down
apstatus
Gives the status of a particular AP
Location
1. Click on Location.
2. This gives you information about Location List, Footfall, Dwell time, heatmap, user chat, footfall calendar, path distribution, outbound traffic, inbound traffic, dwell time chart, repeat user chart, camera demographics chart, camera occupancy chart, live feed, and the rest.
Commands
Use
location
Gives a list of all locations in the system
location list
Gives a list of all locations in the system
location show
Gives a list of all locations in the system
location print
Gives a list of all locations in the system
location 1
Gets information about the 1st location in the list
location 1 footfall
Get the last 5 mins footfall information for the 1st location in the list
location 3 dwelltime
Get today’s average dwell time for the 3rd location in the list
location 3 heatmap
Get the heatmap for the given location (typically used for floors)
location 3 userchart
Displays a chart that shows the guest and connected device counts at the location
location 3 footfallcalendar
Displays a calendar view of the device counts by day
location 3 pathdistribution
Displays the traffic flow from each zone to all the other zones at a given location
location 3 outboundtraffic
Displays the outbound traffic flow at a given location
location 3 inboundtraffic
Displays the inbound traffic flow at a given location
location 3 dwelltimechart
Displays a chart that shows the average dwell times of all the zones within the selected location
location 3 repeatuserchart
Displays a chart displaying the count of repeat users on a per-zone basis at any location
location 3 camerademographicschart
Displays a chart of demographics captured by KloudVision Cameras
location 3 cameraoccupancychart
Displays camera-based occupancy metrics at a given location
location 3 livefeed
Shows a real-time snapshot of the feed from the camera at the given location
Find a device
1. In the chat box, type the keyword of the device you want to find along with the find command. Waite for some seconds.
For example: Find Ravi
2. The last active location of the device with the keyword we entered will be
displayed in the chat as a map.
3. Click on the More Details button to get more details about the
location.
4. To find out who is likely to come into contact with that person, click the
Contact Tracing button.
Get AP Status
Find AP list with the status
1. To get the full list and status of available APs, enter the command apstatus in the chat box and hit the enter key.
2. A list of current APs will be sent in reply.
3. Click on the Ap status up button to get a list of APs that are
currently Up.
4. Click on the Ap status Down button to get a list of APs that are currently
down.
Find AP list with the UP status.
1. To get information about the APs currently in UP status, type the command apstatus up in the Chat box and hit enter key.
2. A list of APs in up status will be sent in reply.
3. Click on the Ap Status Up button to get a list of APs that are
currently Up.
4. A popup window will appear with the MAC number of the currently active
access points and the last time the information was collected.
Find AP list with the Down status
1. To get information about the APs currently in down status, type the command apstatus down in the Chat box and hit enter key.
2. A list of APs in down status will be sent in reply.
3. Click on the Ap Status down button to get a list of APs that are
currently down.
4. A popup window will appear with the MAC number of the currently inactive
access points and the last time the information was collected.
Find the status of a specific AP.
1. To know the status of a particular access point, enter the command ( apstatus )> MAC address in the chat box and hit the enter key.
For example:apstatus 00:04:56:a6:5c:25
2. status will be sent in reply.
3. Click on the Ap Status Up button to get the MAC number and the last
time the information was collected.
Get information about a Location.
Get location list.
1. To get a list of available locations, enter any of the following commands in the chat box and hit Enter key.
location
location List
location show
location print
2. Available locations and their number will be available as a replay for the
chat.
Get information about a specific location.
1. Type location > location number to get information about a specific location.
For example:- location 1 (In this case, to get information about Sunnyvale
location, use its serial number 1)
2. Location information will be available as a replay for the chat.
Get footfall information.
1. Type location > location number> footfall to get Footfall information about a specific location.
For example:- location 1 footfall
Note: Provides footfall information for the last 5 min at a specific
location.
2. Information will be available as a replay for the chat.
Get dwell time information
1. Type location > location number>dwelltime to get dwell time information about a specific location.
For example: - location 3 dwelltime
Note: Get today’s average dwell time for the 3rd location in the list.
2. Information will be available as a replay for the chat.
Get heatmap
1. Type location > location number>heatmap to get heatmap for a specific location.
For example: - location 1 heatmap
Note: Get the heatmap for the given location (typically used for floors).
2. Information will be available as a replay for the chat.
3. Click the More Detail button for more information.
4. To display information to the nearest display terminal, click on the
Publish on Display Terminal button in the popup window that opens.
5. Then select the display.
Get user chart
1. Type location > location number>userchart to get a user chart for a specific location.
For example: - location 1 userchart
Note: Displays a chart that shows the guest and connected device counts
at the location.
2. Information will be available as a replay for the chat.
3. Click the More Detail button for more information.
4. To display information to the nearest display terminal, click on the
Publish on Display Terminal button in the popup window that opens.
5. Then select the display.
Get footfall calendar
1. Type location > location number>footfallcalendar to get footfall calendar for a specific location.
For example: - location 1 footfallcalendar
Note: Displays a calendar view of the device counts by day.
2. Information will be available as a replay for the chat.
3. Click the More Detail button for more information.
4. To display information to the nearest display terminal, click on the
Publish on Display Terminal button in the popup window that opens.
5. Then select the display.
Get path distribution
1. Type location > location number>pathdistribution to get path distribution for a specific location.
For example: - location 1 pathdistribution
Note: Displays the traffic flow from each zone to all the other zones at
a given location.
2. Information will be available as a replay for the chat.
3. Click the More Detail button for more information.
4. To display information to the nearest display terminal, click on the
Publish on Display Terminal button in the popup window that opens.
5. Then select the display
Get outbound traffic
1. Type location > location number>outboundtraffic to get outbound traffic for a specific location.
For example: - location 1 outboundtraffic
Note: Displays the outbound traffic flow at a given location.
2. Information will be available as a replay for the chat.
3. Click the More Detail button for more information.
4. To display information to the nearest display terminal, click on the
Publish on Display Terminal button in the popup window that opens.
5. Then select the display.
Get inbound traffic
1. Type location > location number>inboundtraffic to get inbound traffic for a specific location.
For example: - location 1 inboundtraffic
Note: Displays the inbound traffic flow at a given location.
2. Information will be available as a replay for the chat.
3. Click the More Detail button for more information.
4. To display information to the nearest display terminal, click on the
Publish on Display Terminal button in the popup window that opens.
5. Then select the display.
Get dwell time chart
1. Type location > location number>dwelltimechart to get dwell time chart for a specific location.
For example: - location 1 dwelltimechart
Note: Displays a chart that shows the average dwelltimes of all the zones
within the selected location.
2. Information will be available as a replay for the chat.
3. Click the More Detail button for more information.
4. To display information to the nearest display terminal, click on the
Publish on Display Terminal button in the popup window that opens.
5. Then select the display.
Get repeat user chart
1. Type location > location number>repeatuserchart to get repeat user chart for a specific location.
For example: - location 1 repeatuserchart
Note: Displays a chart showing the number of repeat users per zone at any
location.
2. Information will be available as a replay for the chat.
3. Click the More Detail button for more information.
4. To display information to the nearest display terminal, click on the
Publish on Display Terminal button in the popup window that opens.
5. Then select the display.
Get camera demographics chart
1. Type location > location number>camerademographicschart to get camera demographics chart for a specific location.
For example: - location 1 camerademographicschart
Note: Displays a chart of demographics captured by KloudVision Cameras.
2. Information will be available as a replay for the chat.
3. Click the More Detail button for more information.
4. To display information to the nearest display terminal, click on the
Publish on Display Terminal button in the popup window that opens.
5. Then select the display.
Get camera occupancy chart
1. Type location > location number>cameraoccupancychart to get camera occupancy chart for a specific location.
For example: - location 1 cameraoccupancychart
Note: Displays camera-based occupancy metrics at a given location.
2. Information will be available as a replay for the chat.
3. Click the More Detail button for more information.
4. To display information to the nearest display terminal, click on the
Publish on Display Terminal button in the popup window that opens.
5. Then select the display.
Get live feed
1. Type location > location number>livefeed to get live feed for a specific location.
For example: - location 1 livefeed
Note: Shows a real-time snapshot of the feed from the camera at the given
location.
2. Information will be available as a replay for the chat.
3. Click the More Detail button for more information.
4. To display information to the nearest display terminal, click on the
Publish on Display Terminal button in the popup window that opens.
5. Then select the display.
Get information about a User
1. If you want to search for a user’s information, type the user’s name in the chat box and hit enter key.
2. The user card with the user’s information will be available as a replay for the chat immediately.
3. You can also contact that person by clicking on the call or chat button.
4. Click on the More Details button to know the user’s mail Id and
location.
Get Upcoming Meetings details
1. To get the details about upcoming meetings, enter the command upcoming meetings the chat box and hit the enter key.
2. Upcoming meeting details will be sent as the replay for the chat.
3. Click the Join Meeting button to join the meeting.
Kloud Insights FAQs
What is KloudInsights?
KloudInsights is a powerful platform that provides real-time insights and analytics for various data sources, enabling users to make informed decisions based on the gathered information.
How can I access KloudInsights?
You can access KloudInsights through a web browser by logging into your account.
What are Dashboards in KloudInsights?
Dashboards in KloudInsights are customizable data views that allow users to visualize and analyze data in a way that is most meaningful to them.
How do I create a Dashboard?
To create a Dashboard, navigate to the side menu section and click on the ‘+’ icon. Enter the name and customize it according to your preferences.
What are Rules and Actions in KloudInsights?
Rules in KloudInsights allow you to set conditions that trigger specific actions. For example, sending a notification when a certain event occurs.
How can I set up a Rule in KloudInsights?
To set up a Rule, go to the Rules section, click on ‘Create a rule’, and define the conditions, actions, and triggers for the rule.
What types of Reports can I generate in KloudInsights?
KloudInsights allows you to generate PDF or CSV Reports. These reports can provide detailed insights into various aspects of your data.
How do I schedule a Report in KloudInsights?
To schedule a Report, go to the Reports section, click on ‘Scheduled’, then ‘New Report’. Define the parameters, recipients, and schedule for the report.
Can I customize my User Settings in KloudInsights?
Yes, you can customize your User Settings, including your email address and password, to tailor your experience on the platform.
How do I provide feedback or report bugs in KloudInsights?
You can provide feedback or report bugs directly to the product team through the platform. Use the dedicated button at the top right of the screen.
Where can I find documentation and access keys for the REST API in KloudInsights?
You can find documentation and access keys for the REST API in the User Settings section under ‘API Documentation’.
How do I log out of my KloudInsights account?
To log out, simply click on the ‘Logout’ button located at the top right corner of the screen.
What information can I access in the Information section of KloudInsights?
The Information section provides access to system-related data, such as audit logs and other relevant information about the platform.
What can I do in the Configuration section of KloudInsights?
In the Configuration section, you can customize various settings related to your KloudInsights account, including system preferences and data sources.
How do I navigate back to the main overview page in KloudInsights?
To return to the main overview page, simply click on the ‘Home’ option in the side menu.
Can I access online documentation for KloudInsights?
Yes, you can access the online documentation by clicking on the ‘Access to on-line documentation’ button at the top right of the screen.
What does the Notification button do in KloudInsights?
The Notification button allows you to receive timely alerts and updates based on the rules and conditions you’ve set up in the platform.
Is there a way to view the history of generated reports in KloudInsights?
Yes, you can view the history of generated reports in the Reports section. This provides a record of all previously generated reports.
What are Classifiers in KloudInsights and how do they work?
Classifiers help categorize datasets based on specific conditions. They can be configured to identify and label data for easier analysis.
Can I customize the widgets on my Dashboard in KloudInsights?
Yes, you have the ability to add, edit, and arrange widgets on your Dashboard to display the information that is most relevant to you.
How do I access system information, such as audit logs, in KloudInsights?
You can access system information, including audit logs, in the Information section. This provides transparency into platform activities and events.
Events Management
Step 1: Creating a User for Kloudspot Event Management.
Make sure you’ve completed KloudInsights Setup before continuing to this
section. In order to enable event management, we first need to create an admin
user under your account. To do this, follow the steps found at
https://documentation.kloudspot.com/help/user-management and create your
user hierarchy.
Step 2: Creating an event
Once you have created a user, head to your event management URL and login with
that admin users credentials. If you login successfully, you’ll be brought to
a screen resembling the one below.
Click on the “Event Management” icon to be taken to the management dashboard.
It should take you to a dashboard similar to the one below. Here, you will see
a list of your past events, current events, and future events. It will also
display their location, along with some actions that we will go over in the
Step 3: Actions with an event.
To create an event, we want to click on the “create event” option on the
bottom right corner of the screen.
Name: Name of the event, such as “Frankfurt Motor Show”. This is visible to clients.
Notes: Notes about the event, these are not visible to clients.
Users: Allows you to define users that have administrative access to the event.
Site: Select the site, floor, and timezone that the event is taking place.
We will then proceed to the “Dates” tab.
Select a start date, as well as how many days you would like to record data
at the event.
Select each date of the event, as well as a timeframe that you’d like to
collect data. The green section defines the timeframe where data will be
collected
We will then proceed to the “Customers” tab.
Give each of your customers a name (this is visible to the customer), notes
about them (this is not visible to the customer), and select the ‘zones’ that
you would like data to be collected and reported on to that customer. Zones
can be used for multiple customers if they have shared spaces.
Finally, we will proceed to the “Settings” tab.
Minimum Dwell time: Minimum time a person must remain within a given zone to be recorded as an “interested” client.
Maximum Dwell: Maximum time a person can remain within a given zone to be recorded as an “interested” client. This is used to filter out employees/event staff.
Analysis Period: The intervals for which analysis of given zones will be completed and recorded upon. A shorter analysis period means more specific data, but much longer spreadsheets.
Multiplier: Multiplies all data read by this amount, useful if we have blind spots or some other issue causing a minor loss of persons.
After clicking “Submit” at the end of this step, our event will show up on the
dashboard and it will begin collecting and reporting data.
Step 3: Actions with an event
The first option, the blue graph, will take you to a live dashboard view of
the event site.
This event site dashboard will show you all cameras on a specific site and
floor, along with their status. You can also select the “Live View” tab to be
brought to a live view of the site and floors data.
The next button simply generates a report for the given event, or recreates
the event report should one already exist.
The final button simply deletes an event, AND ALL DATA ASSOCIATED WITH THAT
EVENT. Make sure to generate a report before deleting an event.
You may also click on any event to open a dropdown displaying all of the
customers and their unique event token that they may use to access their event
report if it has been generated.
Step 4: Event reporting
At the event dashboard, there is also an “Event Reports” tab. Selecting that
tab will bring you to the event report dashboard.
Here you will see a list of all reports, along with the start date, duration,
and location that the event took place. You also have 2 options along with it.
The red trashcan deletes the report, and the blue button creates a copy of the
report.
To access the data within a report and to give your clients a dashboard of
their own, simply click on the respective event report. This will open a
dropdown containing all of the data.
Here, you will see a list of all customers, their unique event token, the last
time their event dashboard was accessed, the amount of times they have
accessed it, as well as the option to open their dashboard as an admin, copy
the link address to their dashboard, and view their event report spreadsheet.
Step 5: Understanding the customer dashboard
Once your customer receives their unique event token, they may go to your
event url and put that token into the access token login option.
Upon entering a proper event token, they will be taken to the customer
dashboard.
The “Live view” tab offers them a live view of their event space, along with
all of the data associated with it.
The “Summary” tab gives a full historical summary of the event space, along
with all data associated with it. It also has the option to directly download
their respective spreadsheet.
The “Statistics” tab offers a comprehensive view of all relevant statistics
regarding their event space and the data associated with it across any
combination of days and cameras.
The “Zone Density” tab shows the population density of each zone across the
entire event, by day, or an animation showing density across 15 minute or hour
long intervals over a specific day.
The final tab, the “Movement” tab, shows the movement of persons’ across the
given time period, with the option to filer out areas of less movement.