Events Management
Step 1: Creating a User for Kloudspot Event Management.
Make sure you’ve completed KloudInsights Setup before continuing to this section. In order to enable event management, we first need to create an admin user under your account. To do this, follow the steps found at https://documentation.kloudspot.com/help/user-management and create your user hierarchy.
Step 2: Creating an event
Once you have created a user, head to your event management URL and login with that admin users credentials. If you login successfully, you’ll be brought to a screen resembling the one below.
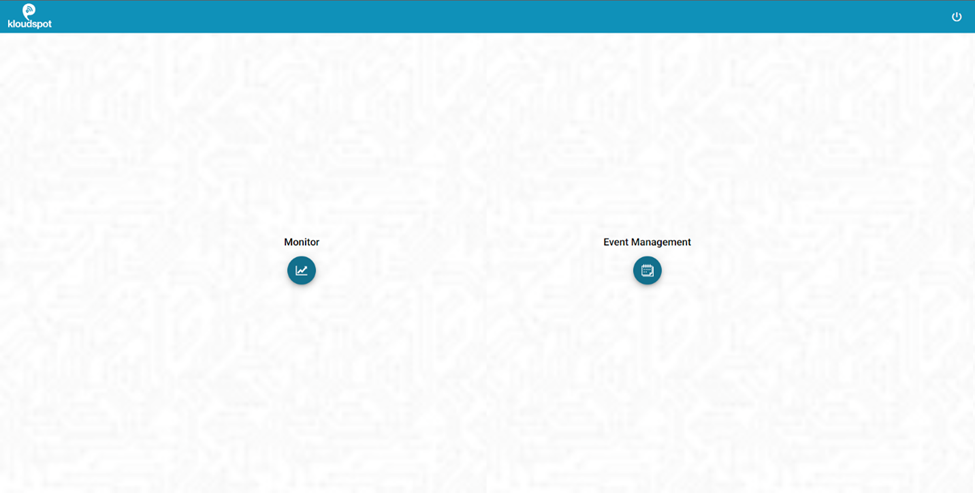
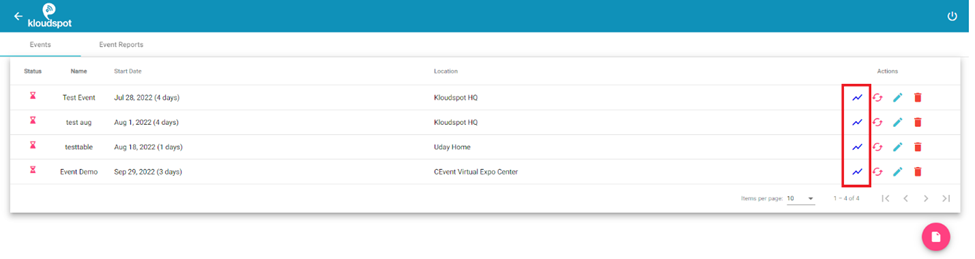
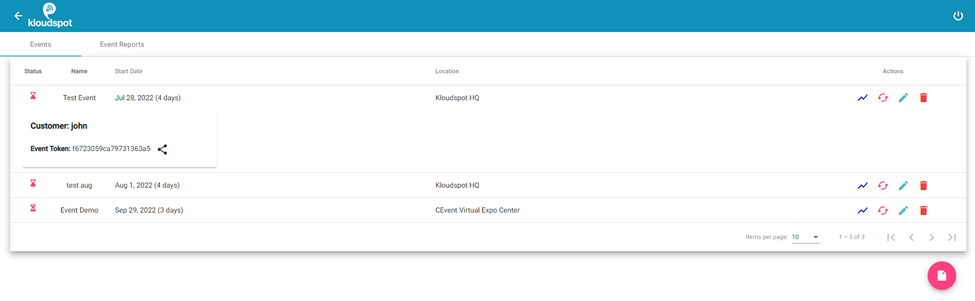
Click on the “Event Management” icon to be taken to the management dashboard. It should take you to a dashboard similar to the one below. Here, you will see a list of your past events, current events, and future events. It will also display their location, along with some actions that we will go over in the Step 3: Actions with an event.
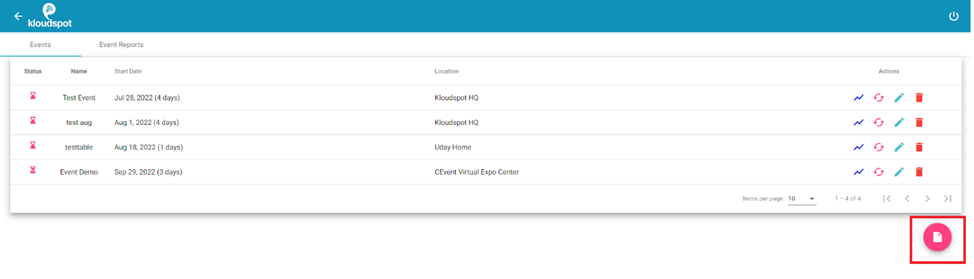
To create an event, we want to click on the “create event” option on the bottom right corner of the screen.
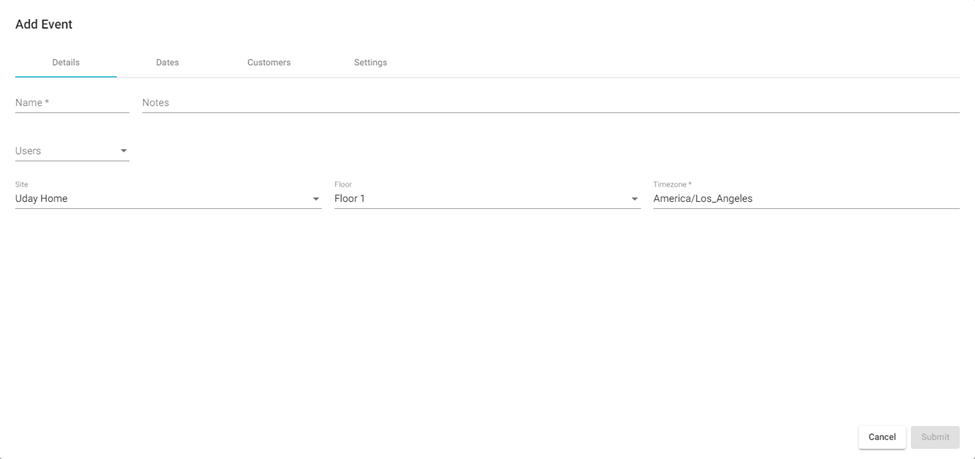
- Name: Name of the event, such as “Frankfurt Motor Show”. This is visible to clients.
- Notes: Notes about the event, these are not visible to clients.
- Users: Allows you to define users that have administrative access to the event.
- Site: Select the site, floor, and timezone that the event is taking place.
We will then proceed to the “Dates” tab.
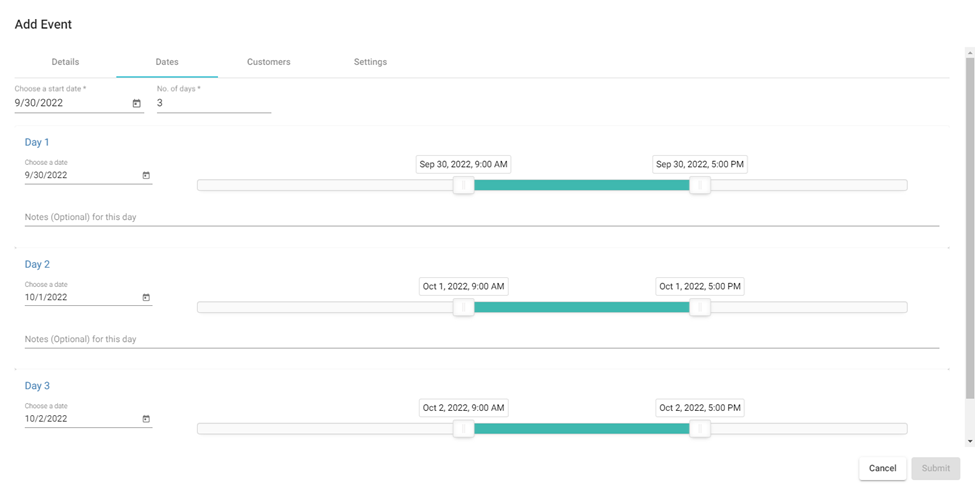
Select a start date, as well as how many days you would like to record data at the event.
Select each date of the event, as well as a timeframe that you’d like to collect data. The green section defines the timeframe where data will be collected
We will then proceed to the “Customers” tab.
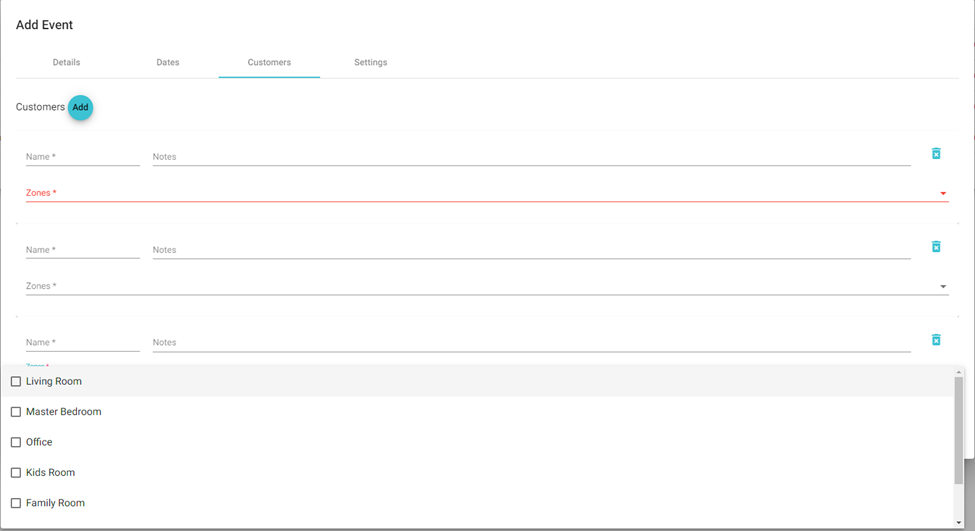
Give each of your customers a name (this is visible to the customer), notes about them (this is not visible to the customer), and select the ‘zones’ that you would like data to be collected and reported on to that customer. Zones can be used for multiple customers if they have shared spaces.
Finally, we will proceed to the “Settings” tab.
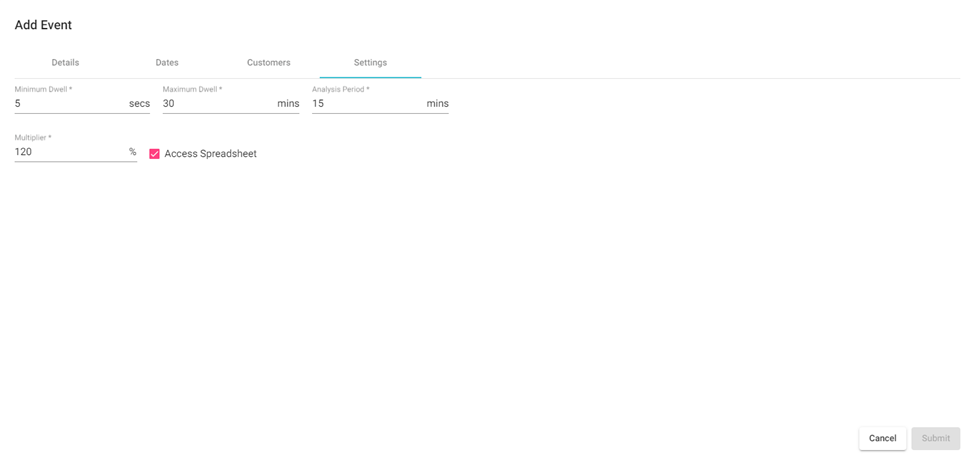
- Minimum Dwell time: Minimum time a person must remain within a given zone to be recorded as an “interested” client.
- Maximum Dwell: Maximum time a person can remain within a given zone to be recorded as an “interested” client. This is used to filter out employees/event staff.
- Analysis Period: The intervals for which analysis of given zones will be completed and recorded upon. A shorter analysis period means more specific data, but much longer spreadsheets.
- Multiplier: Multiplies all data read by this amount, useful if we have blind spots or some other issue causing a minor loss of persons.
After clicking “Submit” at the end of this step, our event will show up on the dashboard and it will begin collecting and reporting data.
Step 3: Actions with an event
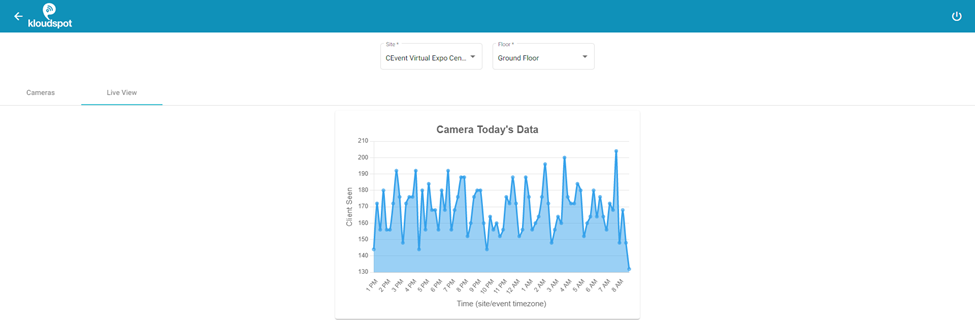
The first option, the blue graph, will take you to a live dashboard view of the event site.
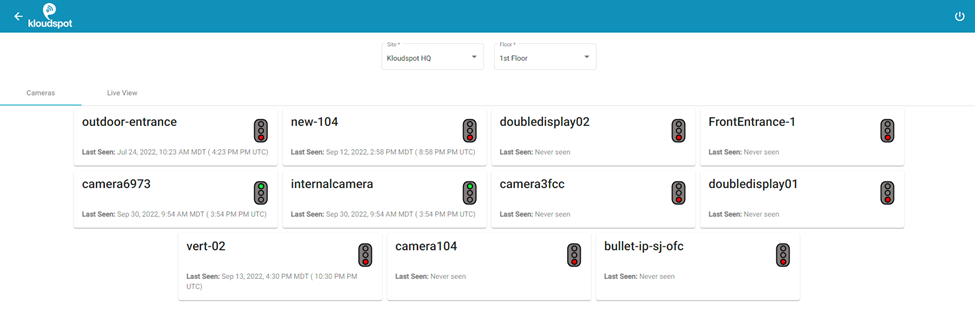
This event site dashboard will show you all cameras on a specific site and floor, along with their status. You can also select the “Live View” tab to be brought to a live view of the site and floors data.
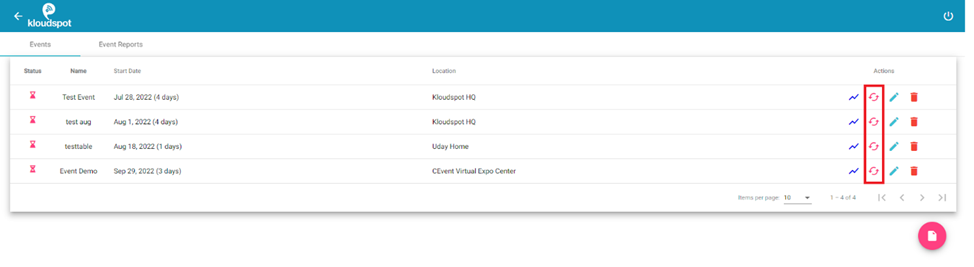
The next button simply generates a report for the given event, or recreates the event report should one already exist.
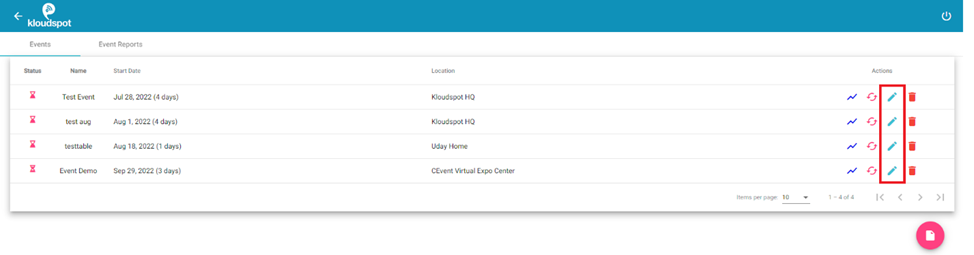
The next button allows you to edit all event data that we create at Step 2: Creating an event.
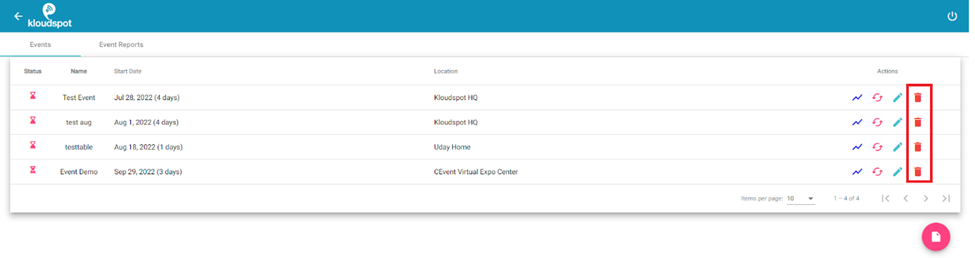
The final button simply deletes an event, AND ALL DATA ASSOCIATED WITH THAT EVENT. Make sure to generate a report before deleting an event.
You may also click on any event to open a dropdown displaying all of the customers and their unique event token that they may use to access their event report if it has been generated.
Step 4: Event reporting
At the event dashboard, there is also an “Event Reports” tab. Selecting that tab will bring you to the event report dashboard.
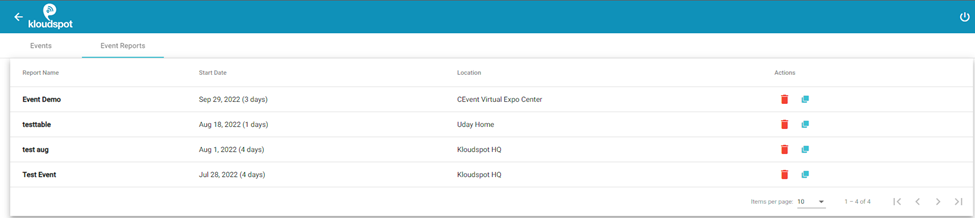
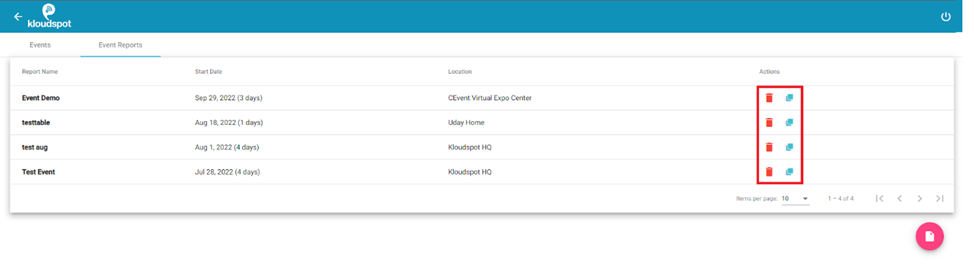
Here you will see a list of all reports, along with the start date, duration, and location that the event took place. You also have 2 options along with it. The red trashcan deletes the report, and the blue button creates a copy of the report.
To access the data within a report and to give your clients a dashboard of their own, simply click on the respective event report. This will open a dropdown containing all of the data.
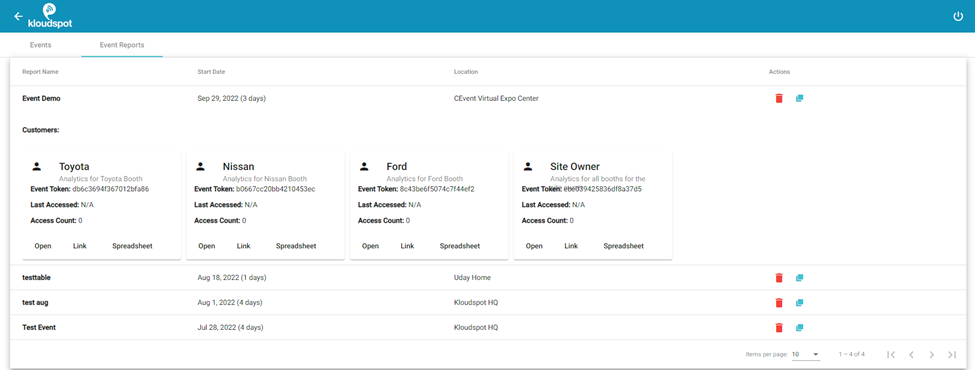
Here, you will see a list of all customers, their unique event token, the last time their event dashboard was accessed, the amount of times they have accessed it, as well as the option to open their dashboard as an admin, copy the link address to their dashboard, and view their event report spreadsheet.
Step 5: Understanding the customer dashboard
Once your customer receives their unique event token, they may go to your event url and put that token into the access token login option.
Upon entering a proper event token, they will be taken to the customer dashboard.
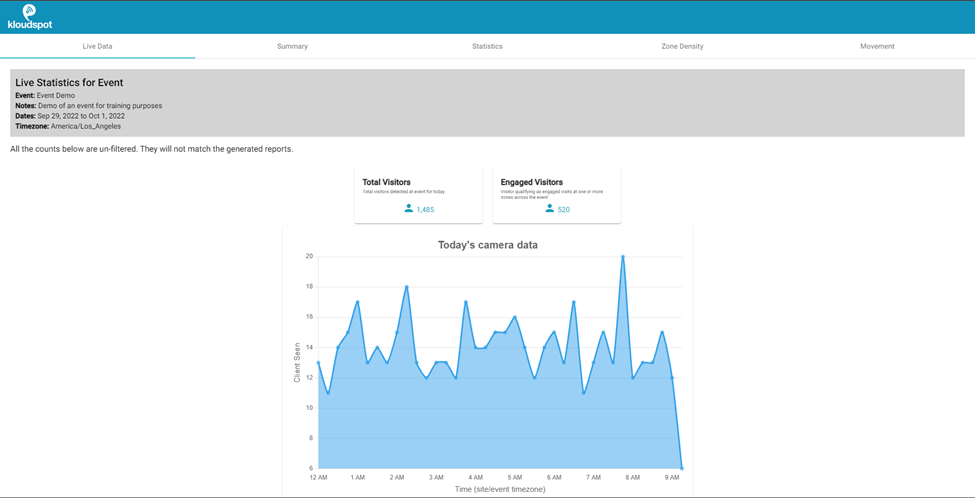
The “Live view” tab offers them a live view of their event space, along with all of the data associated with it.
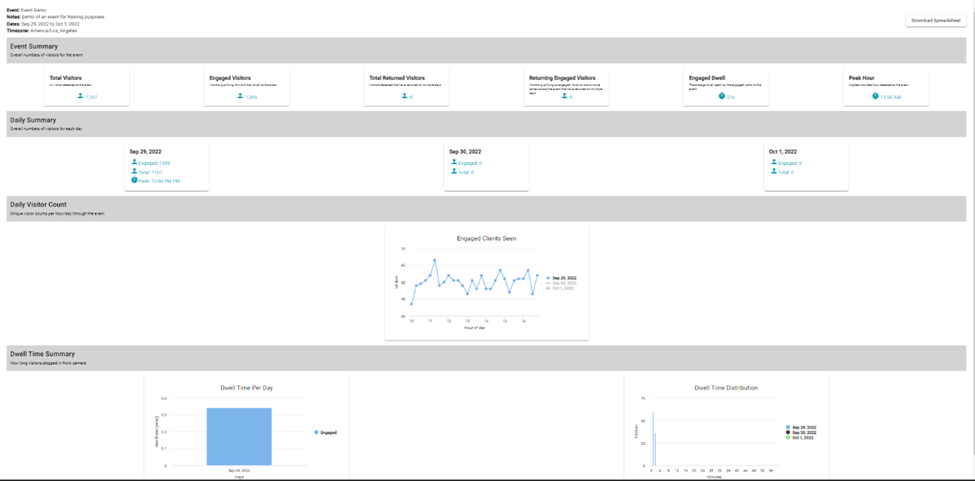
The “Summary” tab gives a full historical summary of the event space, along with all data associated with it. It also has the option to directly download their respective spreadsheet.
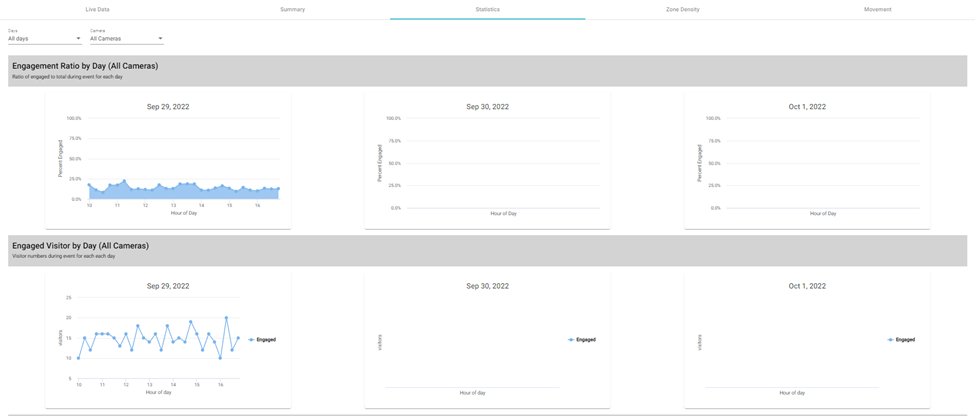
The “Statistics” tab offers a comprehensive view of all relevant statistics regarding their event space and the data associated with it across any combination of days and cameras.
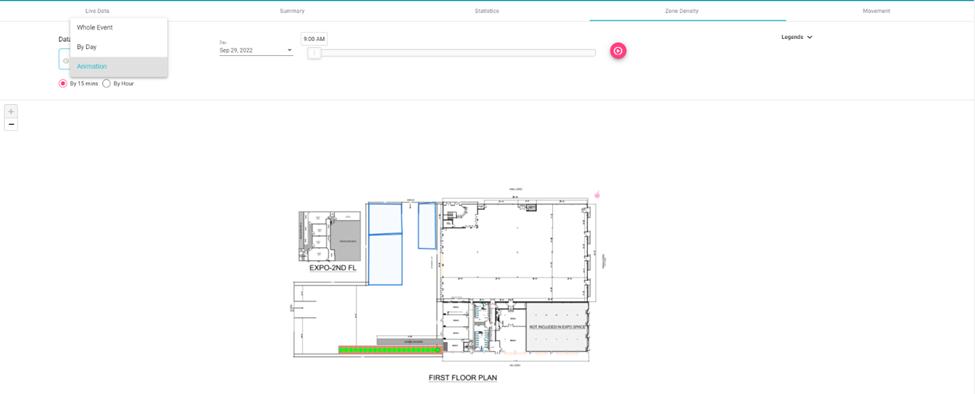
The “Zone Density” tab shows the population density of each zone across the entire event, by day, or an animation showing density across 15 minute or hour long intervals over a specific day.
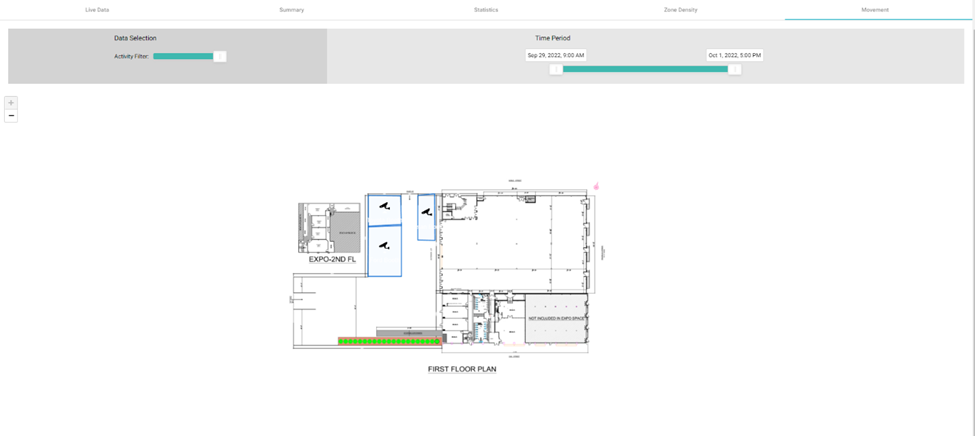
The final tab, the “Movement” tab, shows the movement of persons’ across the given time period, with the option to filer out areas of less movement.