Ruckus Zone Director
Overview
The Kloudspot Analytics Engine can receive events from many types of WiFi network.
One or more of event sources can be configured in the ‘Configuration - > Event Processing - > Wi-Fi’ screen.
Validate the Receiver URLs
The protocol (HTTP/HTTPS) used varies depending on the source. We support both HTTP and HTTPS protocols using port 48082 and 48083. Refer to the specific data source below to determine the correct one to use.
If you have set a SSL certificate for the UI, that will be used instead of the self signed one.
You can check access to both the HTTP and HTTPS urls with a ‘ping’:
$ curl http://{server}:48082/ping
hi from http receiver
$ curl -k https://{server}:48083/ping
hi from https receiver
Ruckus Zone Director
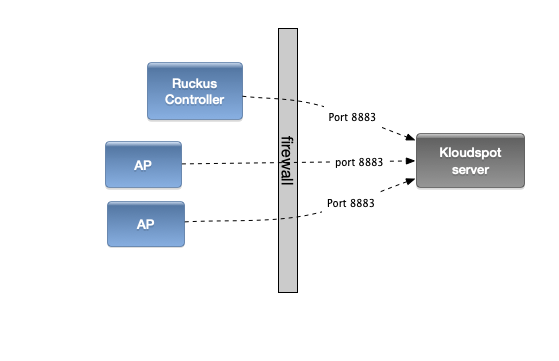
The Ruckus APs use the MQTT protocol to
communicate with the Kloudspot Analytics server. For this to work Port 8883
must be open from the Ruckus controller and APs to the Kloudspot Analytics
server:
Ruckus APs can send event data directly to the Kloudspot Analytics Engine. The following steps set this up.
- Go the the event sources screen in the Kloudspot Analytics Engine and enable the ‘Ruckus Zone Director’ source. Note the secret key and then restart the Stream Processing job.
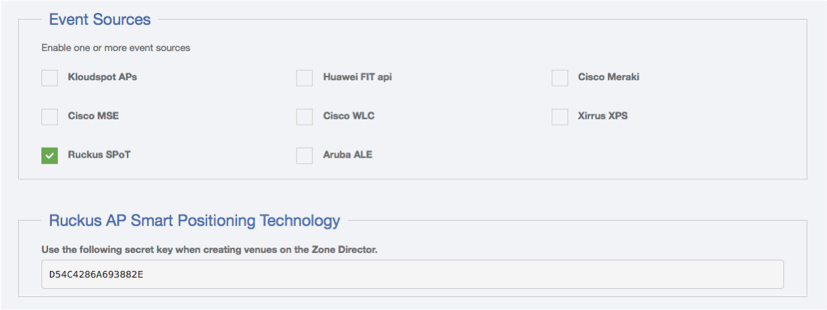
- Click ‘Save’
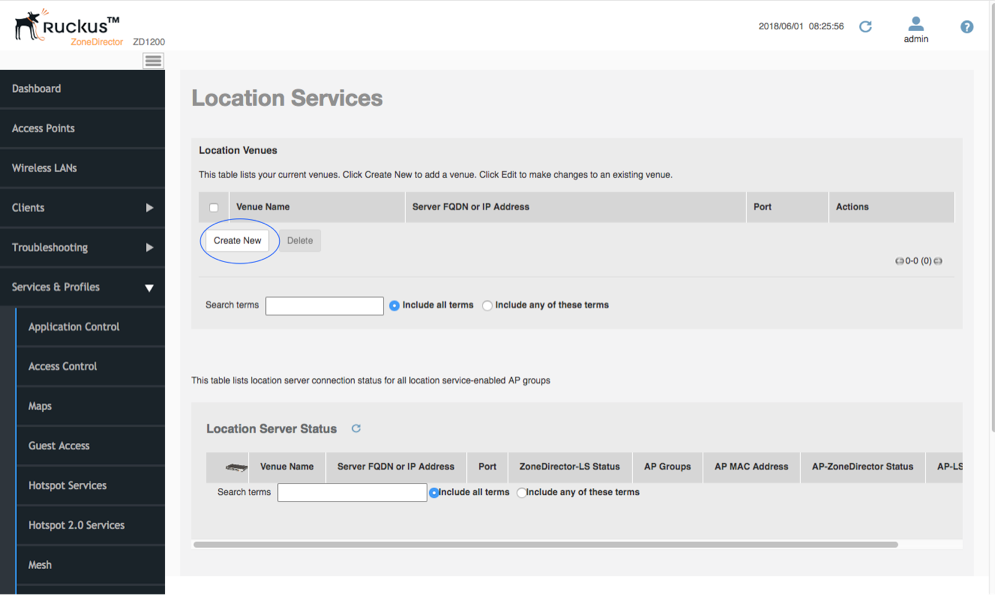
- Go to the Ruckus Zone Director. Login and select the Services & Profiles -> Location Services menu entry.
- Click ‘Create New’
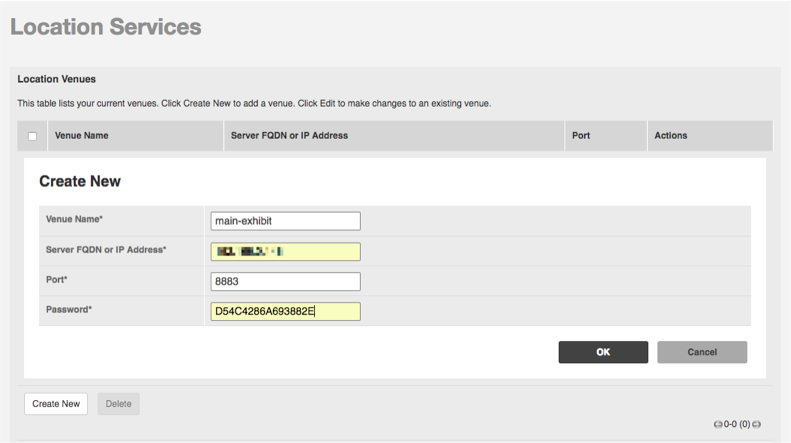
- Enter the required information including the secret key from above and click OK.
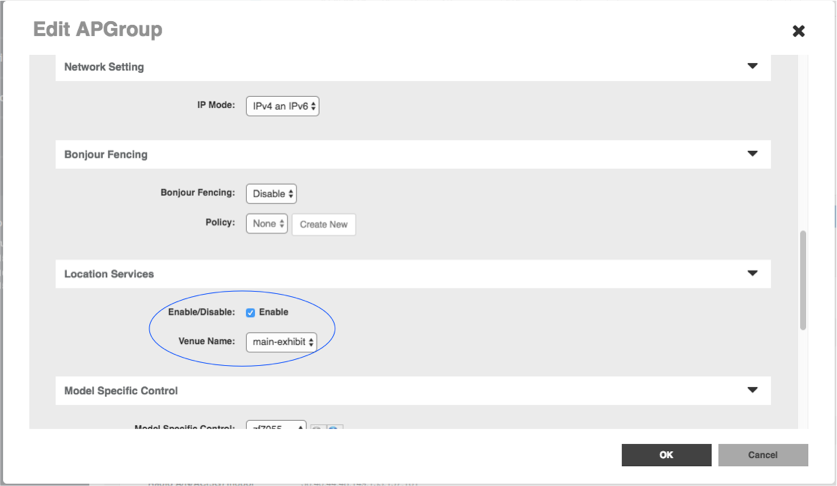
- Then select the Access Points menu entry. Select the access point group for which you want to send events. Click configure.
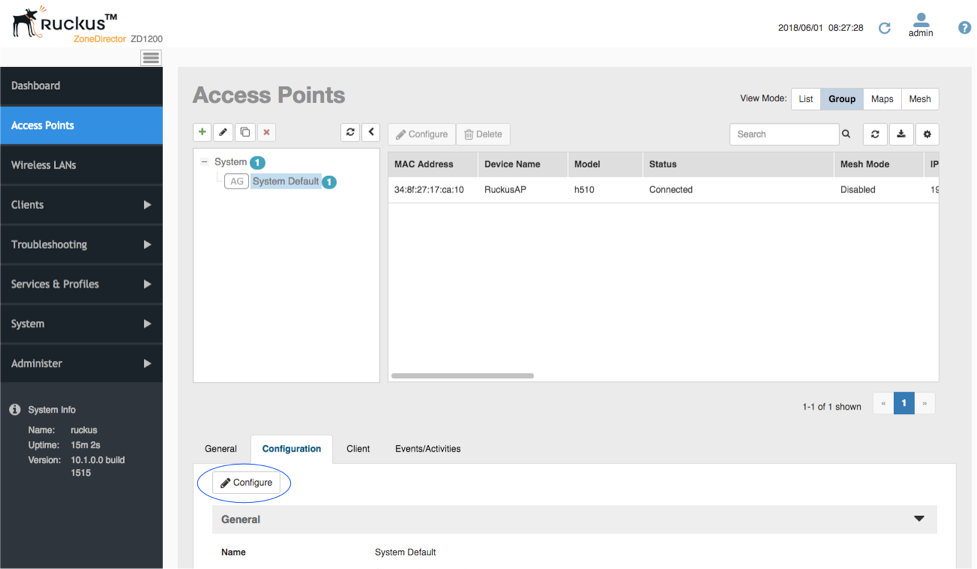
- Scroll down to Location Services and enable the venue we just set up. Click ‘OK’.
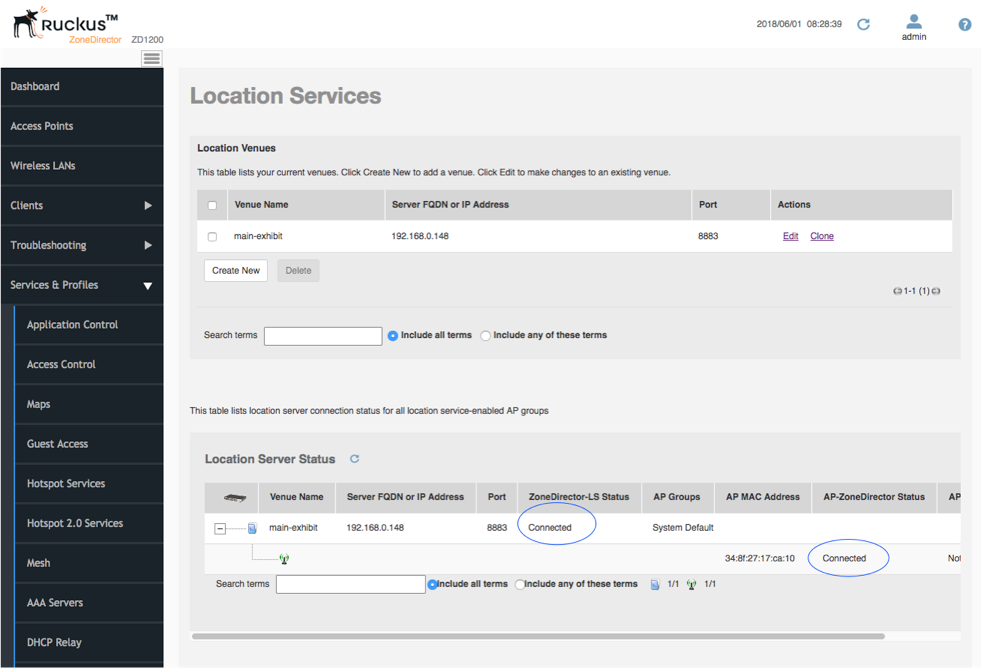
- Finally select the Services & Profiles -> Location Services menu entry. You now see the director and the APs all showing connected status.
Check Event Reception
Login to the Analytics Engine via SSH and run the kafka-listen command:
$ kafka-listen
{"vendor": "Kloudspot", "eventType": "PRESENCE", "location": null,..
{"vendor": "Kloudspot", "eventType": "PRESENCE", "location": null,..
{"vendor": "Kloudspot", "eventType": "PRESENCE", "location": null,..
{"vendor": "Kloudspot", "eventType": "PRESENCE", "location": null,..
You will be able to see the ‘raw’ event feed going into the stream processing.