Ruckus virtual SmartZone
Overview
The Kloudspot Analytics Engine can receive events from many types of WiFi network.
One or more of event sources can be configured in the ‘Configuration - > Event Processing - > Wi-Fi’ screen.
Validate the Receiver URLs
The protocol (HTTP/HTTPS) used varies depending on the source. We support both HTTP and HTTPS protocols using port 48082 and 48083. Refer to the specific data source below to determine the correct one to use.
If you have set a SSL certificate for the UI, that will be used instead of the self signed one.
You can check access to both the HTTP and HTTPS urls with a ‘ping’:
$ curl http://{server}:48082/ping
hi from http receiver
$ curl -k https://{server}:48083/ping
hi from https receiver
Ruckus virtual SmartZone
Port 8883 must be open from the Ruckus controller and APs to the Kloudspot Analytics server. [See the Ruckus Zone Director instructions for details](https://documentation.kloudspot.com/analytics/web- ui/configuration/event-receivers#ruckus-zone-director).
In addition this integration needs access to the [Ruckus SmartZone API](http://docs.ruckuswireless.com/sz-100/sz-public-api-reference- guide-3-0.html) which is normally on port 7443.
Ruckus APs can send event data directly to the Kloudspot Analytics Engine. The following steps set this up.
- Go the the event sources screen in the Kloudspot Analytics Engine and enable the ‘Ruckus virtual SmartZone’ source.
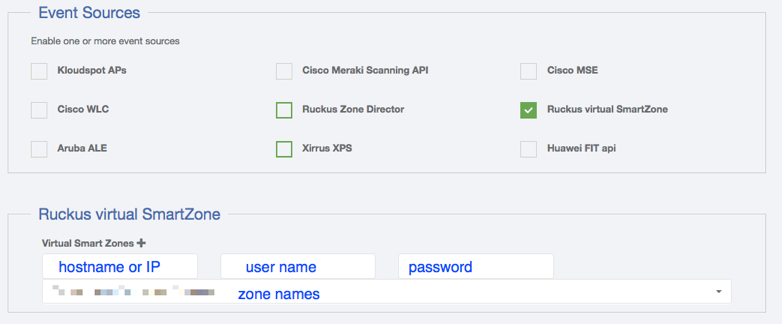
- Click the ‘+’ sign to add a virtual SmartZone contoller.
- Enter the server address and credentials.
- Once the server, username and password fields are valid, the Kloudspot Analytics Engine will contact the Ruckus server and download a list of zones. Select one or more zones from the dropdown.
- Click ‘Save’
At this point, the Kloudspot Analytics engine will contact the Ruckus virtual SmartZone controller and set up all the required Location Based Services configuration.
Check Event Reception
Login to the Analytics Engine via SSH and run the kafka-listen command:
$ kafka-listen
{"vendor": "Kloudspot", "eventType": "PRESENCE", "location": null,..
{"vendor": "Kloudspot", "eventType": "PRESENCE", "location": null,..
{"vendor": "Kloudspot", "eventType": "PRESENCE", "location": null,..
{"vendor": "Kloudspot", "eventType": "PRESENCE", "location": null,..
You will be able to see the ‘raw’ event feed going into the stream processing.