Subsections of WiFi/BLE Event Recievers
Aruba ALE
The Kloudspot Analytics Engine can receive events from many types of WiFi network.
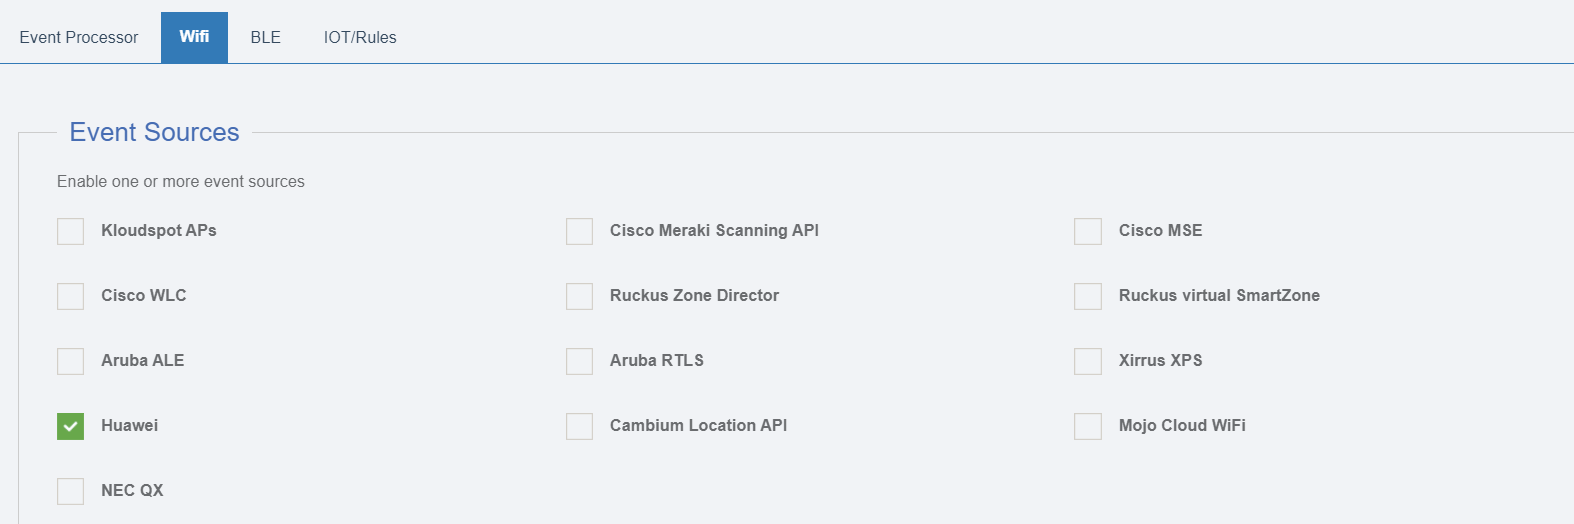
One or more of event sources can be configured in the Configuration - > Event Processing- >Wi-Fi screen.
Validate the Receiver URLs
The protocol (HTTP/HTTPS) used varies depending on the source. We support both HTTP and HTTPS protocols using port 48082 and 48083. Refer to the specific data source below to determine the correct one to use.
If you have set a SSL certificate for the UI, that will be used instead of the self signed one.
You can check access to both the HTTP and HTTPS urls with a ‘ping’:
$ curl http://{server}:48082/ping
hi from http receiver
$ curl -k https://{server}:48083/ping
hi from https receiver
Aruba ALE
Refer to the ‘Analytics and Location Engine 2.0 - User Guide’. This will give the necessary information to set up the connection and/or the Websocket tunnel. Here are the Aruba docs.
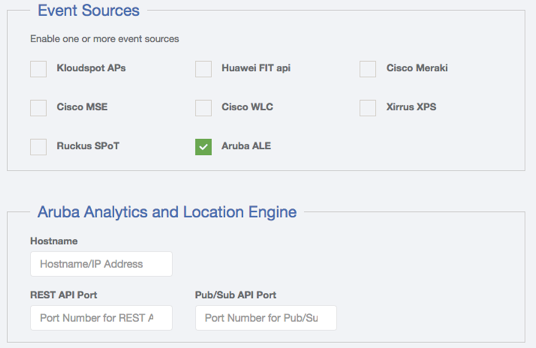
Three parameters need to be entered into the Kloudspot Analytics configuration screen:
- Hostname: of the ALE Websocket Proxy
- REST API Port: Typically 8700
- Pub/Sub API Port: The port used for the ZMQ connection. This is the port mapped to port 7779 on the ALE (typically 12000).
In summary:
- The Analytics Engine can either access the ALE Engine directly or make use of the supplied Websocket Tunnel. In either case enter the required port details into the configuration screen and click save.
- The ALE Engine should be configured to not anonymize Mac addresses.
- At present only presence (Context Mode) is support for this source.
The Aruba websocket endpont can be set up anywhere, which can help with firewall issues. Depending on the circumstances, the endpoint could be installed on the Kloudspot Analytics server itself (with a localhost connection).
Check Event Reception
Login to the Analytics Engine via SSH and run the kafka-listen command:
$ kafka-listen
{"vendor": "Kloudspot", "eventType": "PRESENCE", "location": null,..
{"vendor": "Kloudspot", "eventType": "PRESENCE", "location": null,..
{"vendor": "Kloudspot", "eventType": "PRESENCE", "location": null,..
{"vendor": "Kloudspot", "eventType": "PRESENCE", "location": null,..
You will be able to see the ‘raw’ event feed going into the stream processing.
Aruba RTLS
Overview
The Kloudspot Analytics Engine can receive events from many types of WiFi network.
One or more of event sources can be configured in the ‘Configuration - > Event Processing - > Wi-Fi’ screen.
Validate the Receiver URLs
The protocol (HTTP/HTTPS) used varies depending on the source. We support both HTTP and HTTPS protocols using port 48082 and 48083. Refer to the specific data source below to determine the correct one to use.
If you have set a SSL certificate for the UI, that will be used instead of the self signed one.
You can check access to both the HTTP and HTTPS urls with a ‘ping’:
$ curl http://{server}:48082/ping
hi from http receiver
$ curl -k https://{server}:48083/ping
hi from https receiver
Aruba RTLS Feed
In addition to a feed from the Aruba Location Engine, we can also take a feed direct from the APs. This can be set up either on individual APs or for groups of APs via Airwave or Aruba Central.
In order for this work, the APs must be able to access port 3333 on the Kloudspot server using the UDP protocol. Depending on firewall requirements, it should be possible to use a [standalone proxy data receiver](https://documentation.kloudspot.com/help/standalone-receiver-setup- for-cisco-wlc “Standalone Receiver Setup for Cisco WLC”).
The setup is similar regardless of the approach:
- Enable the event type in the KloudInsights configuration screen and set a passphrase to use:
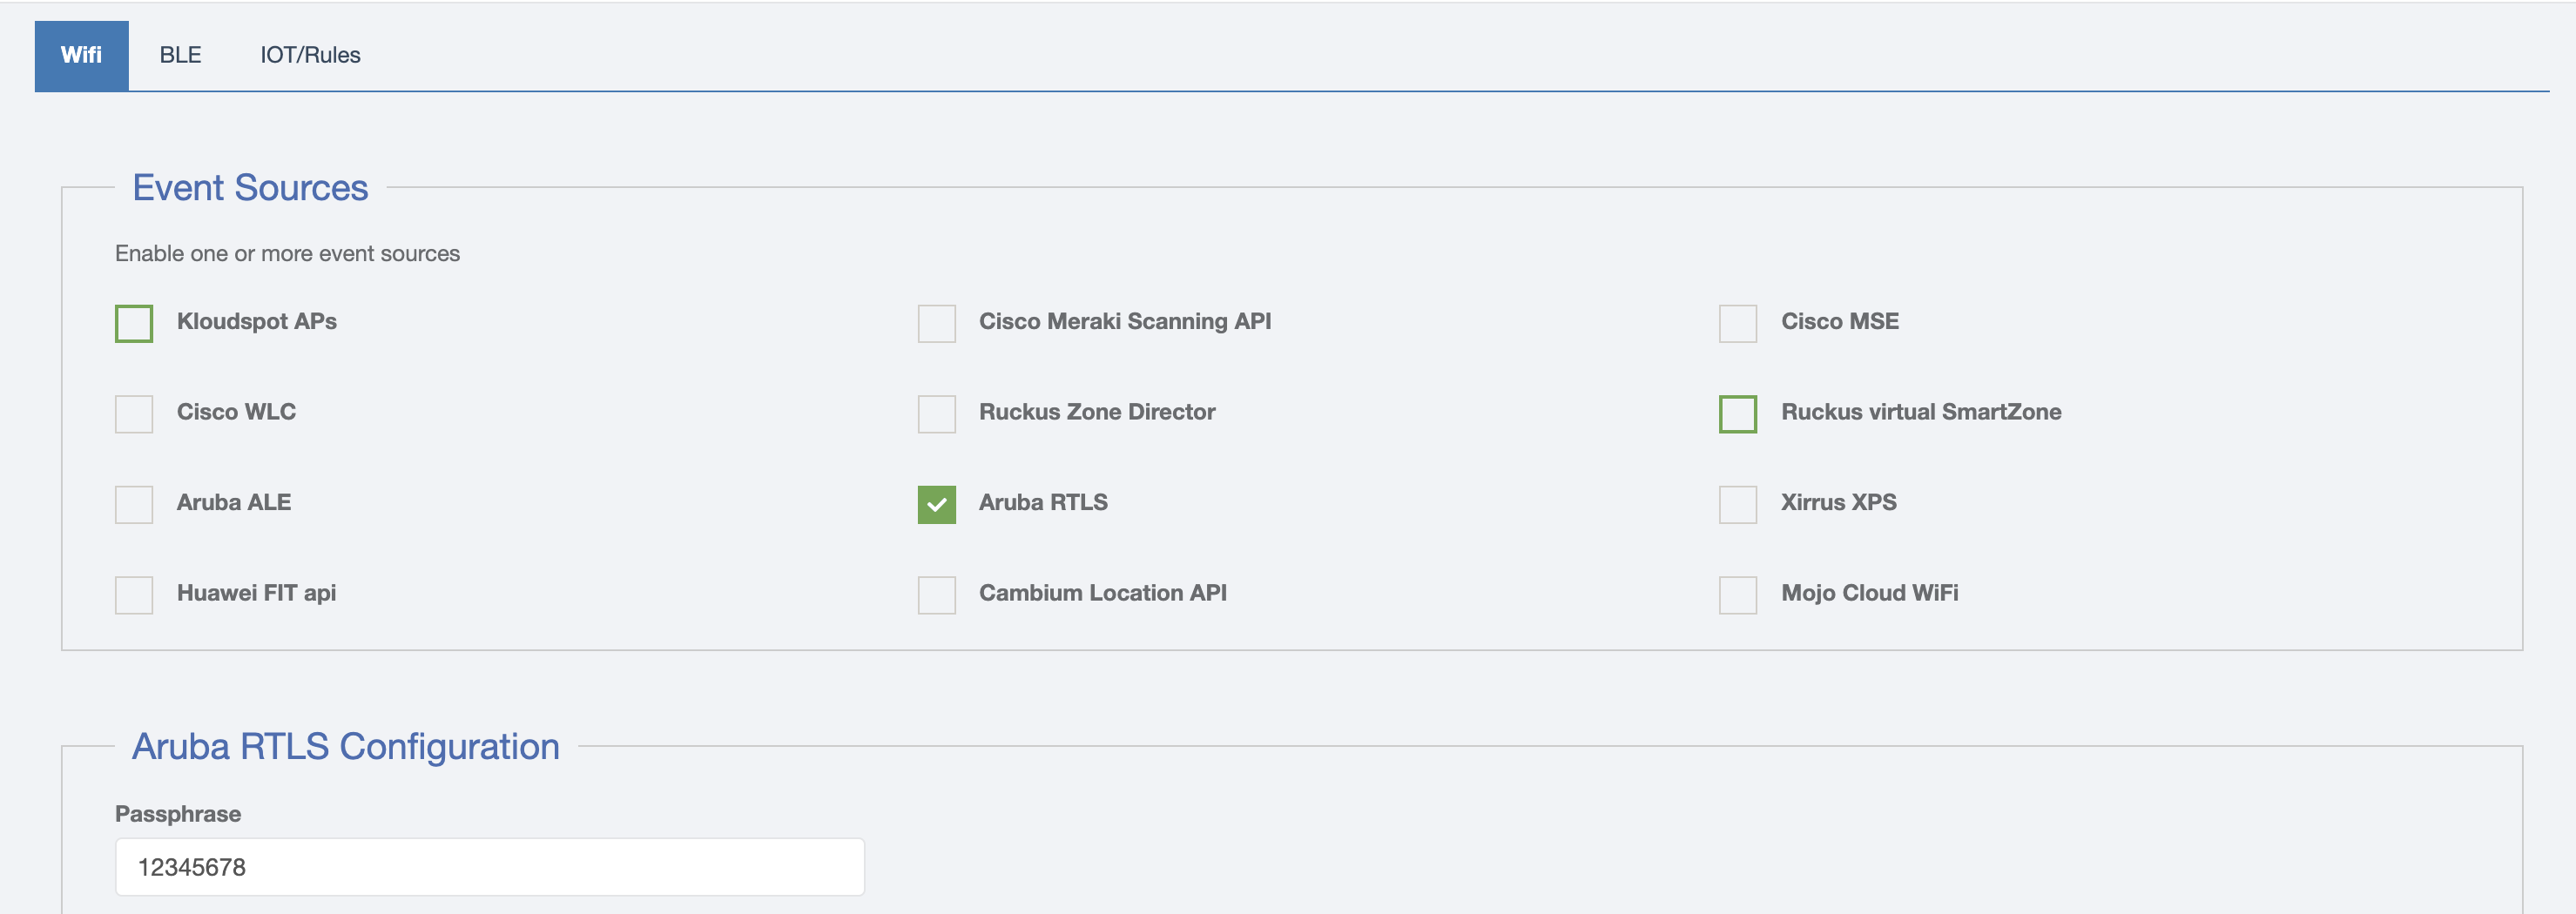
- In the Aruba dashboard, enable the RTLS feed in the Services menu for the AP or Group, using the passphrase you created above and port 3333
See these references in the Aruba documentation for information:
Regardless of the method used, the following parameters are needed:
- The fully qualified domain name or IP Address of the KloudInsights server.
- The port will be 3333.
- The passphrase set in the KloudInsights configuration.
Check Event Reception
Login to the Analytics Engine via SSH and run the kafka-listen command:
$ kafka-listen
{"vendor": "Kloudspot", "eventType": "PRESENCE", "location": null,..
{"vendor": "Kloudspot", "eventType": "PRESENCE", "location": null,..
{"vendor": "Kloudspot", "eventType": "PRESENCE", "location": null,..
{"vendor": "Kloudspot", "eventType": "PRESENCE", "location": null,..
You will be able to see the ‘raw’ event feed going into the stream processing.
Related Articles
[template(“related”)]
Cambium
Overview
The Kloudspot Analytics Engine can receive events from many types of WiFi network.
One or more of event sources can be configured in the ‘Configuration - > Event Processing - > Wi-Fi’ screen.
Validate the Receiver URLs
The protocol (HTTP/HTTPS) used varies depending on the source. We support both HTTP and HTTPS protocols using port 48082 and 48083. Refer to the specific data source below to determine the correct one to use.
If you have set a SSL certificate for the UI, that will be used instead of the self signed one.
You can check access to both the HTTP and HTTPS urls with a ‘ping’:
$ curl http://{server}:48082/ping
hi from http receiver
$ curl -k https://{server}:48083/ping
hi from https receiver
Cambium cnPilot
Kloudspot Analytics support the WiFi Location API provided by Cambium cnPilot Enterprise APs. The API can be setup either on standalone APs or via the cnMeastro Wireless Controller/Network Manager.
In either case the setup is the same:
- Go to the Radio options and enable Off Channel scan and Auto RF and save.
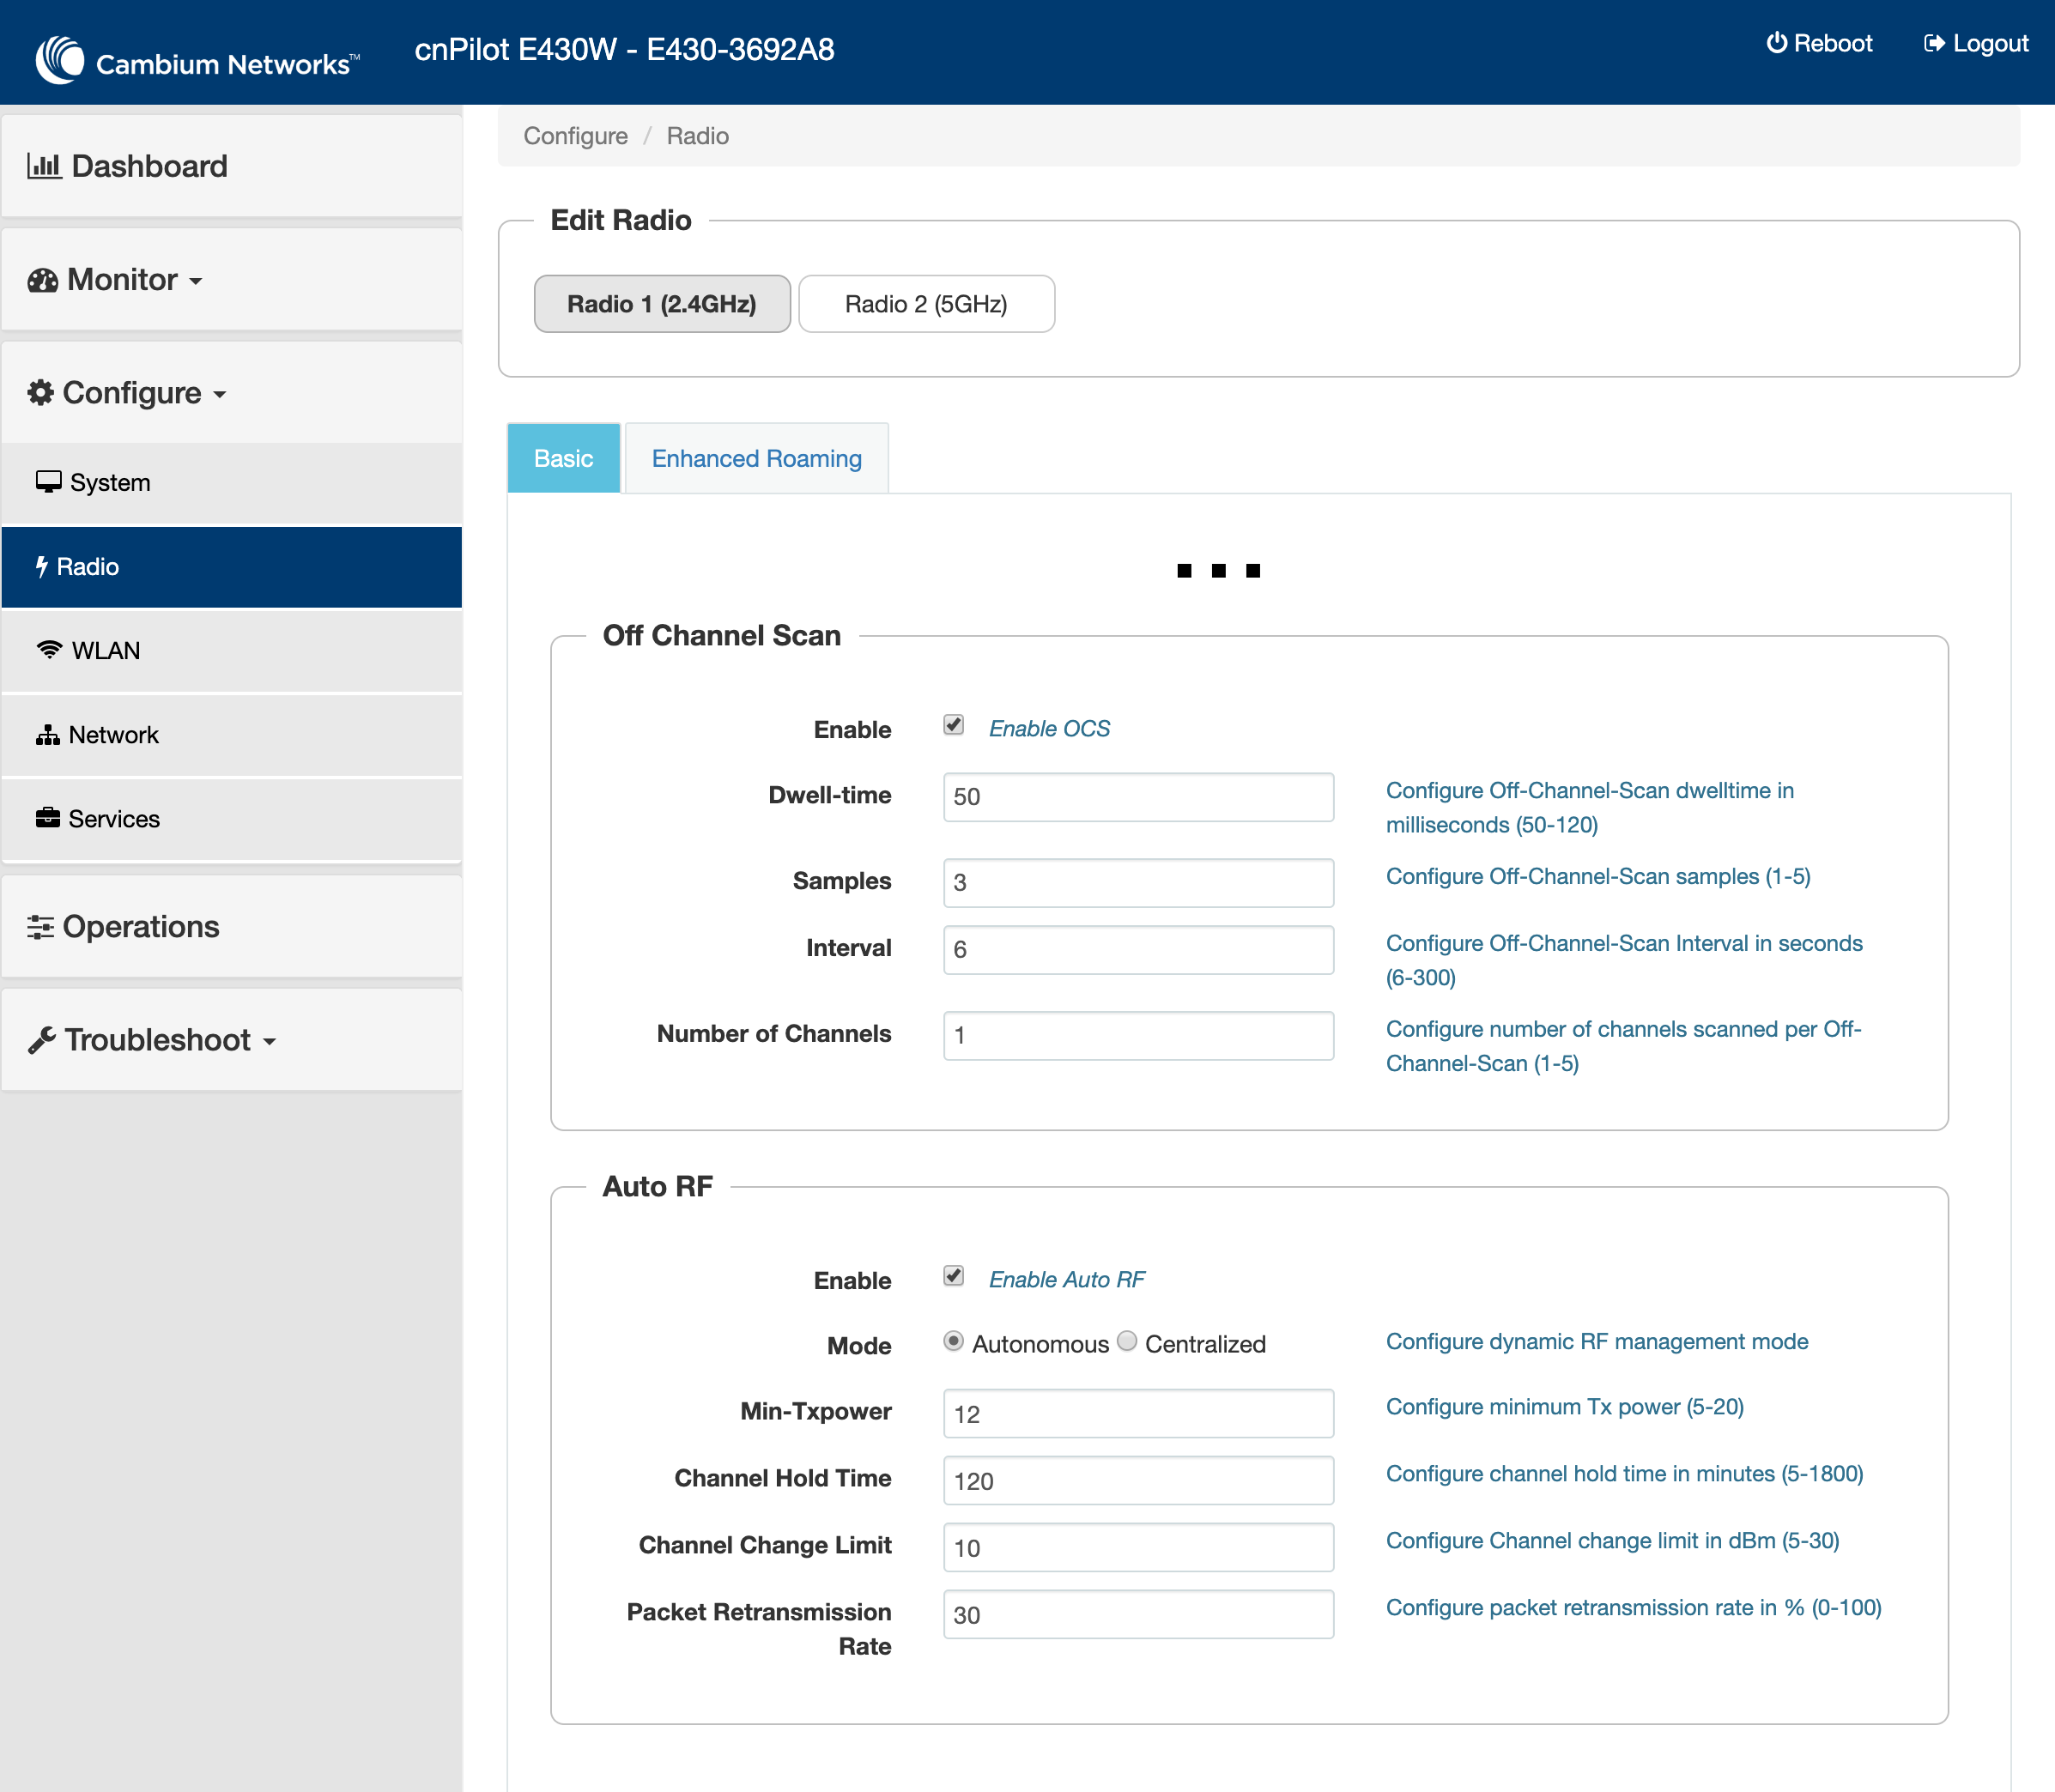
- Then to the Services options and enable the Location API and save.
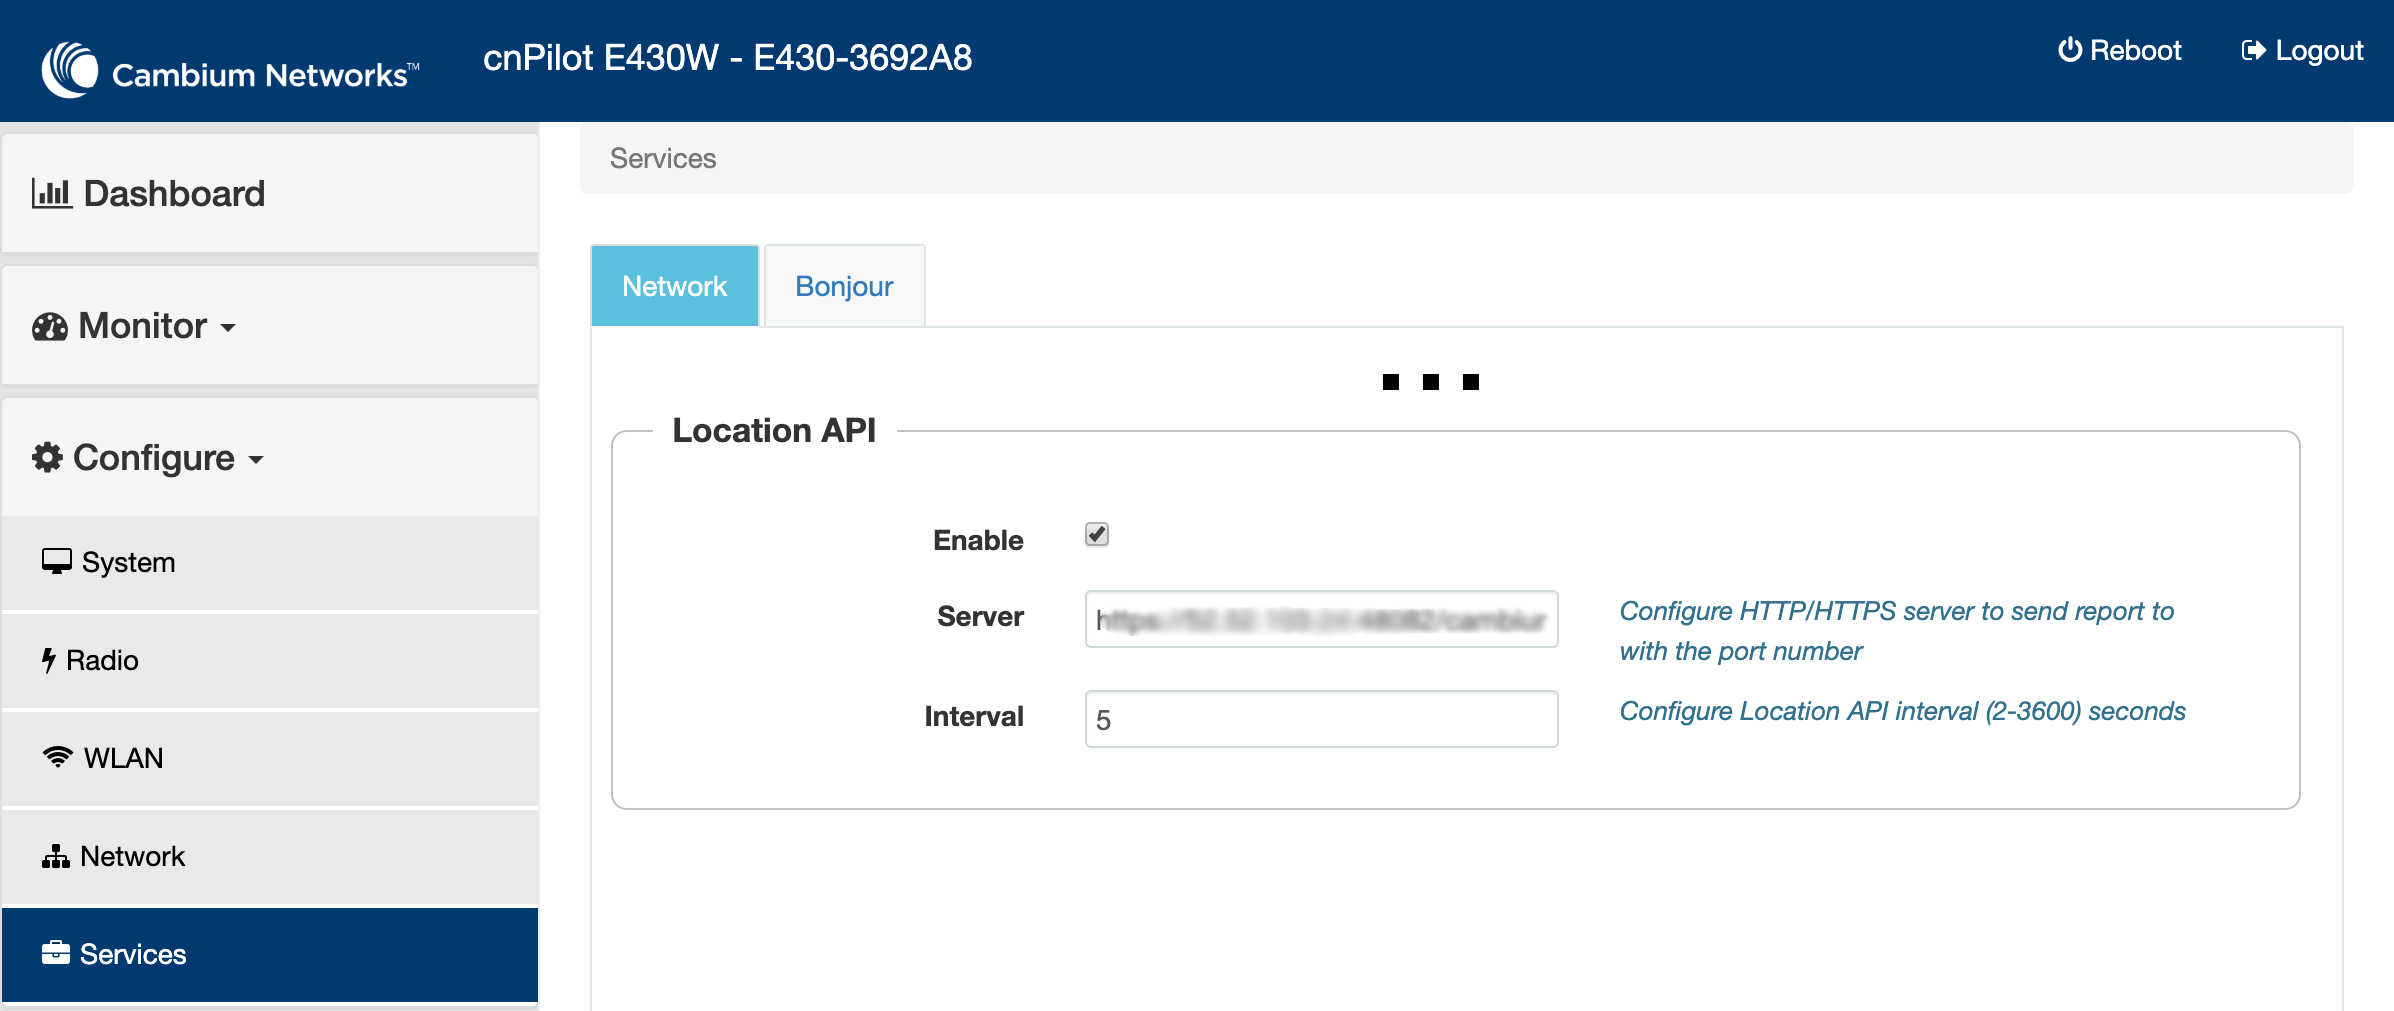
The default Server URL will be: https://<server>:48083/cambium. The Interval
should be ~30 seconds.
- Go the the event sources screen in the Kloudspot Analytics Engine, enable the ‘Cambium Location API’ source and then restart the Stream Processing job.
Cambium cnMaestro
For cnMaestro, the steps to be taken are the same as with cnPilot, however to navigate to the radio & service settings please follow the steps in the below screenshot:
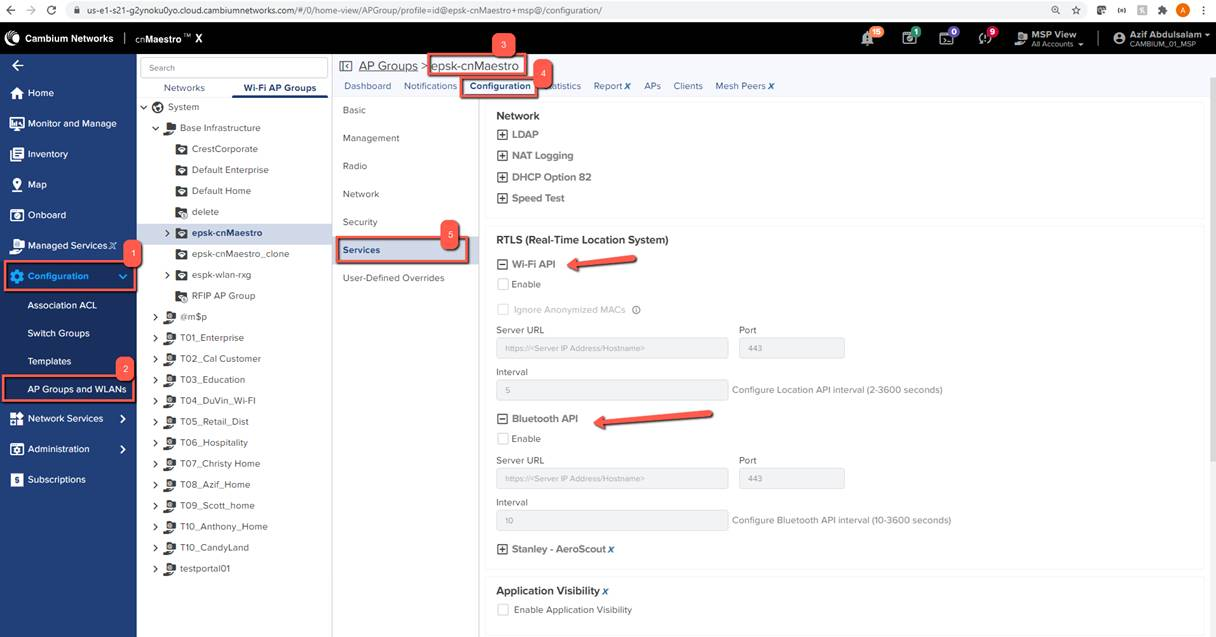
If BLE is also being scanned for, make sure to enable the Bluetooth API on the services page, and enter in the same information entered for WiFi.
Check Event Reception
Login to the Analytics Engine via SSH and run the kafka-listen command:
$ kafka-listen
{"vendor": "Kloudspot", "eventType": "PRESENCE", "location": null,..
{"vendor": "Kloudspot", "eventType": "PRESENCE", "location": null,..
{"vendor": "Kloudspot", "eventType": "PRESENCE", "location": null,..
{"vendor": "Kloudspot", "eventType": "PRESENCE", "location": null,..
You will be able to see the ‘raw’ event feed going into the stream processing.
Related Articles
[template(“related”)]
Cisco CMX
Overview
The Kloudspot Analytics Engine can receive events from many types of WiFi network.
One or more of event sources can be configured in the ‘Configuration - > **Event Processing - > Wi-Fi’**screen.
Validate the Receiver URLs
The protocol (HTTP/HTTPS) used varies depending on the source. We support both HTTP and HTTPS protocols using port 48082 and 48083. Refer to the specific data source below to determine the correct one to use.
If you have set a SSL certificate for the UI, that will be used instead of the self signed one.
You can check access to both the HTTP and HTTPS urls with a ‘ping’:
$ curl http://{server}:48082/ping
hi from http receiver
$ curl -k https://{server}:48083/ping
hi from https receiver
Cisco CMX/MSE
The Kloudspot Location Engine supports Notifications from the Cisco CMX v10.X operating in ‘presence’ mode.
On Kloudspot Location Engine, select the ‘Cisco MSE’ Event source and click ‘save’.
Then login to Cisco CMX and configure the following notification types:
- Movement
- Area Change
- Location Update
- Absence
See CMX Manual for instructions on setting up notifications
When setting up a notification:
-
Use the following receiver URL:
https://{server}:48083/event10 -
Select JSON message format.
-
Turn MAC scrambling off.
Check Event Reception
Login to the Analytics Engine via SSH and run the kafka-listen command:
$ kafka-listen
{"vendor": "Kloudspot", "eventType": "PRESENCE", "location": null,..
{"vendor": "Kloudspot", "eventType": "PRESENCE", "location": null,..
{"vendor": "Kloudspot", "eventType": "PRESENCE", "location": null,..
{"vendor": "Kloudspot", "eventType": "PRESENCE", "location": null,..
You will be able to see the ‘raw’ event feed going into the stream processing.
Cisco Meraki
Overview
The Kloudspot Analytics Engine can receive events from many types of WiFi network.
One or more of event sources can be configured in the ‘Configuration - > Event Processing - > Wi-Fi’ screen.
Validate the Receiver URLs
The protocol (HTTP/HTTPS) used varies depending on the source. We support both HTTP and HTTPS protocols using port 48082 and 48083. Refer to the specific data source below to determine the correct one to use.
If you have set a SSL certificate for the UI, that will be used instead of the self signed one.
You can check access to both the HTTP and HTTPS urls with a ‘ping’:
$ curl http://{server}:48082/ping
hi from http receiver
$ curl -k https://{server}:48083/ping
hi from https receiver
Meraki MV Sense
Follow the instructions provided on the link to configure MQTT broker in the Meraki Dashboard:
Follow the instructions provided on the link to subscribe to different MQTT Messages
NOTE: Currently we subscribe Raw Detections and lux light levels topics.
Enable location Services: TCP port 6666 needs to be opened to start
capturing Meraki MV sense Data.
Cisco Meraki Location Scanning API
To enable, the Meraki scanning API feed, follow the following steps:
- First, follow these instructions in the Meraki manual to set up the Scanning API on each Meraki account.
When enabling the API, set the following parameters:
- API Version : 2
- Post URL : https://{server}:48083/meraki/{name}
- Secret : for example - kloudspot12345678
For ‘{name}’ use a friendly alphanumeric label for the account.
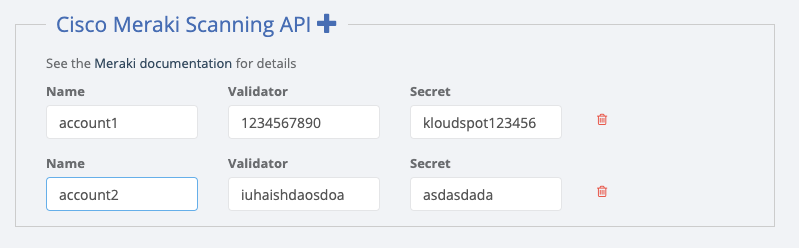
- Next go to the Kloudspot Web UI and select ‘Cisco Meraki’ source in the Event Sources.
- Add an entry for each account (one is enabled by default) by clicking the ‘+’ sign.
- Enter the ’name’, ‘validation’ and secret’ from above for each account and click ‘Save’.
- Restart the stream processing job.
Check Event Reception
Login to the Analytics Engine via SSH and run the kafka-listen command:
$ kafka-listen
{"vendor": "Kloudspot", "eventType": "PRESENCE", "location": null,..
{"vendor": "Kloudspot", "eventType": "PRESENCE", "location": null,..
{"vendor": "Kloudspot", "eventType": "PRESENCE", "location": null,..
{"vendor": "Kloudspot", "eventType": "PRESENCE", "location": null,..
You will be able to see the ‘raw’ event feed going into the stream processing.
Cisco WLC
Overview
The Kloudspot Analytics Engine can receive events from many types of WiFi network.
One or more of event sources can be configured in the ‘Configuration - > Event Processing - > Wi-Fi’ screen.
Validate the Receiver URLs
The protocol (HTTP/HTTPS) used varies depending on the source. We support both HTTP and HTTPS protocols using port 48082 and 48083. Refer to the specific data source below to determine the correct one to use.
If you have set a SSL certificate for the UI, that will be used instead of the self signed one.
You can check access to both the HTTP and HTTPS urls with a ‘ping’:
$ curl http://{server}:48082/ping
hi from http receiver
$ curl -k https://{server}:48083/ping
hi from https receiver
Cisco Wireless Lan Controller
To configure a Cisco Wireless WAN Controller to send events, follow the following steps.
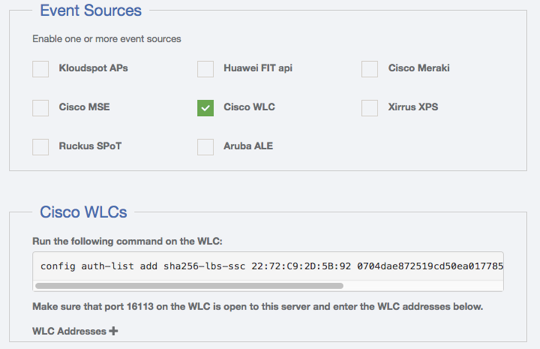
- Ensure that the Kloudspot Analytics Engine can access port 16113 on the WLC.
- Enable the Cisco WLC Event source in the Kloudspot Analytics Engine.
- Copy the command from the Kloudspot UI and run on the WLC. This will allow the Analytics Engine to connect and subscribe for events.
- Add the IP address for WLC to the list of WLC Addresses in the Analytics Engine UI and click ‘Save’.
Check Event Reception
Login to the Analytics Engine via SSH and run the kafka-listen command:
$ kafka-listen
{"vendor": "Kloudspot", "eventType": "PRESENCE", "location": null,..
{"vendor": "Kloudspot", "eventType": "PRESENCE", "location": null,..
{"vendor": "Kloudspot", "eventType": "PRESENCE", "location": null,..
{"vendor": "Kloudspot", "eventType": "PRESENCE", "location": null,..
You will be able to see the ‘raw’ event feed going into the stream processing.
Huawei
Overview
The Kloudspot Analytics Engine can receive events from many types of WiFi network.
One or more of event sources can be configured in the **‘Configuration - > ****Event Processing** **- > ****Wi-Fi** ’ screen.
Validate the Receiver URLs
The protocol (HTTP/HTTPS) used varies depending on the source. We support both HTTP and HTTPS protocols using port 48082 and 48083. Refer to the specific data source below to determine the correct one to use.
If you have set a SSL certificate for the UI, that will be used instead of the self signed one.
You can check access to both the HTTP and HTTPS urls with a ‘ping’:
$ curl http://{abc}-rcv.apps.kloudspot.com/{xyz}
hi from http receiver
$ curl -k https://{abc}-rcv.apps.kloudspot.com/{xyz}
hi from https receiver
- Use port 443
- {abc} = customer vanity URL
- {xyz} = type of receiver used
Huawei
To configure a Huawei AP, select ‘Huawei’ from the event sources available.
Enable location Services
To enable location services for Huawei APs please follow the steps below.
- Open 7777/ UDP port for collecting Wi-Fi data
- Open 7778/UDP port for collecting BLE data.
Accuracy: The accuracy provided for Huawei AP is approximately between 3-5 meters for WiFi and 1-3 meters for BLE.
Reference links for Huawei
- Reference link for BLE integration from Huawei
https://intl.devzone.huawei.com/en/enterprise/campus/lbsBluetoothSolution.html
- Reference link for Wi-Fi integration from Huawei
https://intl.devzone.huawei.com/en/enterprise/campus/lbsWiFiSolution.html
- Integration Document Kloudspot-Huawei
Check Event Reception
Login to the Analytics Engine via SSH and run the kafka-listen command:
$ kafka-listen
{"vendor": "Kloudspot", "eventType": "PRESENCE", "location": null,..
{"vendor": "Kloudspot", "eventType": "PRESENCE", "location": null,..
{"vendor": "Kloudspot", "eventType": "PRESENCE", "location": null,..
{"vendor": "Kloudspot", "eventType": "PRESENCE", "location": null,..
You will be able to see the ‘raw’ event feed going into the stream processing.
Kloudspot Event Receiver
Overview
The Kloudspot Analytics Engine can receive events from many types of WiFi network.
One or more of event sources can be configured in the **‘Configuration - > ****Event Processing** **- > ****Wi-Fi** ’ screen.
Validate the Receiver URLs
The protocol (HTTP/HTTPS) used varies depending on the source. We support both HTTP and HTTPS protocols using port 48082 and 48083. Refer to the specific data source below to determine the correct one to use.
If you have set a SSL certificate for the UI, that will be used instead of the self signed one.
You can check access to both the HTTP and HTTPS urls with a ‘ping’:
$ curl http://{server}:48082/ping
hi from http receiver
$ curl -k https://{server}:48083/ping
hi from https receiver
Kloudspot
The following steps are needed to configure Kloudspot APs to send events:
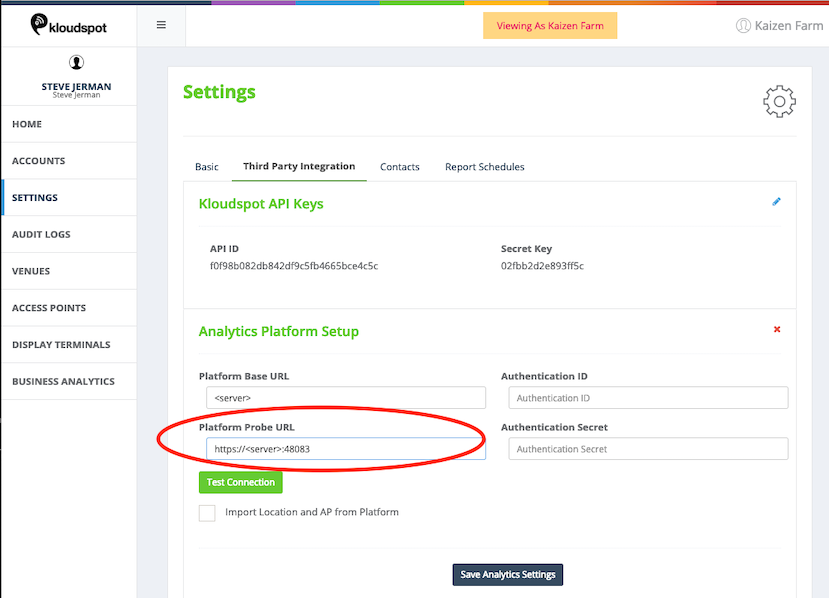
- Login to Kloudspot AP Management and edit the account configuration. Set the Platform Probe URL to point to the Analytics Engine HTTPS port (48083).
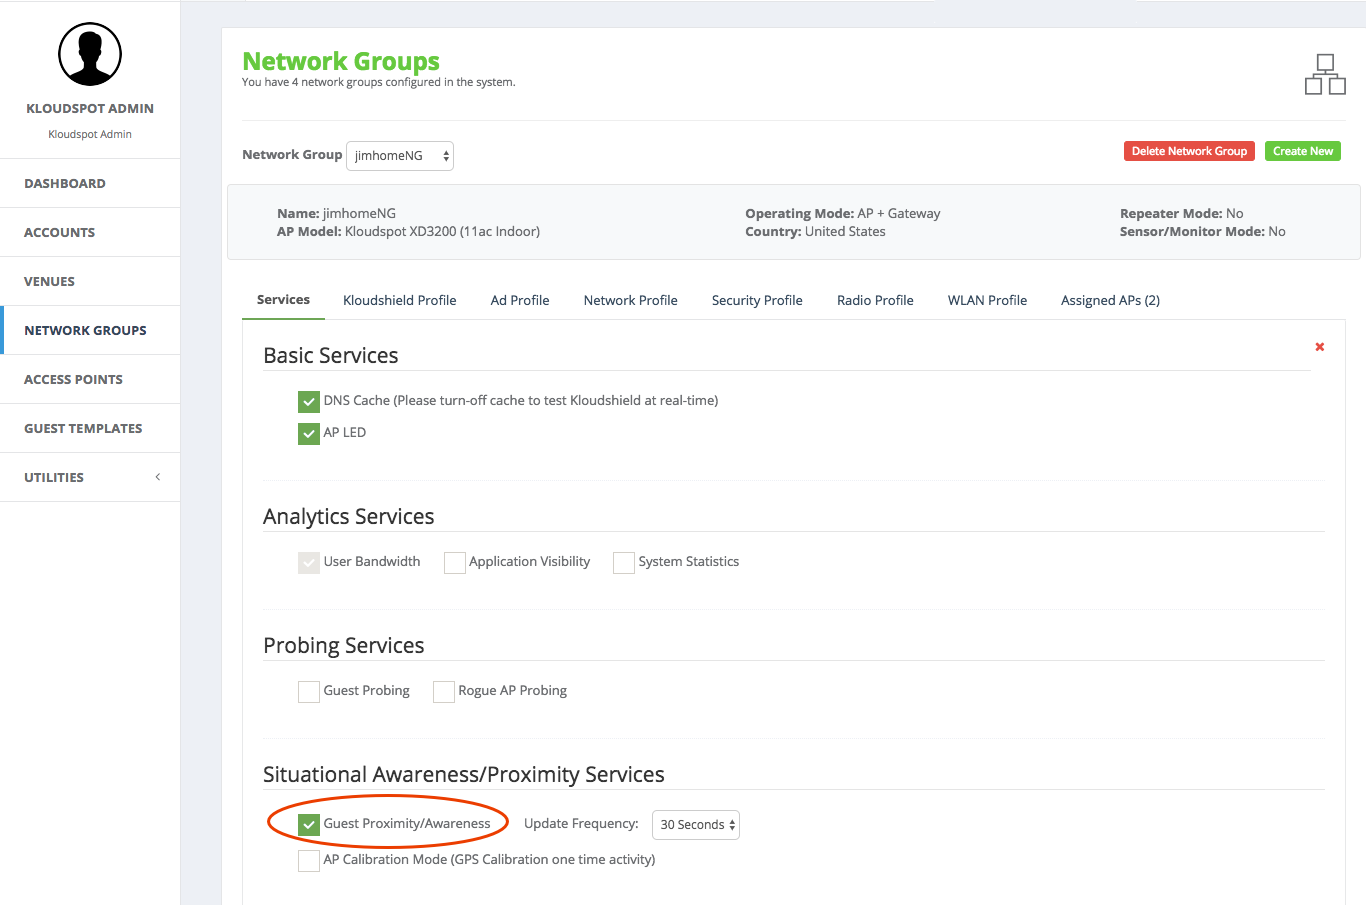
- Then edit the appropriate network groups to enable ‘Guest Proximity/Awareness’
- Finally, select ‘Kloudspot APs’ in the Event sources in the Analytics Engine and click ‘Save’
Check Event Reception
Login to the Analytics Engine via SSH and run the kafka-listen command:
$ kafka-listen
{"vendor": "Kloudspot", "eventType": "PRESENCE", "location": null,..
{"vendor": "Kloudspot", "eventType": "PRESENCE", "location": null,..
{"vendor": "Kloudspot", "eventType": "PRESENCE", "location": null,..
{"vendor": "Kloudspot", "eventType": "PRESENCE", "location": null,..
You will be able to see the ‘raw’ event feed going into the stream processing.
NEC QX
Overview
The Kloudspot Analytics Engine can receive events from many types of WiFi network.
One or more of event sources can be configured in the ‘Configuration - > Event Processing - > Wi-Fi’ screen.
Validate the Receiver URLs
The protocol (HTTP/HTTPS) used varies depending on the source. We support both HTTP and HTTPS protocols using port 48082 and 48083. Refer to the specific data source below to determine the correct one to use.
If you have set a SSL certificate for the UI, that will be used instead of the self signed one.
You can check access to both the HTTP and HTTPS urls with a ‘ping’:
$ curl http://{server}:48082/ping
hi from http receiver
$ curl -k https://{server}:48083/ping
hi from https receiver
NEC QX
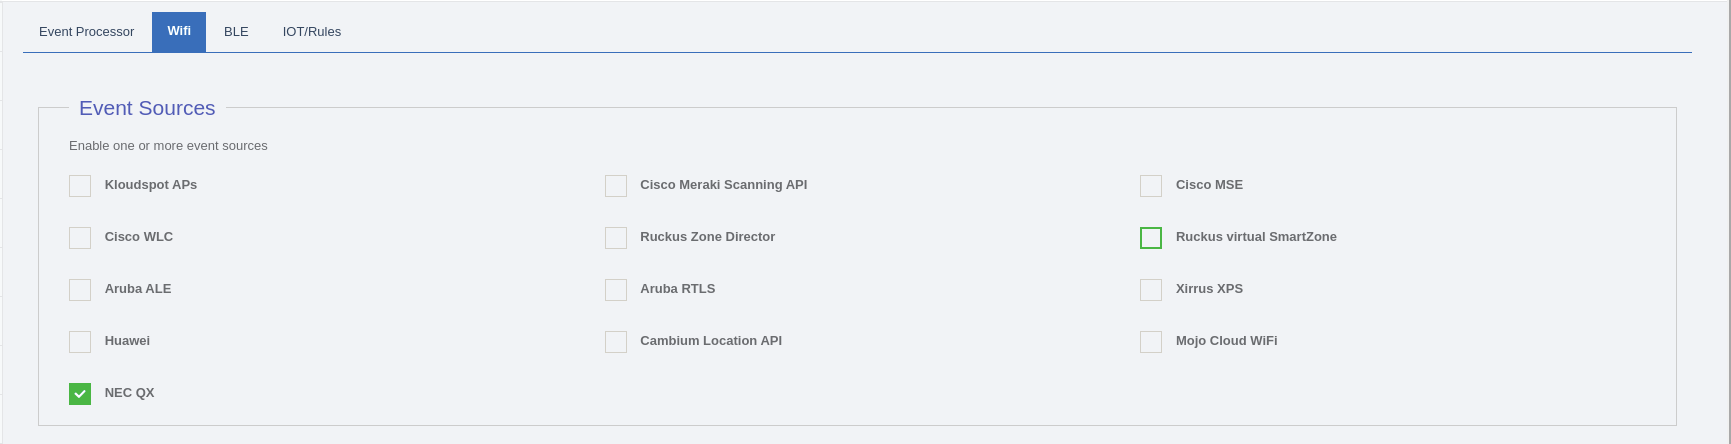
To configure a NEC QX AP, select ‘NEC QX’ from the event sources
available.
Enable location Services: To enable location services for NEC QX APs we need to open 5555/UDP port.
Check Event Reception
Login to the Analytics Engine via SSH and run the kafka-listen command:
$ kafka-listen
{"vendor": "Kloudspot", "eventType": "PRESENCE", "location": null,..
{"vendor": "Kloudspot", "eventType": "PRESENCE", "location": null,..
{"vendor": "Kloudspot", "eventType": "PRESENCE", "location": null,..
{"vendor": "Kloudspot", "eventType": "PRESENCE", "location": null,..
You will be able to see the ‘raw’ event feed going into the stream processing.
Ruckus virtual SmartZone
Overview
The Kloudspot Analytics Engine can receive events from many types of WiFi network.
One or more of event sources can be configured in the ‘Configuration - > Event Processing - > Wi-Fi’ screen.
Validate the Receiver URLs
The protocol (HTTP/HTTPS) used varies depending on the source. We support both HTTP and HTTPS protocols using port 48082 and 48083. Refer to the specific data source below to determine the correct one to use.
If you have set a SSL certificate for the UI, that will be used instead of the self signed one.
You can check access to both the HTTP and HTTPS urls with a ‘ping’:
$ curl http://{server}:48082/ping
hi from http receiver
$ curl -k https://{server}:48083/ping
hi from https receiver
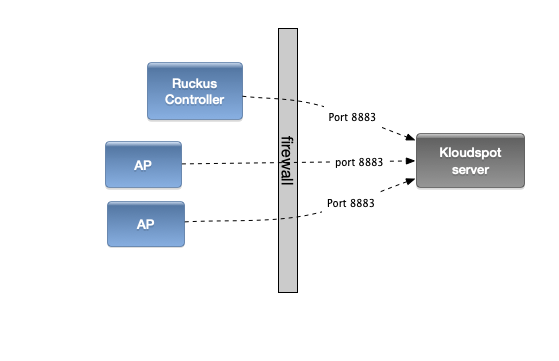
Ruckus virtual SmartZone
Port 8883 must be open from the Ruckus controller and APs to the Kloudspot Analytics server. [See the Ruckus Zone Director instructions for details](https://documentation.kloudspot.com/analytics/web- ui/configuration/event-receivers#ruckus-zone-director).
In addition this integration needs access to the [Ruckus SmartZone API](http://docs.ruckuswireless.com/sz-100/sz-public-api-reference- guide-3-0.html) which is normally on port 7443.
Ruckus APs can send event data directly to the Kloudspot Analytics Engine. The following steps set this up.
- Go the the event sources screen in the Kloudspot Analytics Engine and enable the ‘Ruckus virtual SmartZone’ source.
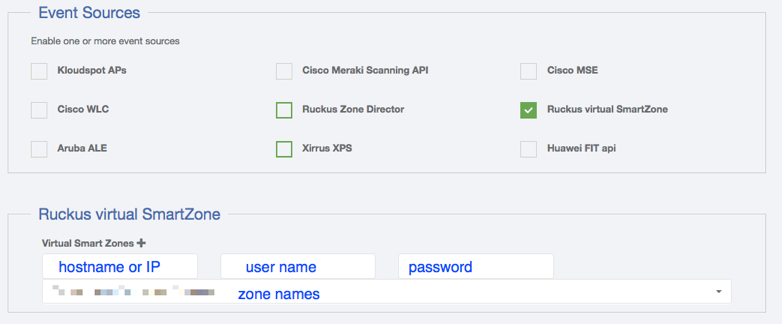
- Click the ‘+’ sign to add a virtual SmartZone contoller.
- Enter the server address and credentials.
- Once the server, username and password fields are valid, the Kloudspot Analytics Engine will contact the Ruckus server and download a list of zones. Select one or more zones from the dropdown.
- Click ‘Save’
At this point, the Kloudspot Analytics engine will contact the Ruckus virtual SmartZone controller and set up all the required Location Based Services configuration.
Check Event Reception
Login to the Analytics Engine via SSH and run the kafka-listen command:
$ kafka-listen
{"vendor": "Kloudspot", "eventType": "PRESENCE", "location": null,..
{"vendor": "Kloudspot", "eventType": "PRESENCE", "location": null,..
{"vendor": "Kloudspot", "eventType": "PRESENCE", "location": null,..
{"vendor": "Kloudspot", "eventType": "PRESENCE", "location": null,..
You will be able to see the ‘raw’ event feed going into the stream processing.
Ruckus Zone Director
Overview
The Kloudspot Analytics Engine can receive events from many types of WiFi network.
One or more of event sources can be configured in the ‘Configuration - > Event Processing - > Wi-Fi’ screen.
Validate the Receiver URLs
The protocol (HTTP/HTTPS) used varies depending on the source. We support both HTTP and HTTPS protocols using port 48082 and 48083. Refer to the specific data source below to determine the correct one to use.
If you have set a SSL certificate for the UI, that will be used instead of the self signed one.
You can check access to both the HTTP and HTTPS urls with a ‘ping’:
$ curl http://{server}:48082/ping
hi from http receiver
$ curl -k https://{server}:48083/ping
hi from https receiver
Ruckus Zone Director
The Ruckus APs use the MQTT protocol to
communicate with the Kloudspot Analytics server. For this to work Port 8883
must be open from the Ruckus controller and APs to the Kloudspot Analytics
server:
Ruckus APs can send event data directly to the Kloudspot Analytics Engine. The following steps set this up.
- Go the the event sources screen in the Kloudspot Analytics Engine and enable the ‘Ruckus Zone Director’ source. Note the secret key and then restart the Stream Processing job.
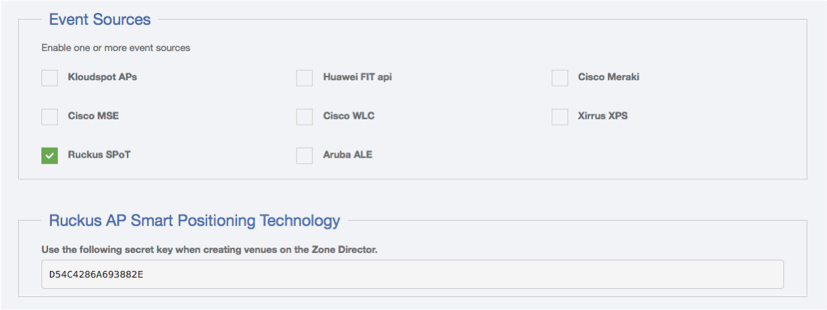
- Click ‘Save’
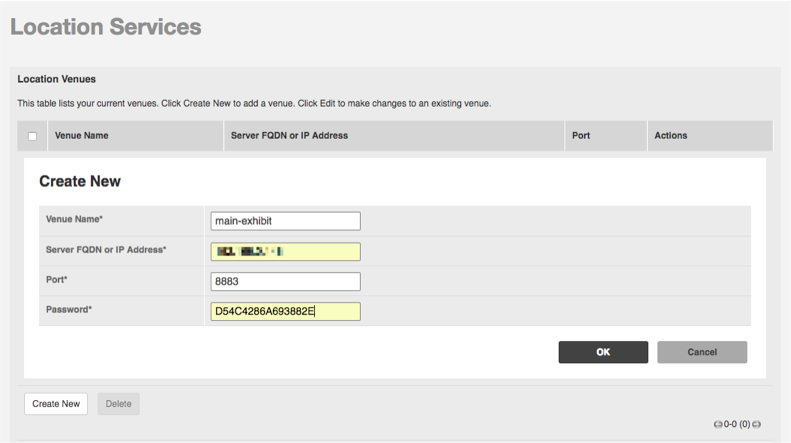
- Go to the Ruckus Zone Director. Login and select the Services & Profiles -> Location Services menu entry.
- Click ‘Create New’
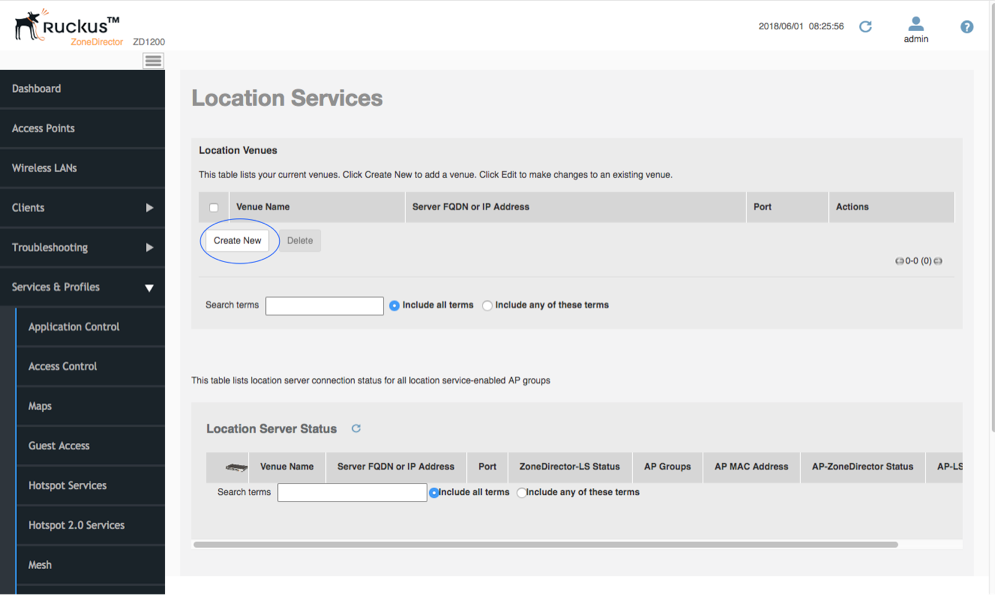
- Enter the required information including the secret key from above and click OK.
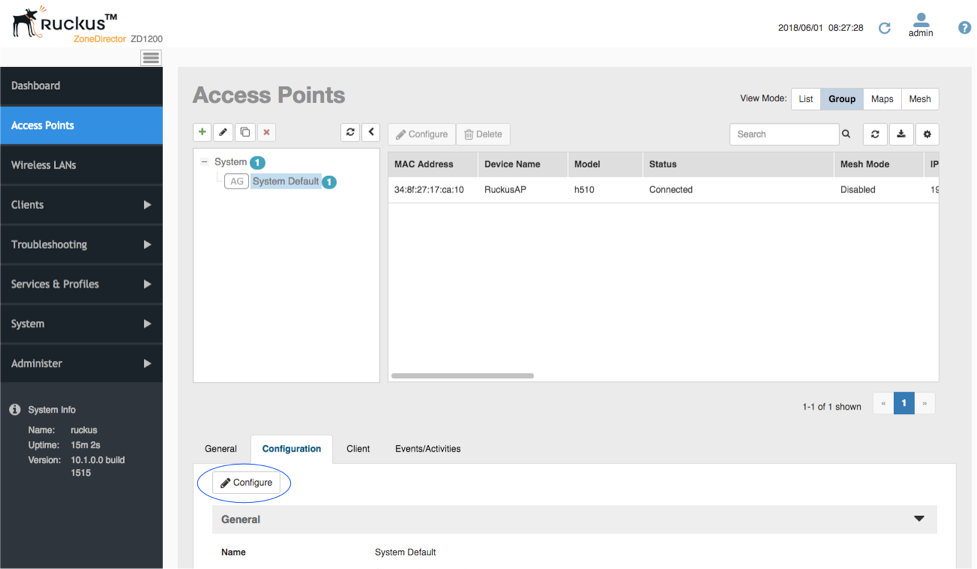
- Then select the Access Points menu entry. Select the access point group for which you want to send events. Click configure.
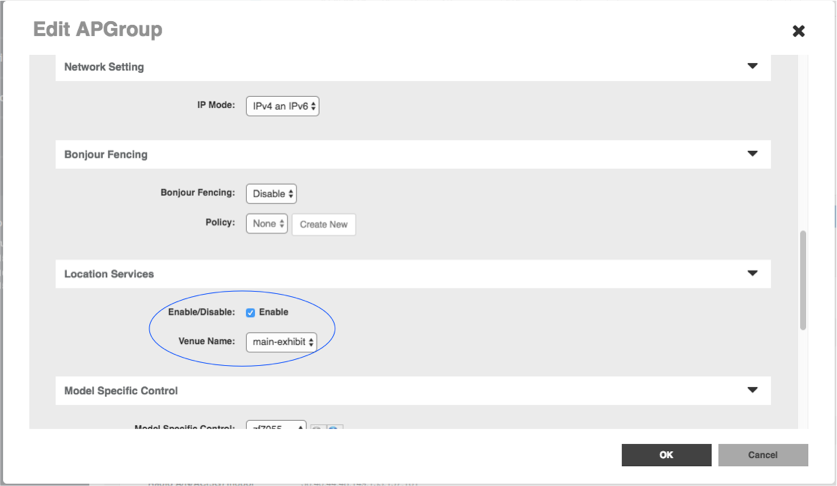
- Scroll down to Location Services and enable the venue we just set up. Click ‘OK’.
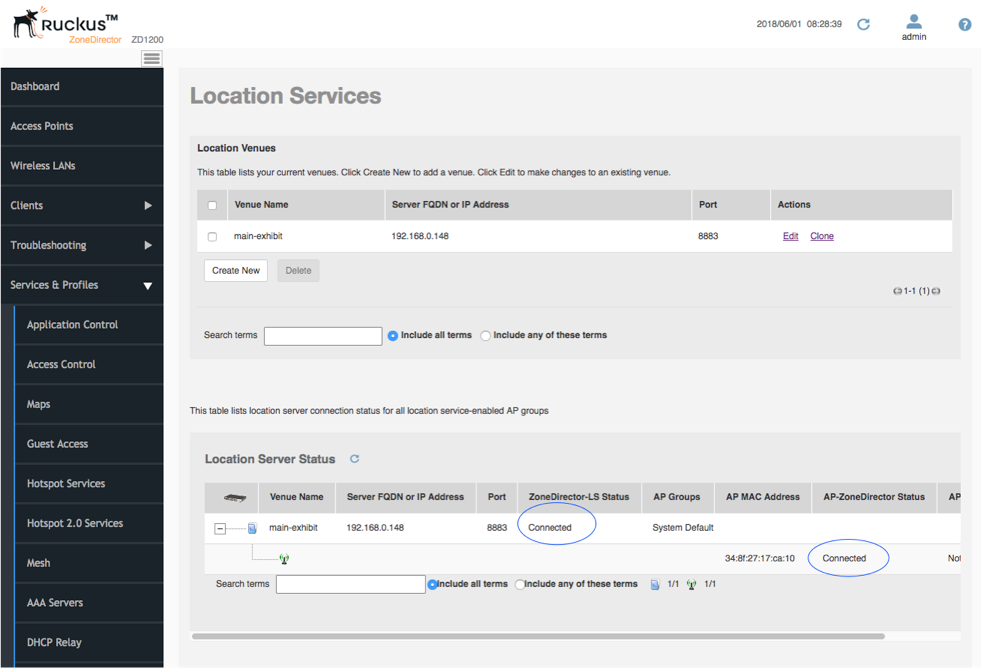
- Finally select the Services & Profiles -> Location Services menu entry. You now see the director and the APs all showing connected status.
Check Event Reception
Login to the Analytics Engine via SSH and run the kafka-listen command:
$ kafka-listen
{"vendor": "Kloudspot", "eventType": "PRESENCE", "location": null,..
{"vendor": "Kloudspot", "eventType": "PRESENCE", "location": null,..
{"vendor": "Kloudspot", "eventType": "PRESENCE", "location": null,..
{"vendor": "Kloudspot", "eventType": "PRESENCE", "location": null,..
You will be able to see the ‘raw’ event feed going into the stream processing.
Xirrus XPS
Overview
The Kloudspot Analytics Engine can receive events from many types of WiFi network.
One or more of event sources can be configured in the ‘Configuration - > Event Processing - > Wi-Fi’ screen.
Validate the Receiver URLs
Most of the receivers below ‘push’ to a specific URL. The protocol (HTTP/HTTPS) used varies depending on the source. We support both HTTP and HTTPS protocols using port 48082 and 48083. Refer to the specific data source below to determine the correct one to use.
If you have set a SSL certificate for the UI, that will be used instead of the self signed one.
You can check access to both the HTTP and HTTPS urls with a ‘ping’:
$ curl http://{server}:48082/ping
hi from http receiver
$ curl -k https://{server}:48083/ping
hi from https receiver
Xirrus XPS
The Kloudspot Analytics Engine can receive location update events from the Xirrus Positioning System (XPS) as follows:
- Enable the Xirrus Event source in the Kloudspot Analytics Engine.
- Next login to XPS, click on API Docs
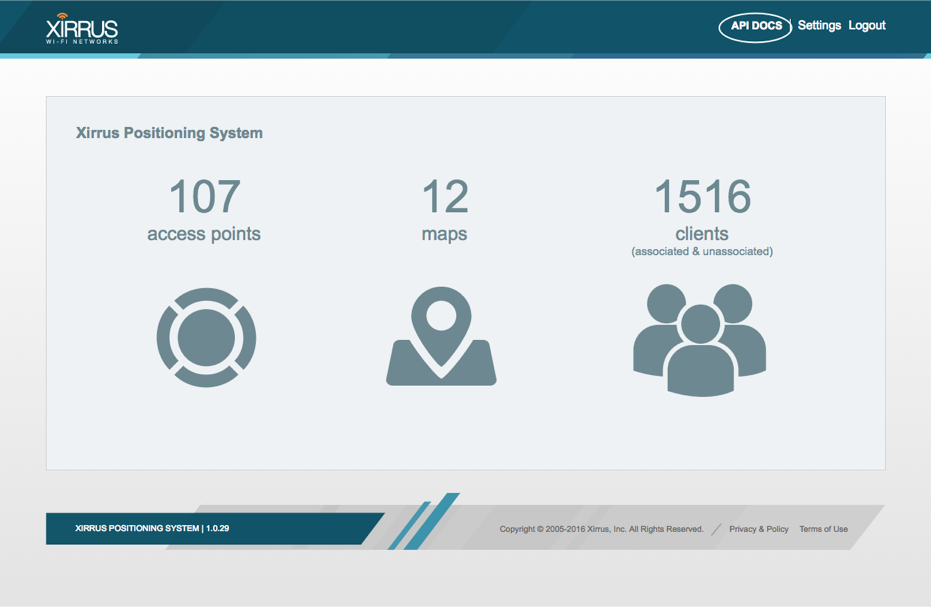
-
Then add a new forwarding job with the following URL:
http://{server}:48082/xirrus
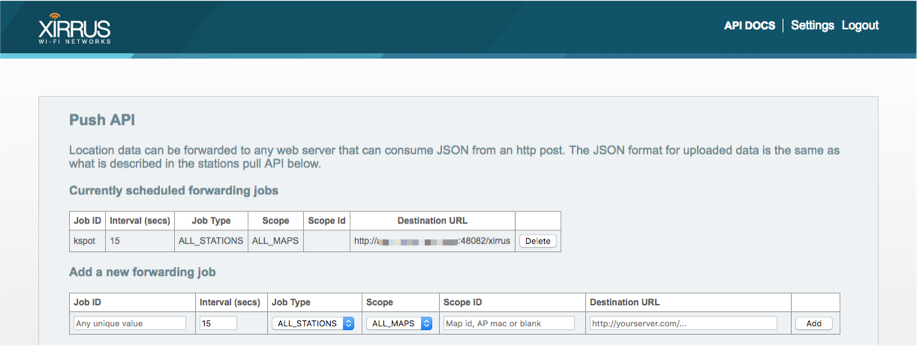 You should immediately start receiving
events from the XPS.
You should immediately start receiving
events from the XPS.
The feed sent from the XPS doesn’t include information about APs. In order to deal with this, some special configuration (including setting an External Reference ID) is needed when setting up the location configuration in the Analytics Engine. Please ask your Klouspot contact with help setting this up.
Check Event Reception
Login to the Analytics Engine via SSH and run the kafka-listen command:
$ kafka-listen
{"vendor": "Kloudspot", "eventType": "PRESENCE", "location": null,..
{"vendor": "Kloudspot", "eventType": "PRESENCE", "location": null,..
{"vendor": "Kloudspot", "eventType": "PRESENCE", "location": null,..
{"vendor": "Kloudspot", "eventType": "PRESENCE", "location": null,..
You will be able to see the ‘raw’ event feed going into the stream processing.