Meraki Integration
About this Document
The purpose of this document is to display how these various solutions offered
by Kloudspot can be integrated with Meraki.
It covers the following Kloudspot solutions that can be integrated.
- KloudPortal - Wi-Fi Guest Portal
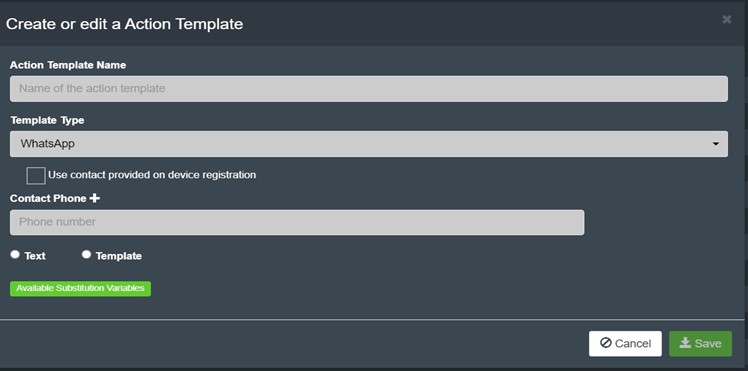
- KloudCampaign - Campaign management
- KloudVision- Camera Integration
- KloudInsights - Event Wi-Fi & BLE receivers
Guest Portal and Campaign Management
Guest Portal
Captive Portals or Guest Portal is a multi-channel platform that enables you
to connect and engage with visitors on your premises.
Guest portal screen page allows to create and design a customizable portal
from scratch.
A sample of templates will be given as an option to choose to create a portal,
layout will be available as a part of the template.
Following are the steps to configure the Guest Portal.
Captive Guest Portal Configuration
The captive portal is designed with following terms that are described below:
Needs authentication using social platforms as Facebook, Twitter, Linked,
Google and Instagram.
It will ask the user for their Name and Email address to be able to
Authenticate.
It asks the user for their contact number and authenticate over a SMS.
A token is generated by the admin. User can use this token for authentication.
One or multiple devices can be configured to use a single token.
A guest user can be created by generating a unique username and password which
is used for authentication. One or multiple devices can be configured using
individual username/password combination.
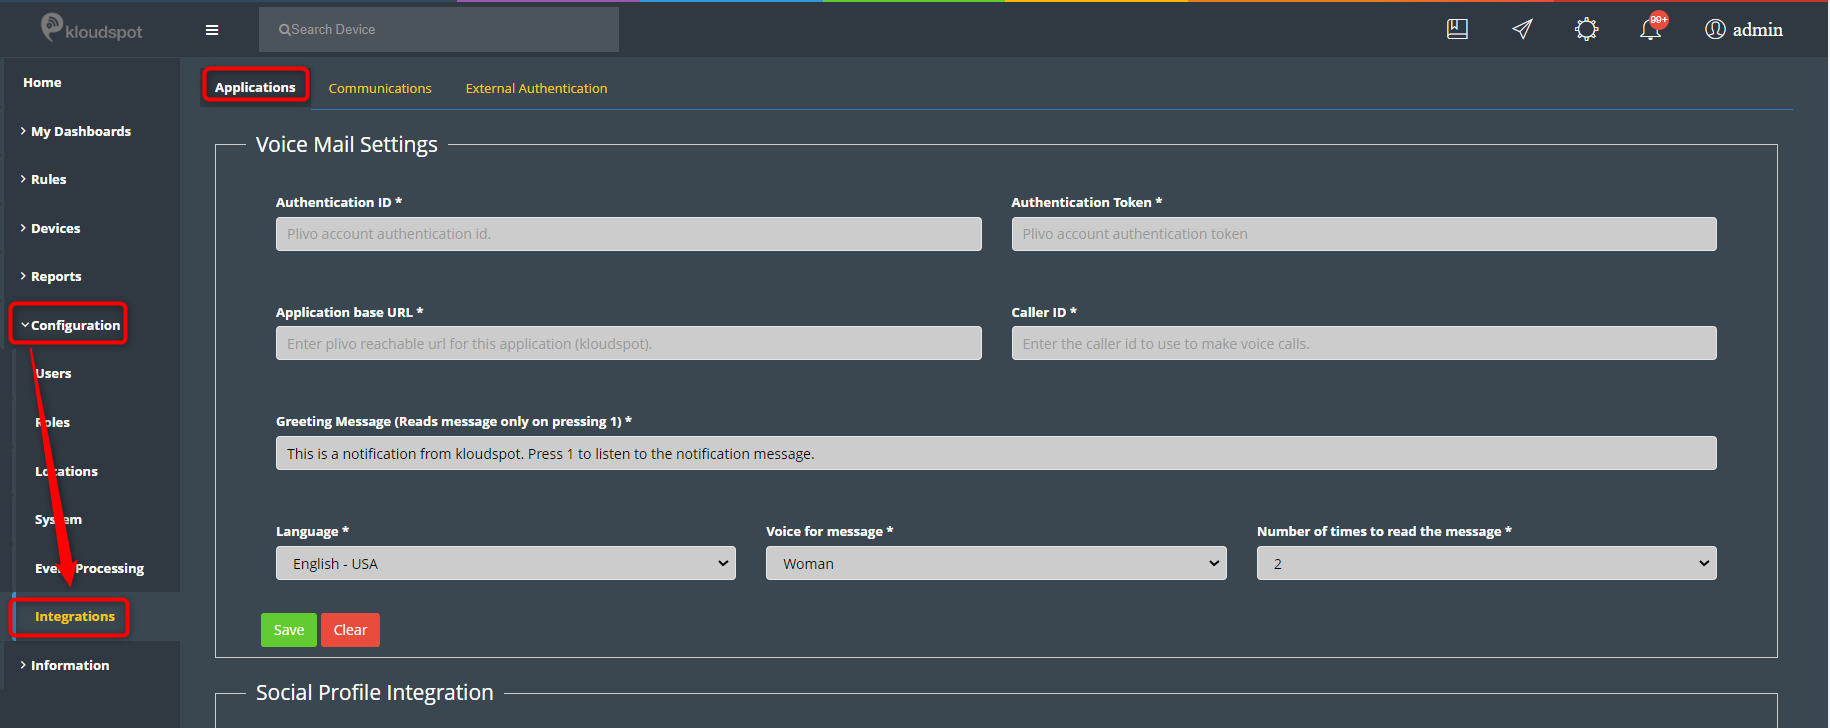
- Third party
Kloudspot can integrate with various third-party applications such as,
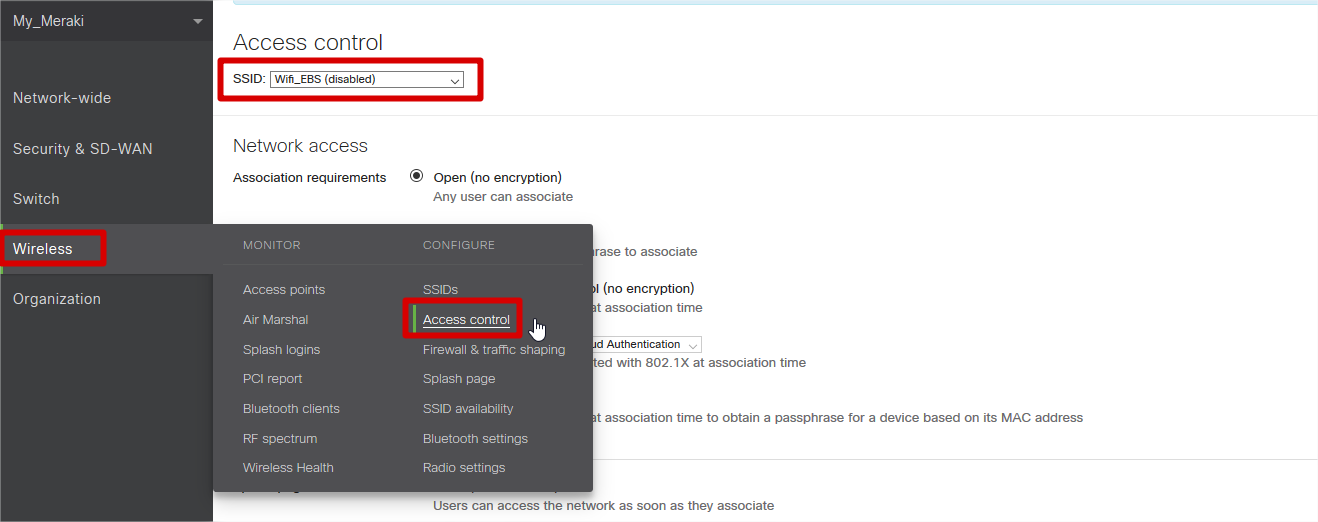
- Enter ‘Wireless’ à ‘Access Control’
- Choose the SSID to which the Captive portal will be configured.
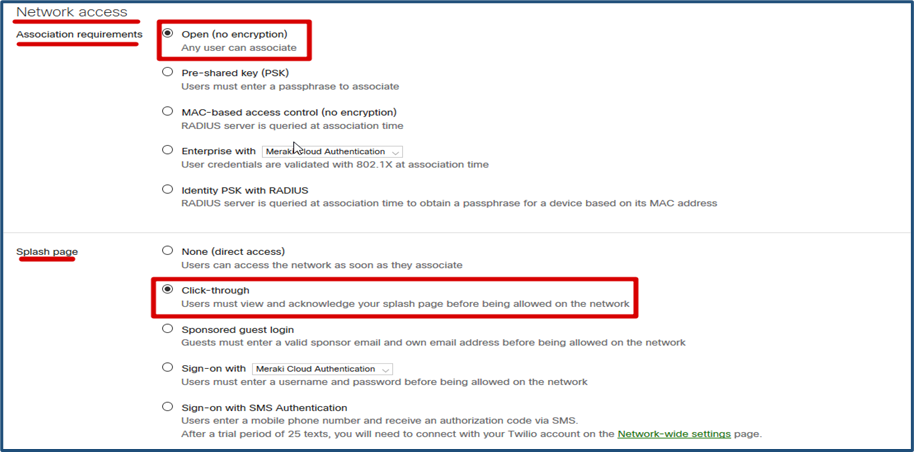
- In Network Access, Association requirement, Select ‘Open (no encryption)’.
- In Network Access, Splash page, Select ‘Click-through’.
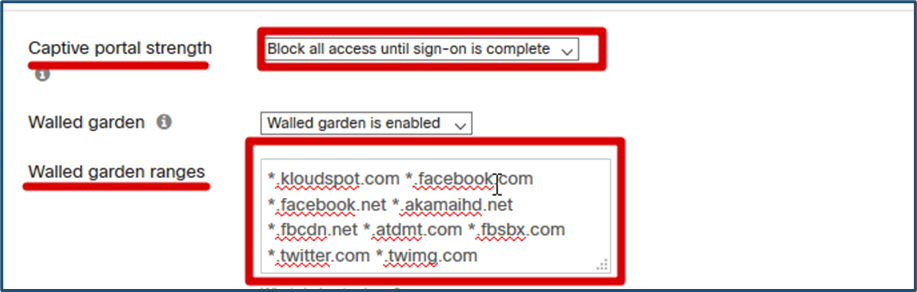
- In Network Access, Captive portal strength, Select ‘Block all access until sign-on is complete’
- In Network Access, Walled garden ranges, Enter the following domains:
_.kloudspot.com _ .facebook.com _ .facebook.net _ .akamaihd.net _ .fbcdn.net _ .atdmt.com _ .fbsbx.com _. twitter.com \* .twimg.com
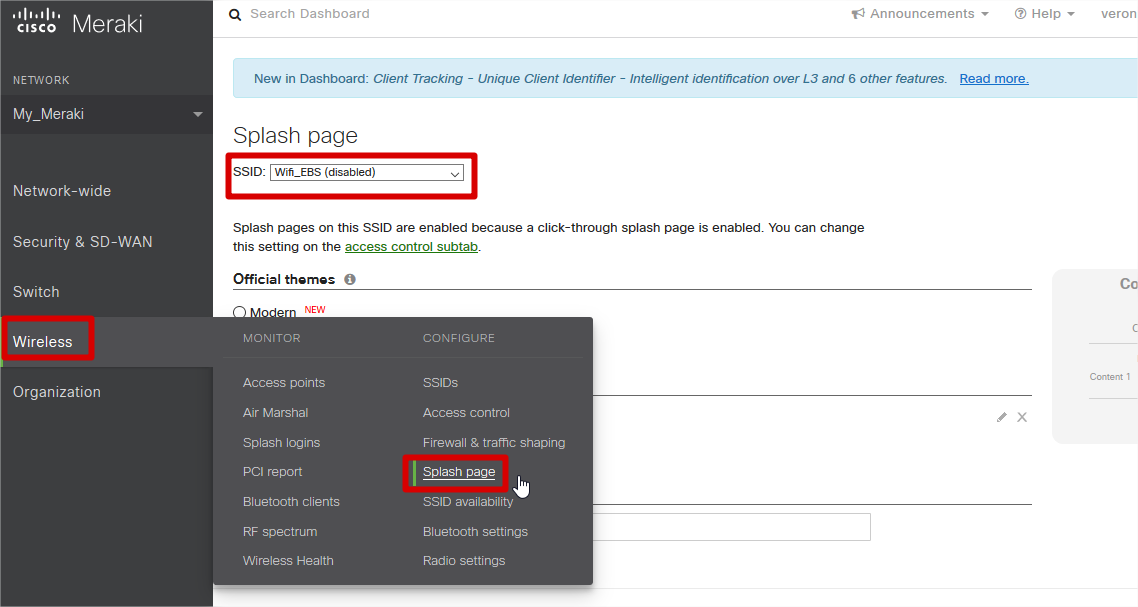
- Enter Wireless, click on ‘Splash page’.
- Choose the SSID to which the captive portal will be configured.
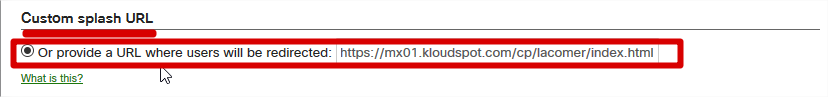
- On ‘Splash page’, Custom splash URL, enter the url below;
https://mx01.kloudspot.com/cp/lacomer/index.htm
For more details on how to create template and workflow driven portal, please
refer to the relevant Kloudspot documentation.
Campaign Management
Kloudspot has a powerful workflow and policy driven campaign management
solution centered mostly around Wi-Fi which offers both online and offline
campaigns. These online campaigns can be created and managed using Captive
Guest Portals. Creation of Captive guest portals is extremely easy using one
of many templates supported by KloudCampaign Editor. KloudCampaign Editor can
help guide the user to create a captive portal for the hardware they have
deployed on the network.
For more details on how to create Campaigns, resources and configure dynamic
policies and workflows, please refer to relevant Kloudspot documentation.
Meraki WiFi and BLE Event Receivers
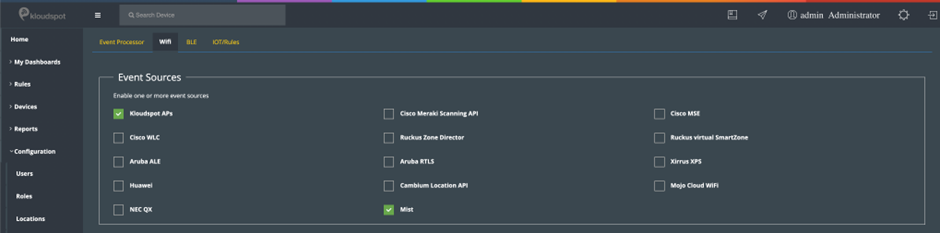
The Kloudspot Analytics Engine can receive events from many types of Meraki
Wi-Fi network.
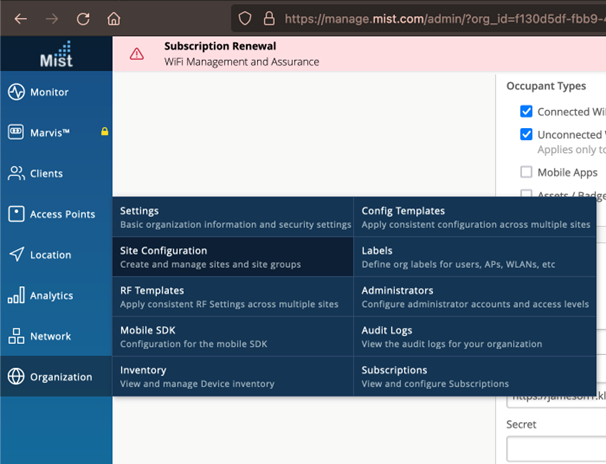
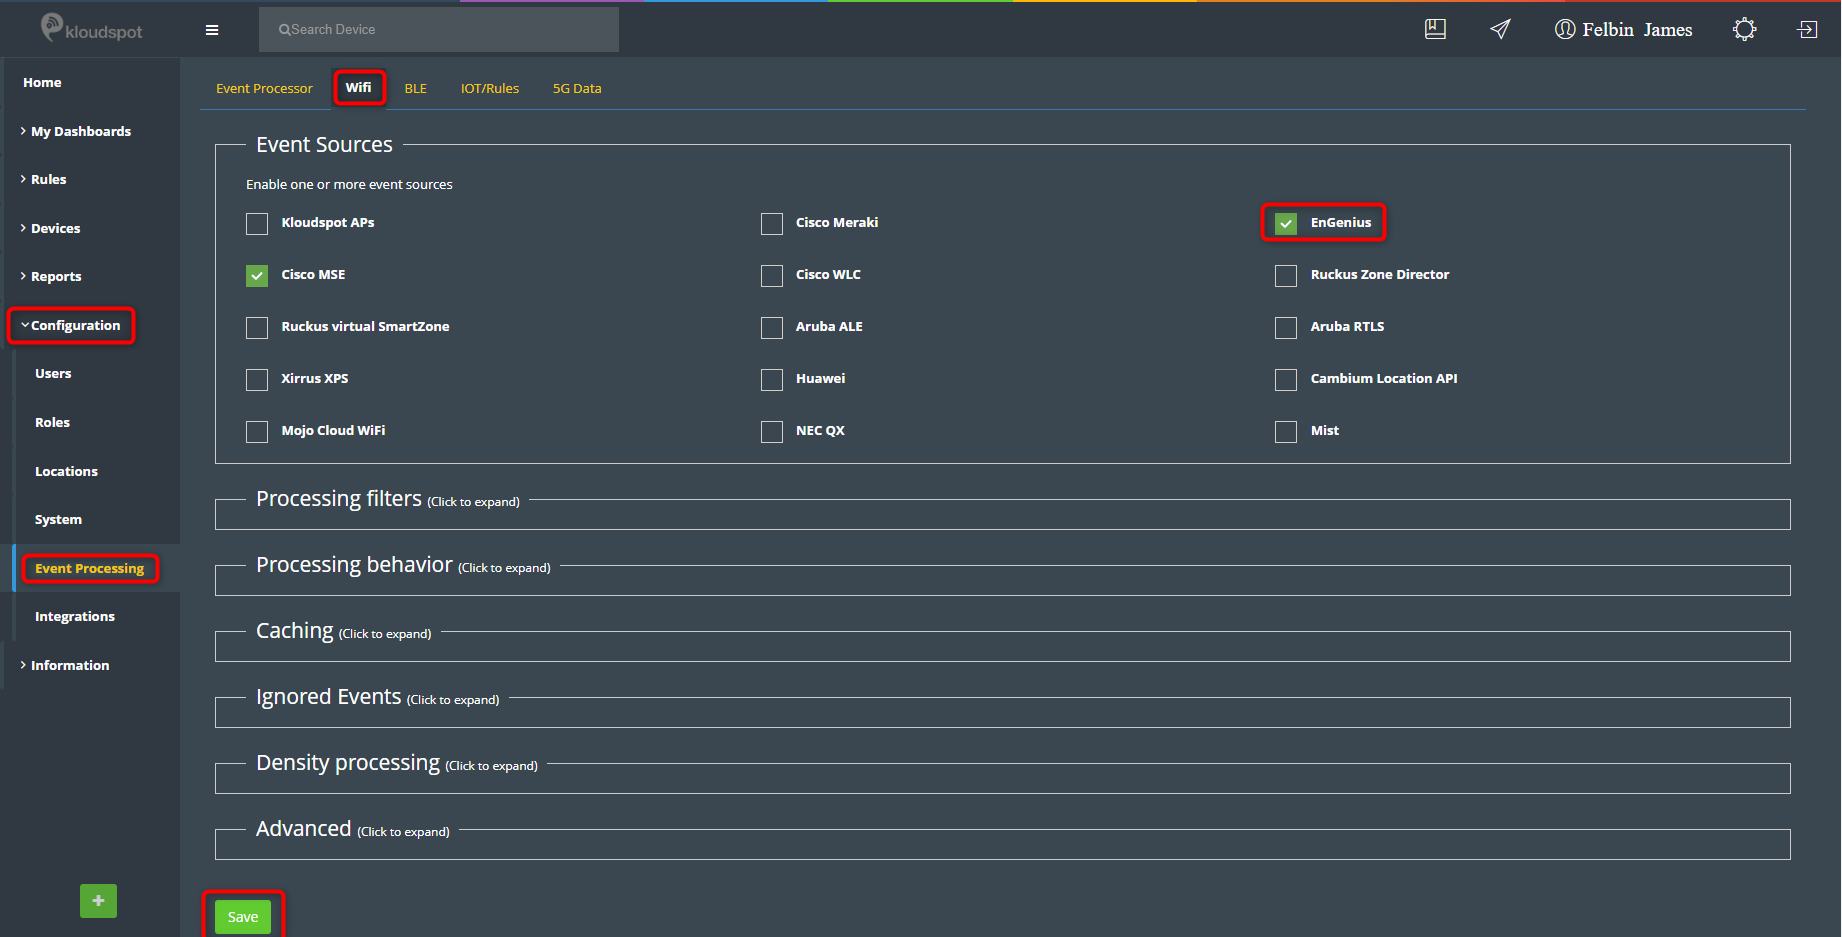
One or more of event sources can be configured in the ‘Configuration - >
System -> System Configuration’ screen.
Validate the Receiver URLs
Most of the receivers below ‘push’ to a specific URL. The protocol
(HTTP/HTTPS) used varies depending on the source. We support both HTTP and
HTTPS protocols using port 48082 and 48083. Refer to the specific data source
below to determine the correct one to use.
If you have set a SSL certificate for the UI, that will be used instead of the
self-signed one.
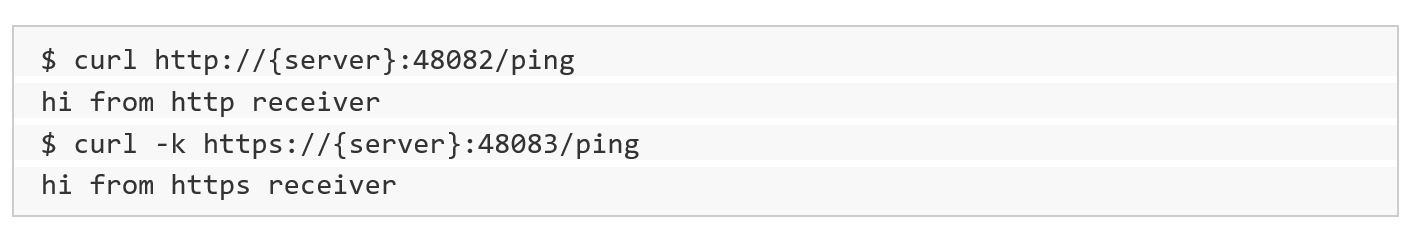
You can check access to both the HTTP and HTTPS urls with a ‘ping’:
Meraki Location Scanning API
To enable, the Meraki scanning API feed, follow the following steps:
- First, follow the Meraki Standard instructions in the Meraki manual to set up the Scanning API on each Meraki account.
Location Analytics - Cisco
Meraki
https://documentation.meraki.com/MR/Monitoring_and_Reporting/Location_Analytics
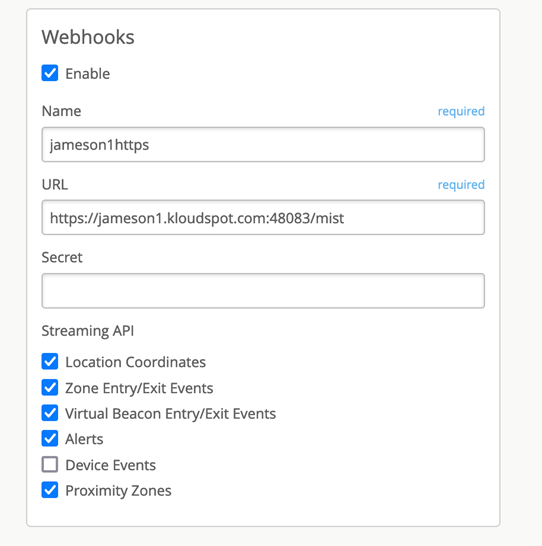
When enabling the API, set the following parameters:
- API Version : 2
- Post URL : https://{server}:48083/meraki/{name}
- Secret : for example - kloudspot12345678

For ‘{name}’ use a friendly alphanumeric label for the account.
- Next go to the Kloudspot Web UI and select ‘Cisco Meraki’ source in the Event Sources.
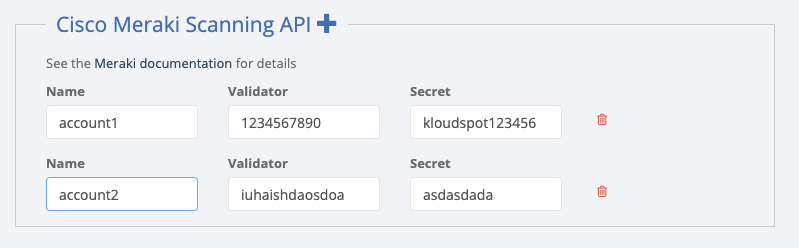
- Add an entry for each account (one is enabled by default) by clicking the ‘+’ sign.
- Enter the ’name’, ‘validation’ and secret’ from above for each account and click ‘Save’.
- Restart the stream processing job.
Integrating Meraki Cameras
Kloudspot supports integration with both RTSP (MV*2 cameras only) and MV Sense
APIs. RTSP video stream from Meraki second generation camera’s can be streamed
on-prem to Kloudspot vision controller for complex actionable use cases
including Object detection, PPE, Mask, Social distancing, capacity counts and
management, demographics, and fingerprinting.
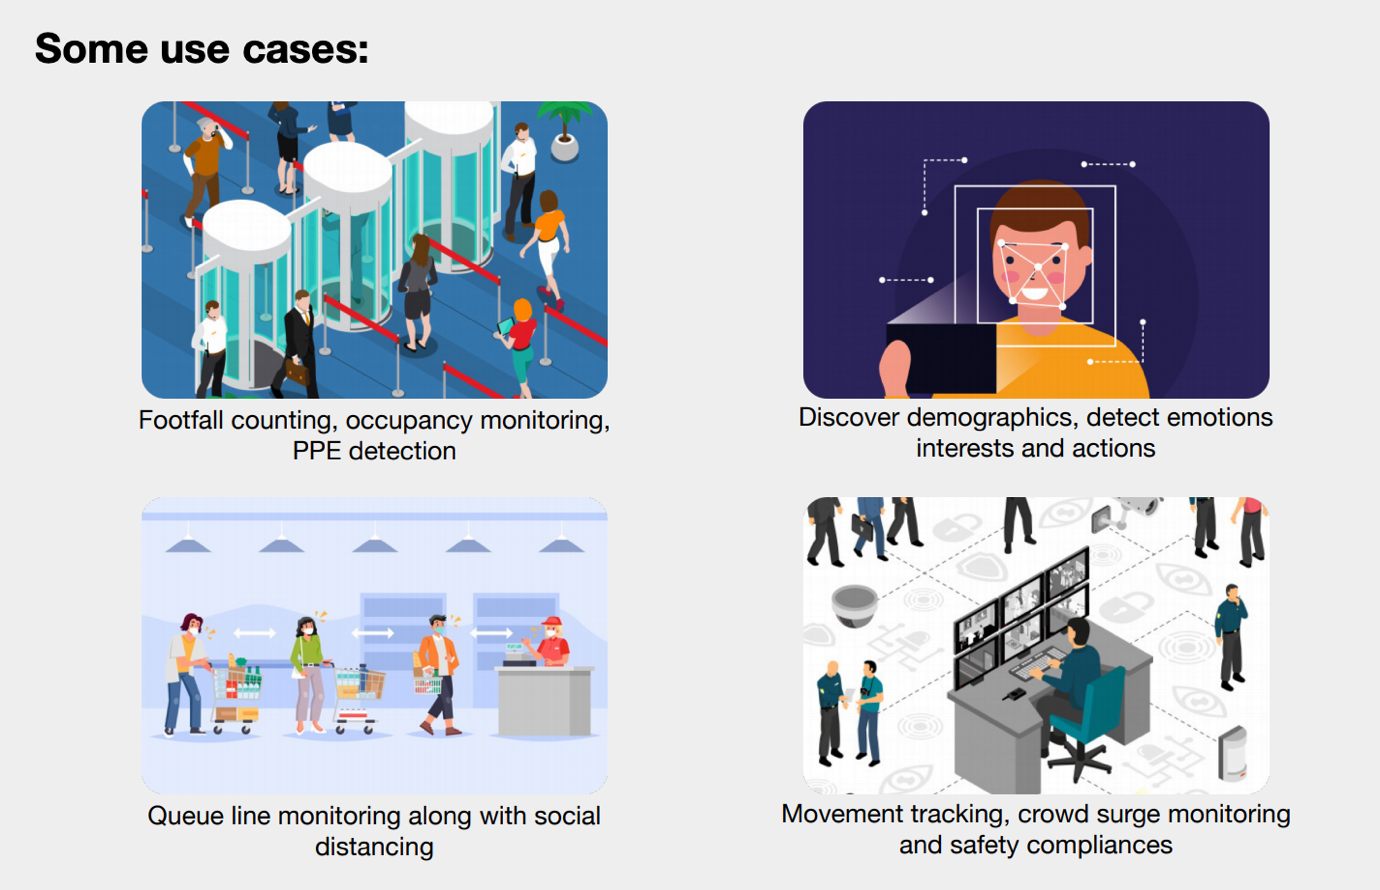
Insights inferred from RTSP stream
For more details on KloudVision __ please check out the KloudVision document.
RTSP Integration
Please refer to Meraki documentation on how to setup Meraki RTSP configuration
to stream live video
https://documentation.meraki.com/MV/Advanced_Configuration/External_RTSP
Also refer to Kloudspot documentation on how to setup Meraki RTSP
configuration
Add cameras to the controller
MV Sense Integration
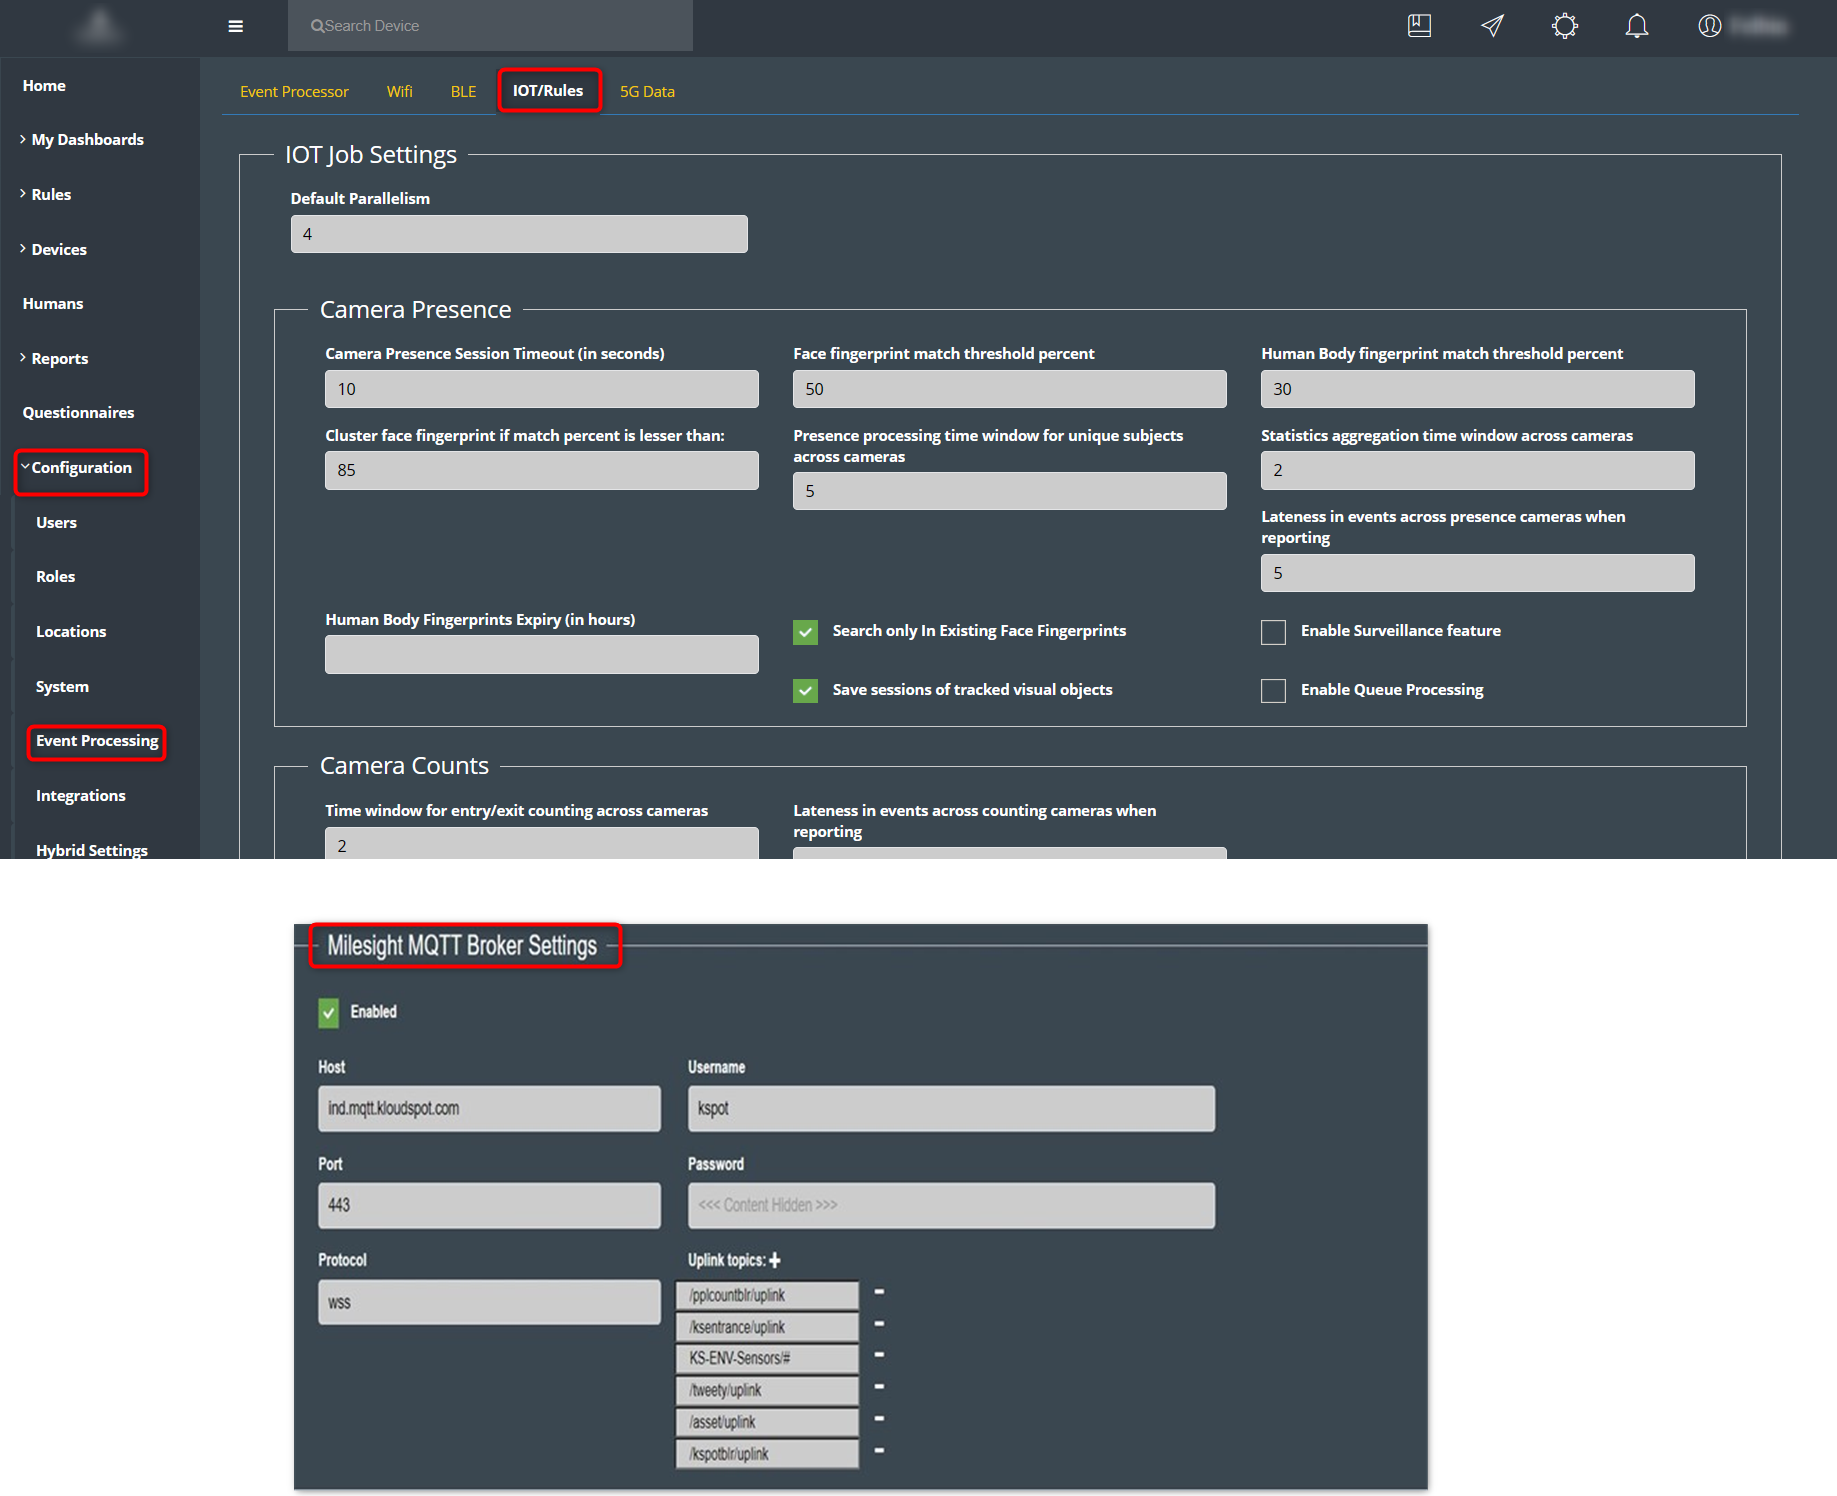
Step 1: Port number 6666(TCP) should be exposed to send Meraki camera payloads
to the Insights.
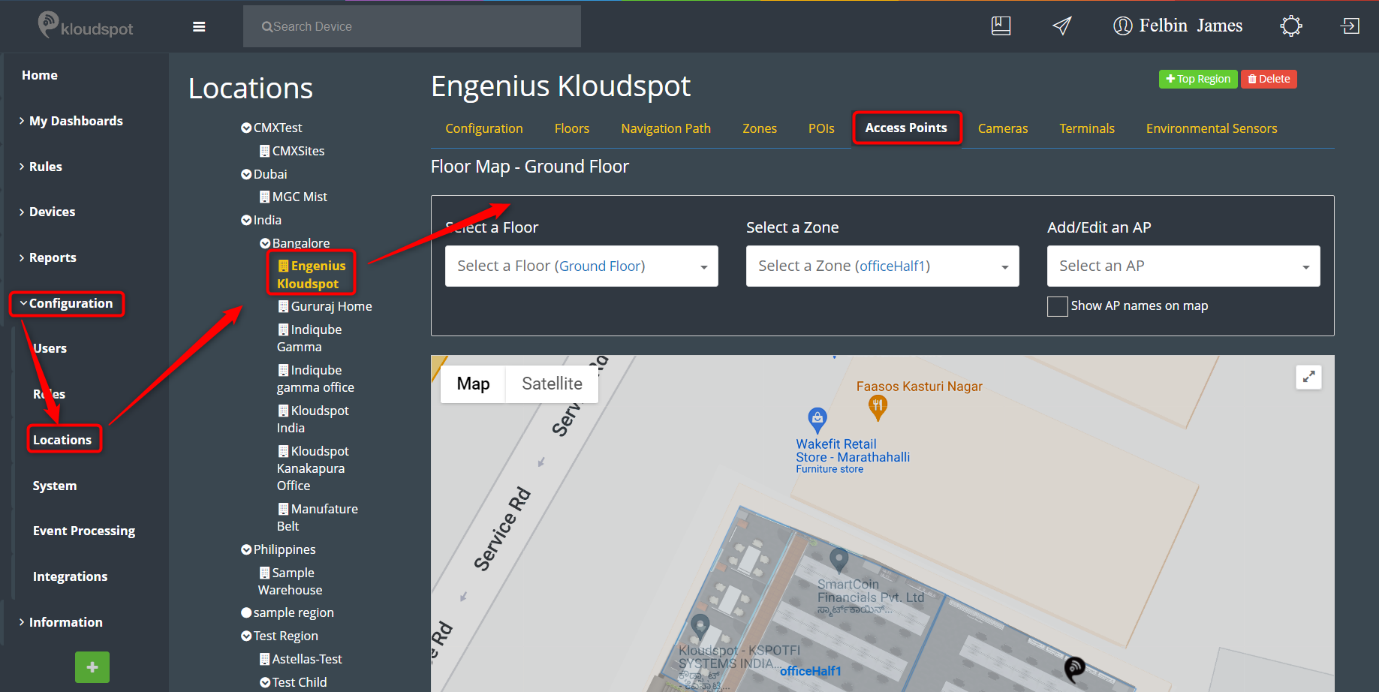
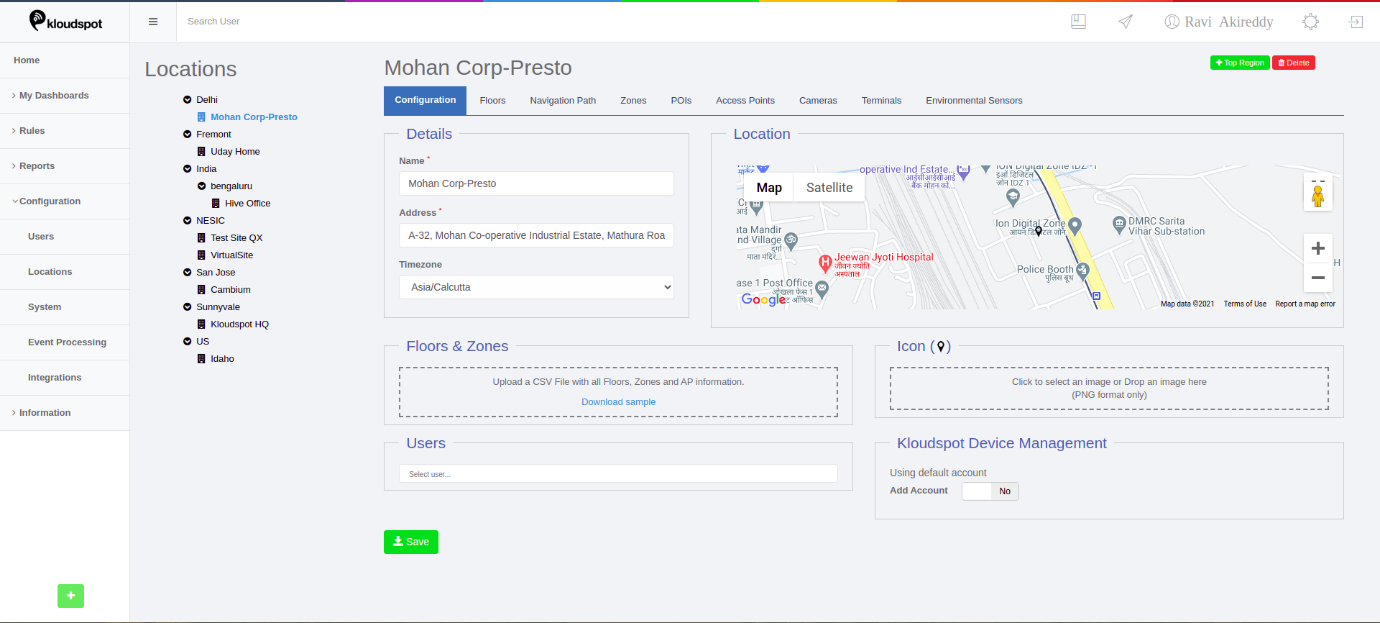
Step 2: On UI, go to configurations and click on locations. Add the location
(Region/site) where the cameras need to be deployed. Then navigate to the
‘Cameras’ section.
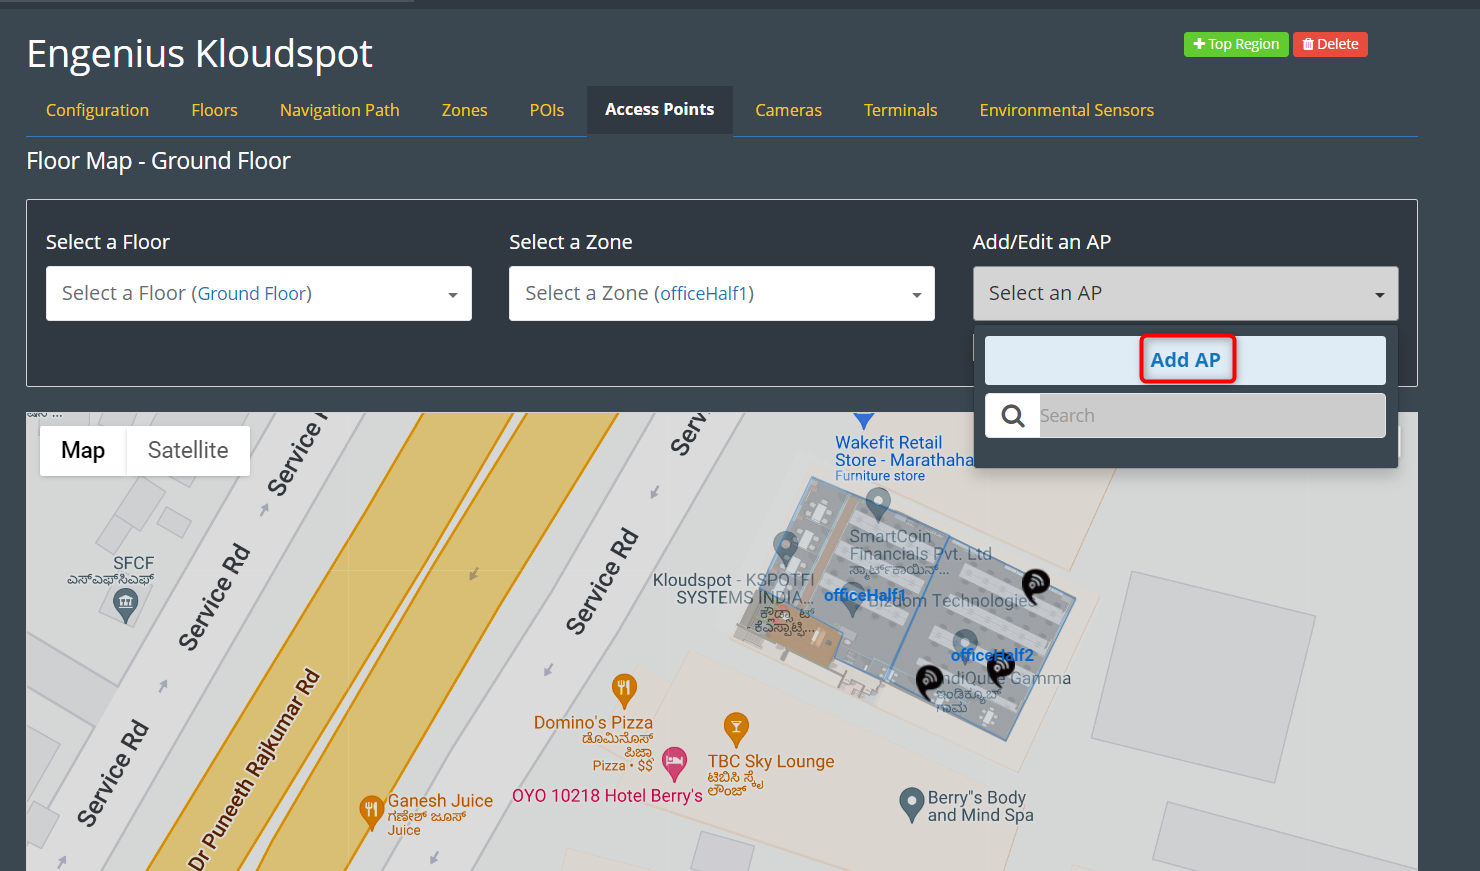
Step 3: Click on the ‘Cameras’, select the floor and the zone to which you
want to add the camera and click on ‘add/edit a camera’ and then click on “Add
a Camera” as shown in figure below.
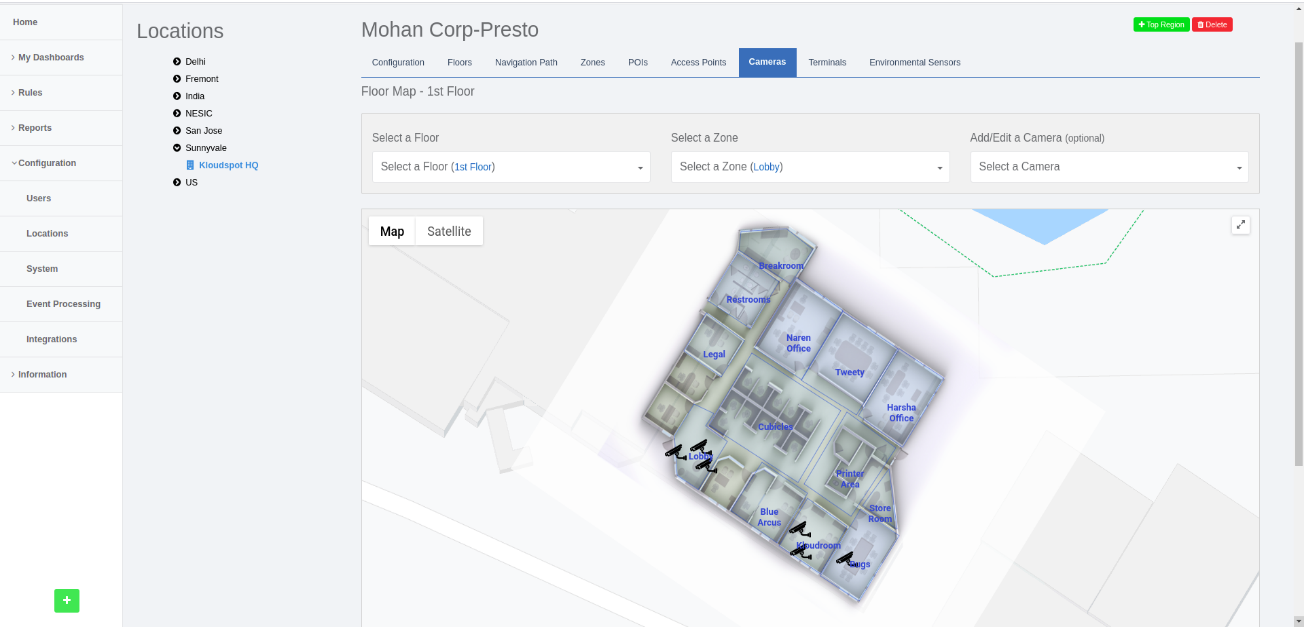
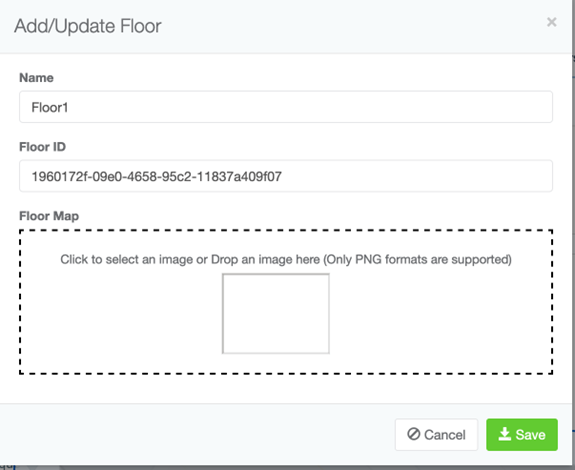
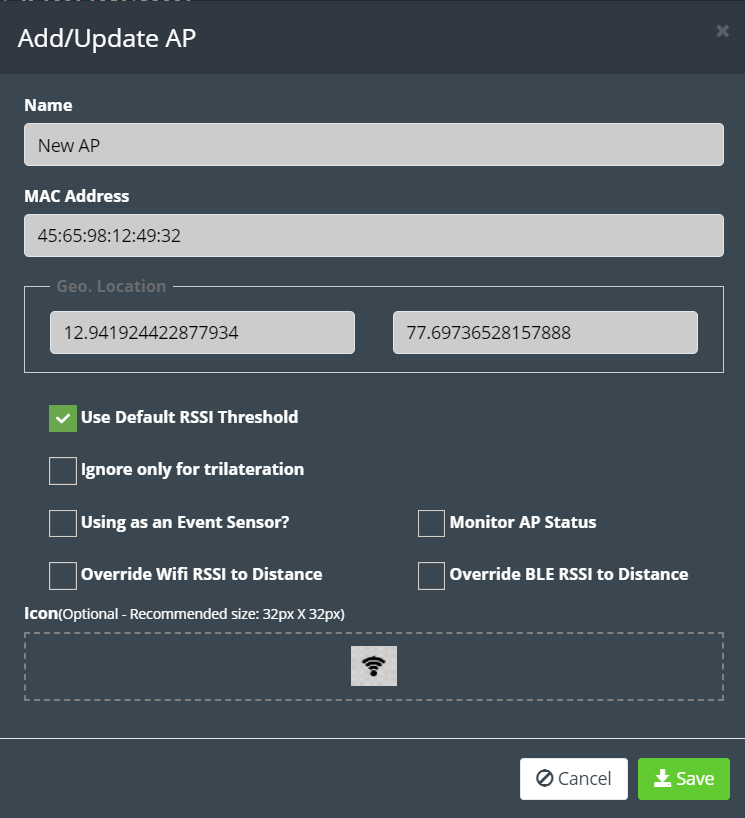
Step 4: ‘Add/Update Cameras’ dialogue box needs to be filled with following
information.
- Choose the vendor as ‘Third Party Camera’.
Enter the Unique Id of the Meraki Camera in ‘camera name’ section.
- Upload the image that is seen by the camera in “PNG” format in the “camera Image” section (Image size less than 2MB).
- Choose the grid resolution for the camera through the slider (default value is 50px) in the advance settings.
- Click on ‘Save’ to add the camera.
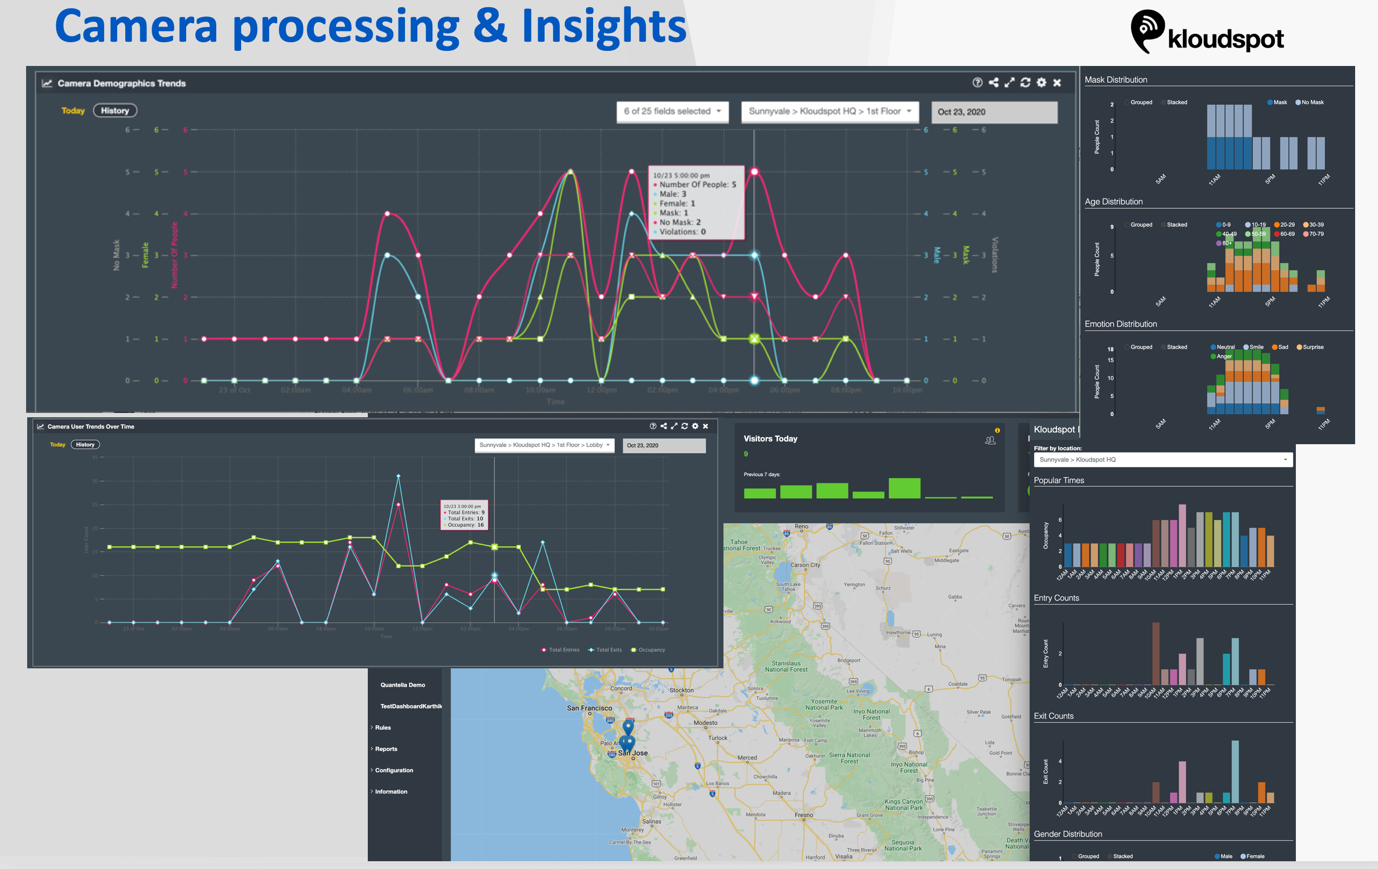
Adding widgets which use Meraki payloads to the dashboard
Step 1: On the homepage, navigate to ‘My Dashboards’ and select an existing
dashboard or create a new dashboard.
Step 2: On the selected dashboard scroll down to the bottom and click on the
‘+’ symbol to add widgets to the dashboard.
‘Live Movement on a Camera Image’ Widget
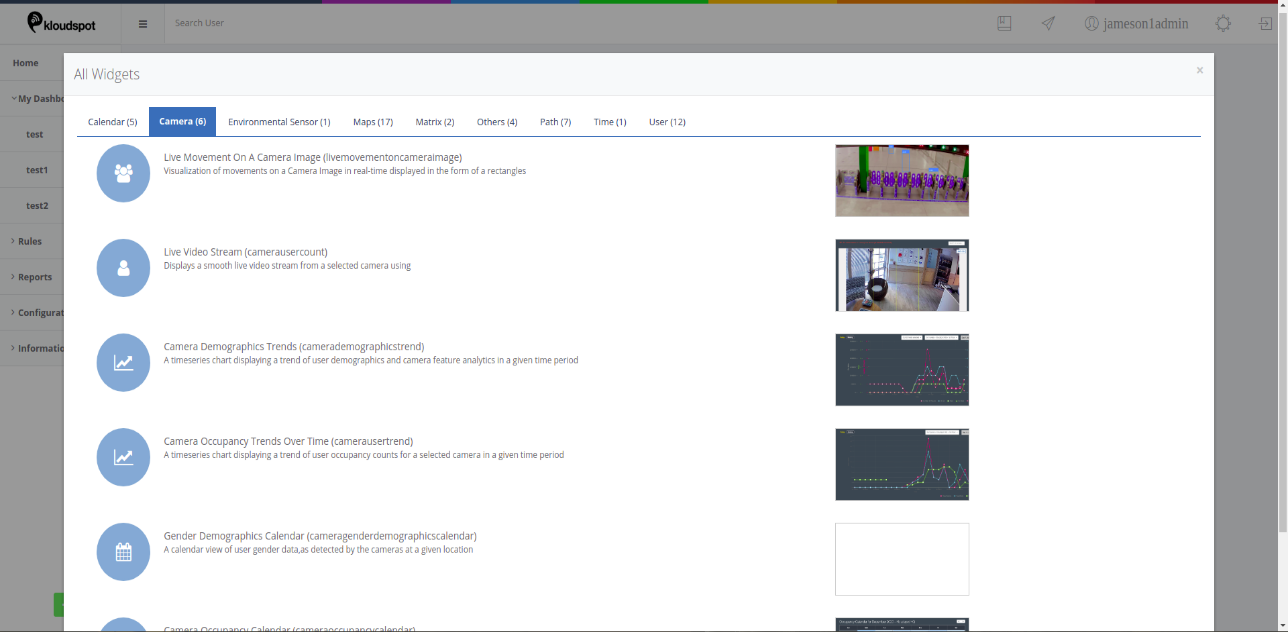
Step 1: To add the ‘Live Movement on a Camera Image’ widget navigate to the
‘Camera’ section and select ‘Live Movement on a Camera Image’ widget.
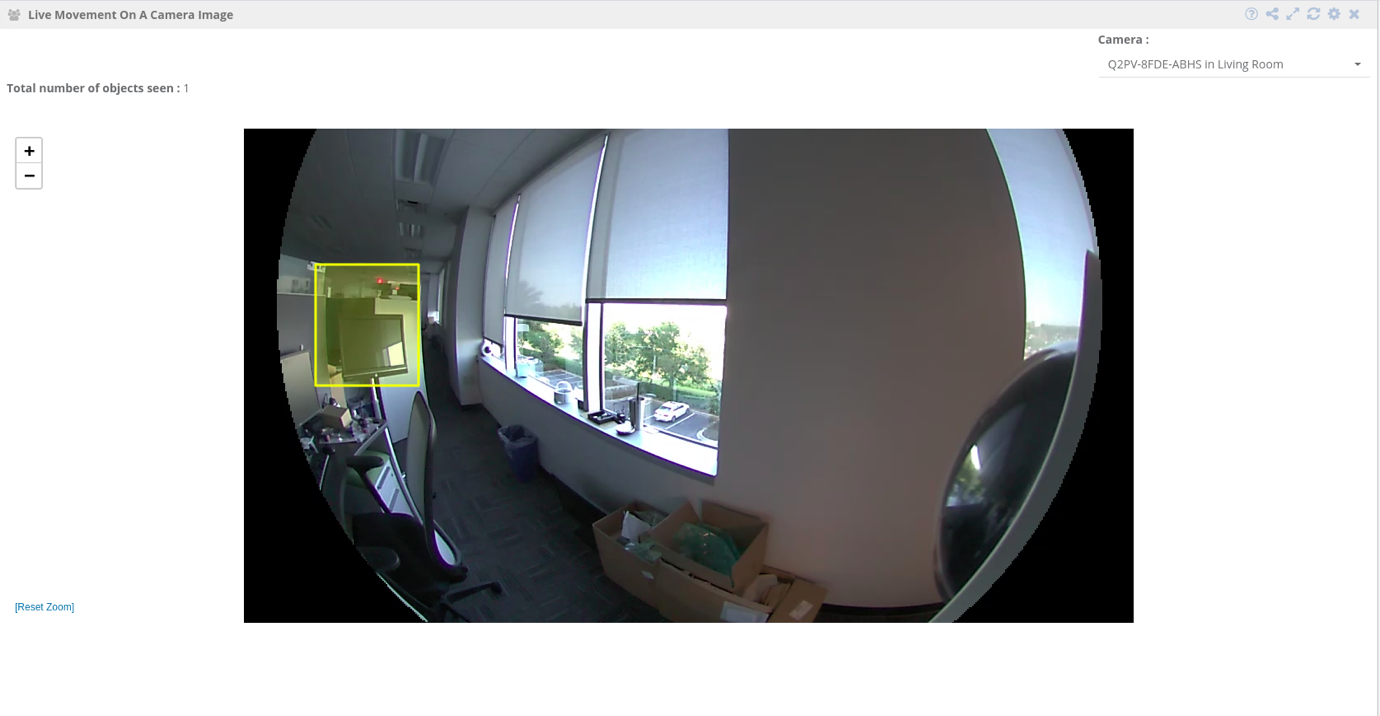
Step 2: Select the location in which the camera is configured through the
‘Settings’ option by clicking on the gear symbol.
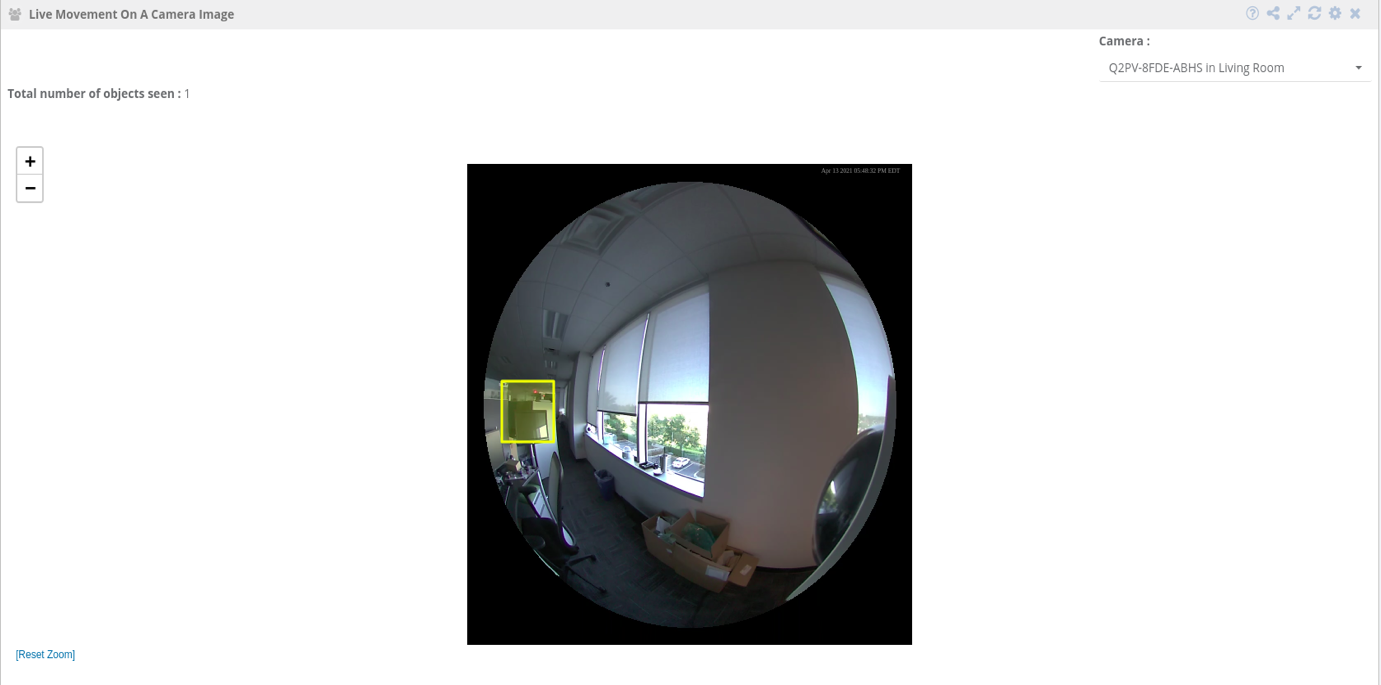
Step 3: Select the camera for which you want to see the live movements.
Step 4: Once the camera is selected the live movements of the objects are seen
on the camera image in the form of rectangles. User can hover over the
rectangle to get more details of the object.
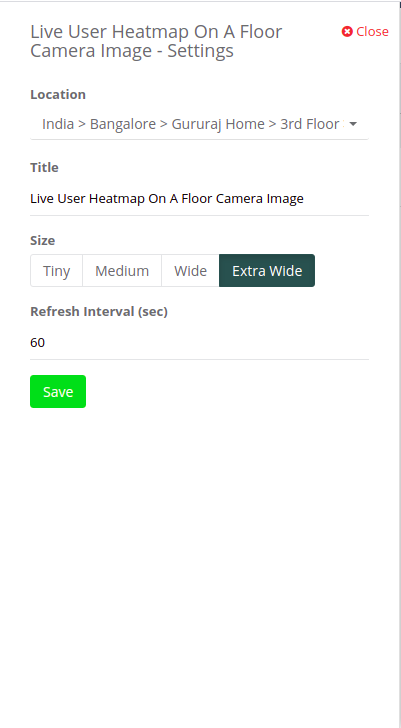
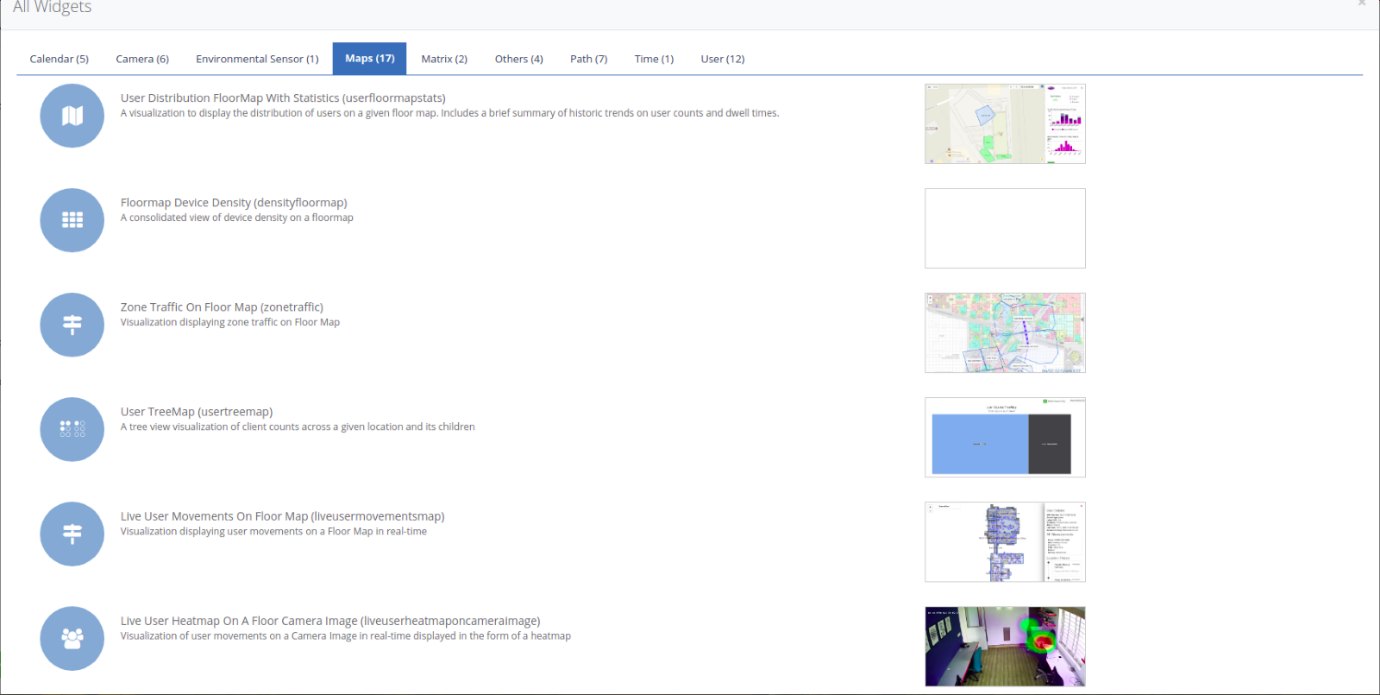
‘Live user heatmap on floor camera image’ Widget
Step 1: To add the ‘Live User Heatmap On Floor Camera Image’ widget navigate
to the ’Maps’ section and select ‘Live User Heatmap On Floor Camera Image’
widget.
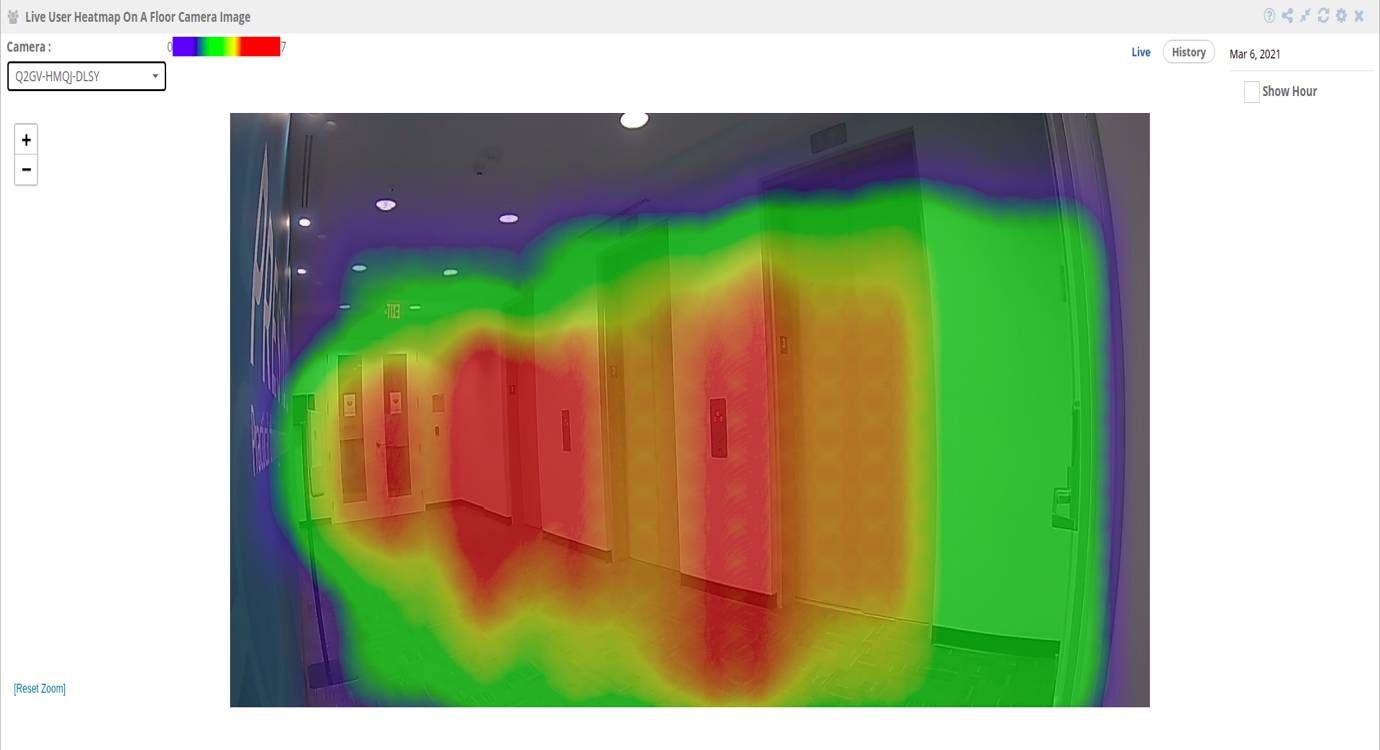
Step 2: Select the location in which the camera is configured through the
“Settings” option.
Step 3: Select the camera for which you want to see the heatmap.
Step 4: Clicking on the “Live Option” enables the user to view the live
heatmap.
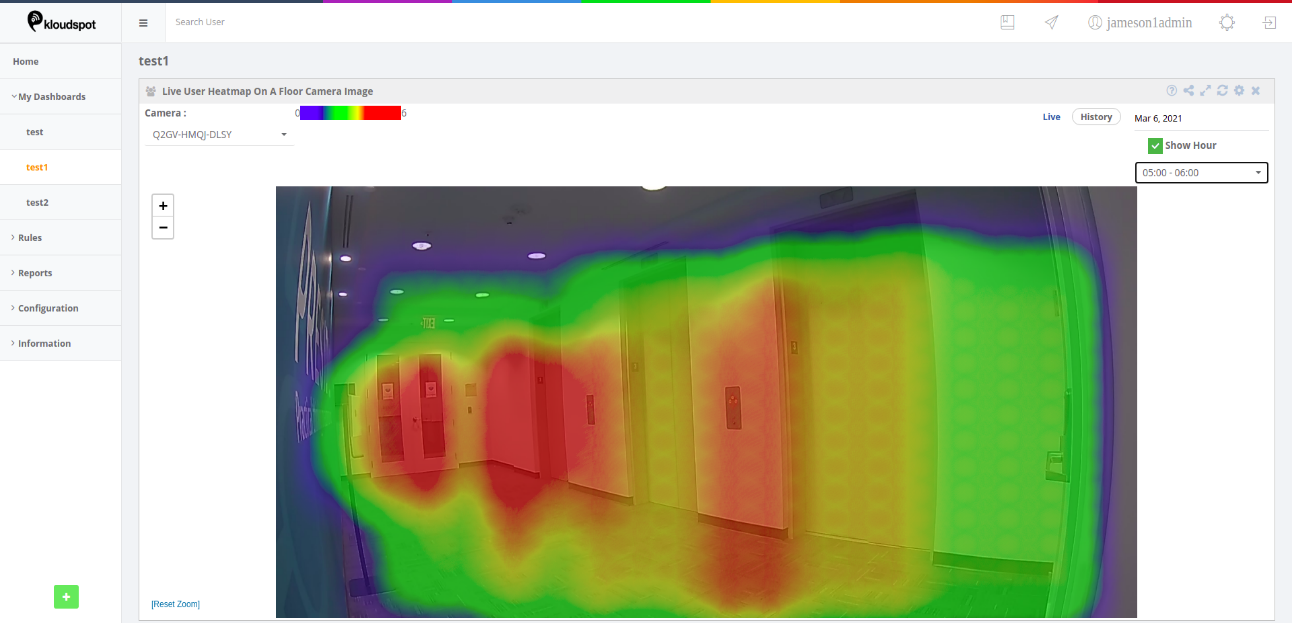
Step 5: Clicking on ‘history’, allows the user to view the heatmap for a
specific day. The user can choose/pick any day from the date-picker.
Step 6: Clicking on the “Show Hour” checkbox enables the user to view the
heatmap data for any hour of the day.
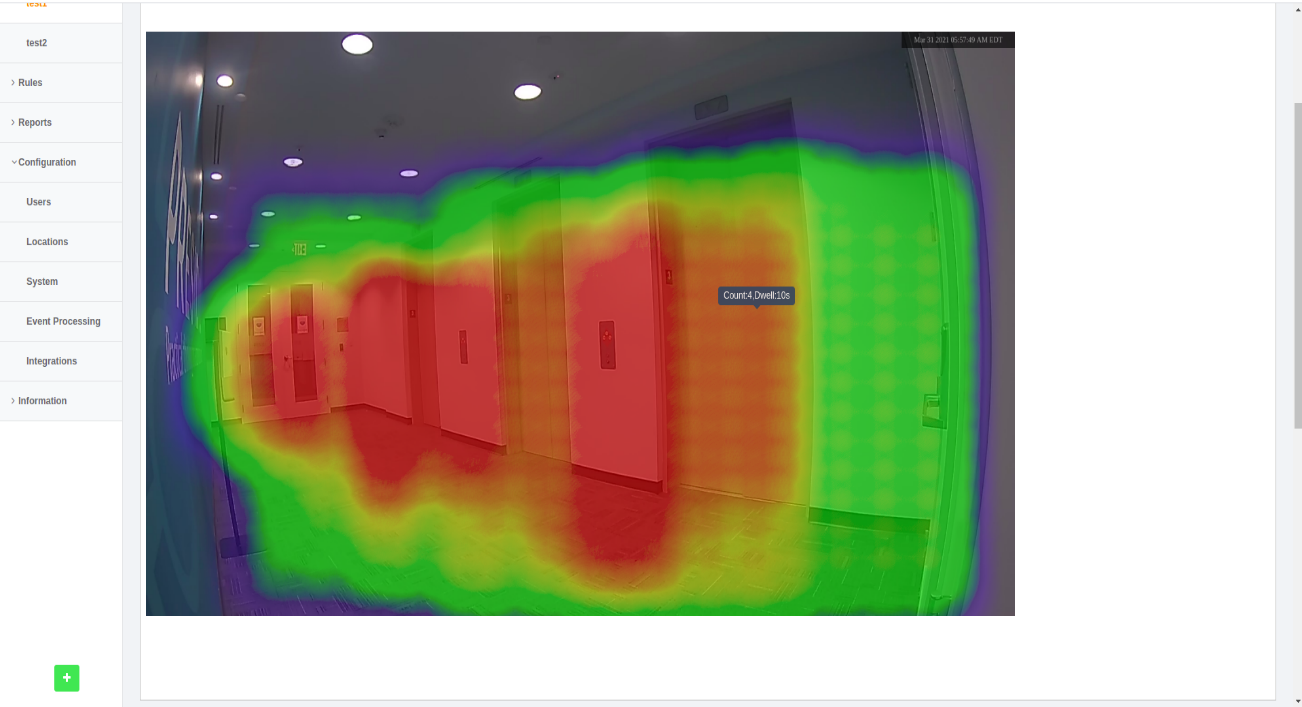
Step 7: A tooltip with the ‘count and dwell time’ can be seen when the user
just hovers over the heatmap.
Aruba IoT Integration
OVERVIEW
This guide describes steps necessary to set-up an IoT information feed from
Aruba Instant or ArubaOS to KloudInsights.
Aruba Instant documentation
- Aruba Instant User Guide.pdf (chapter “BLE IoT for Data Communication”)
- Aruba Instant CLI Reference Guide.pdf (chapter “iot transportProfile”)
ArubaOS documentation
- ArubaOS User Guide (chapter “IoT”)
- ArubaOS CLI Reference Guide.pdf (chapter “iot transportProfile”)
- ArubaOS API Guide (IoT Telemetry Interface)
REQUIREMENTS
Hardware
Aruba access points with integrated Bluetooth radios, or Aruba access points
equipped with an Aruba USB Bluetooth radio (LS-BT1USB, JW315A orJW316A), are
required for integration with KloudInsights.
Software
The integration uses the Aruba IoT Telemetry Interface to forward Bluetooth
device information that is collected by the access points to KloudInsights.The
Aruba IoT Telemetry Interface is available in Aruba Instant/ArubaOS 8.4.0.0 or
higher.
- Minimum required software version: Aruba Instant/ArubaOS 8.4.0.0
CONFIGURATION
Configuration of the Aruba IoT Telemetry Interface is achieved via IoT
profiles. The full configuration of IoT profiles is currently supported via
CLI on Aruba Instant (partly configurable via GUI) and ArubaOS and is
described in detail in the referenced product documentation within the chapter
“Related Documents.".
Ask your Kloudspot support contact for the following information:
- endpointUrl : the URL to send data to. It will be of the form https:// :/aruba-iot
- endpointToken : A token to validate the payload.
ARUBA INSTANT
This chapter describes the configuration and verification steps necessary to
setup Aruba Instant for KloudInsights/
Set-up
-
Enter ‘config mode’:
config
-
Enable the Bluetooth radio on an Aruba Instant AP in standalone mode or on all APs in an Aruba Instant cluster.
ble mode beaconing
-
Add a new IoT transport profile using the set-up information collected in chapter “REQUIRED INFORMATION”
iot transportProfile kloudspot
endpointID kloudspot
endpointToken <token>
endpointType telemetry-https
endpointURL <endpointUrl>
accessID kloudspot
transportInterval 10
rssiReporting average
exit
-
Enable the configured IoT profile.
iot useTransportProfile kloudspot
-
Apply the new configuration to the Aruba Instant AP/Cluster
exit
commit apply
Verification and Troubleshooting
Once the IoT profile has been configured and enabled, Aruba Instant
immediately connects to the backend server and starts sending telemetry
information.The commands below can be used to validate and troubleshoot the
IoT configuration and connectivity to the backend server.
The “show ap debug ble-config” command should show the BLE Operation Mode as
“Beaconing,” and the configured IoT profile should be shown.
d0:d3:e0:c3:3b:e0# show ap debug ble-config
-----------------------------------------------
---------- IOT Radio Profiles -----------------
-----------------------------------------------
Profile Name        : ble
Radio Instance      : Internal
Radio Mode          : BLE
BLE Mode            : beaconing scanning
BLE Console         : On
BLE Tx Power (dBm)  : 0
-----------------------------------------------
Note: No Zigbee service profiles configured.


Radio Configuration
-------------------
Radio Information     TI ONBOARD Internal BLE
-----------------     ------------------------
Radio Profile Type    --
Zigbee Supported      No
APB MAC Address       b4:52:a9:34:07:53
Operational Mode      Persistent Console (APB: Persistent Console)
Bundled BluOS Images  Bank A(/aruba/bin/UpgradeImage_AP_OAD-A_1.2-37.bin) Bank B(/aruba/bin/Beacon_AP_OAD-B_1.2-37.bin)
-----------------
Miscellaneous Configuration
---------------------------
Item                            Value
----                            -----
FIPS Mode                       No
Master IP                       127.0.0.1
BLE Ready                       Yes
APB Info Update Intvl (in sec)  88 (1763/1716)
BLE debug log                   Enabled
Message Selector                0xffff (APB: 0xffff)
AP USB Power Override           Disabled (-1)
Uplink Status                   Up (APB: -NA-)
APB Connection Status           0
Time Last Message to APB        1970-01-01 00:00:00
Log Levels Available            { All(0xfffff), Info(0x04), Warning(0x02), Error(0x01), Ageout(0x08), BMReq(0x10), FW-Upgrade(0x20), FW-UpgradeErr(0x40), CfgUpdate(0x80), CfgUpdateErr(0x100), Beacon(0x200), BcnTLV(0x400), BcnErr(0x800), APB(0x1000), Tags(0x2000), ZF(0x4000), AMON(0x8000), IOT-GW(0x10000), AT-HTTPS-JSON(0x20000), AT-WEBSOCKET-PROTOBUF(0x40000), DevMgmt(0x80000), None(0x00) }
Current Log Level               { 0x901e1 : Error(0x0001), FW-Upgrade(0x0020), FW-UpgradeErr(0x0040), CfgUpdate(0x0080), CfgUpdateErr(0x0100), IOT-GW(0x10000), DevMgmt(0x80000) }
Log Mac Filter                  None
Bundled BluOS Upgrade           Enabled (-1)
OTA FW BluOS Upgrade            Disabled
-----------------
BLE IoT Transport Context Config ID: 1
Last Sync Time: 2020-07-08 21:50:00
BLE IoT Profile List
--------------------
Profile Name    EndpointType     Interval   Content                   Filter Attribute  Cell Size  Att Threshold  Out Range Ageout  NamespaceFilter  URLFilter  Last Update           RssiReporting  environmentType  customFadingFactor  deviceCountsOnly  rtlsDestMAC        vendorFilter
------------    ------------     --------   -------                   ----------------  ---------  -------------  ----------------  ---------------  ---------  -----------           -------------  ---------------  ------------------  ----------------  -----------        ------------
kloudspot (51)  Telemetry Https  10 second  iBeacon(8),Eddystone(10)  NA                NA         NA             NA                NA               NA         2020-07-08 21:57:31   Average        office           NA                  FALSE             00:00:00:00:00:00
-----------------
Note: Uplink status is applicable only for Controller with Dynamic Console operational mode.
      For APBs of type LS-BT1USB, applied operational mode is Beaconing if ap system profile setting is either Persistent or Dynamic.
Note: Setting Message Selector value to 0x0 will cause the APB to function improperly. Use the knob with caution.
Note: Message Selector Bits: All(0xffff), V0 Scan (0x01), V1 Scan (0x02), UI Scan (0x04), Proximity Advert (0x08), IBeacon (0x10), Heartbeat-1 (0x20),  Heartbeat-UI (0x40), Upg Ack (0x80), Heartbeat-2 (0x200), Generic Scan (0x400), Generic Advert (0x800), Tag V1 Scan (0x1000), Tag V1 Advert (0x2000)
Use the “show ap debug ble-table all” command to verify if - and which -
Bluetooth devices can be seen by the AP.
d0:d3:e0:c3:3b:e0# show ap debug ble-table all

BLE Device Table [Aruba Beacons]
--------------------------------
MAC                HW_Type   FW_Ver        Flags   Status  Batt(%)  RSSI  Major#  Minor#  UUID                                  Meas. Pow.  Tx_Power  Last Update  Uptime
---                -------   ------        -----   ------  -------  ----  ------  ------  ----                                  ----------  --------  -----------  ------
b4:52:a9:34:07:53  BT-AP303  OAD B 1.2-37  0x01a3  LIA     ONBOARD  --    0       0       4152554E-F99B-4A3B-86D0-947070693A78  -56         14        I:4s         1h:40m:0s

BLE Device Table [Generic]
---------------------------
MAC                Address Type  RSSI  Last Update  Device Class
---                ------------  ----  -----------  ------------
5f:a3:0d:7c:fe:17  Private R     -56   I:0s         --
63:15:26:e9:98:1a  Private R     -50   I:1390s      --
58:cb:c4:25:90:2d  Private R     -42   I:338s       --
7b:67:2f:f0:46:4e  Private R     -42   I:1545s      --
01:5e:6a:46:34:79  Private NR    -87   I:0s         --
47:ad:f8:ff:2e:7c  Private R     -57   I:1s         --
d9:93:af:72:2e:8c  Static        -74   I:1s         --
60:81:33:46:98:91  Private R     -51   I:1390s      --
67:85:77:bb:9a:e8  Private R     -42   I:0s         --
46:b9:a9:5d:ca:eb  Private R     -53   I:0s         --
4e:0d:d5:6e:1c:fd  Private R     -52   I:901s       --
79:27:3f:15:ef:23  Private R     -84   I:0s         --
a4:83:e7:9c:39:2c  Public        -53   I:0s         --
7d:3c:66:1a:37:36  Private R     -94   I:1843s      --
44:54:ed:3a:b3:37  Private R     -51   I:1801s      --
74:5b:84:08:b7:64  Private R     -54   I:901s       --
5a:a9:82:c3:81:69  Private R     -66   I:244s       --
5c:9c:95:47:c5:a0  Private R     -52   I:1801s      --
cc:04:b4:02:51:af  Public        -89   I:0s         --
24:67:63:23:53:d5  Private NR    -83   I:589s       --
46:33:09:75:eb:ee  Private R     -57   I:1s         --
48:da:99:74:83:f4  Private R     -56   I:0s         --
ac:23:3f:5e:67:ff  Public        -41   I:0s         iBeacon, eddystone

Beacons:1
Generic BLE devices:23
Total BLE devices:24


Note: Battery level for LS-BT1USB devices is indicated as USB.
Note: Uptime is shown as Days hour:minute:second.
Note: Last Update is time in seconds since last heard update.
Note: Meas. Pow. is the averaged RSSI (in dBm) when the iBeacon is calibrated.
Status Flags:L:AP's local beacon; I:iBeacon; A:Beacon management capable
            :H:High power beacon; T:Asset Tag Beacon; U:Upgrade of firmware pending
            :u:Beacon management update received
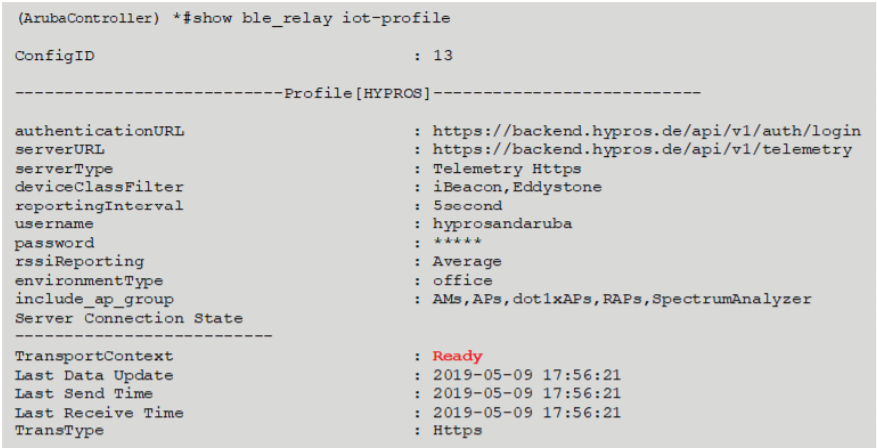
The commands “show ap debug ble-relay iot-profile” can be used to check the
IoT profile configuration and server connection status of the IoT profile. The
state should be displayed as “Ready.”
d0:d3:e0:c3:3b:e0# show ap debug ble-relay iot-profile

ConfigID                                : 1

---------------------------Profile[kloudspot]---------------------------
serverURL                               : https://smoke.kloudspot.com:48083/aruba-iot
serverType                              : Telemetry Https
deviceClassFilter                       : iBeacon,Eddystone
reportingInterval                       : 10 second
accessToken                             : 12345
clientID                                : kloudspot
rssiReporting                           : Average
environmentType                         : office
accessID                                : kloudspot
Server Connection State
--------------------------
TransportContext                        : Ready
Last Data Update                        : 2020-07-08 22:01:42
Last Send Time                          : 2020-07-08 22:01:43
Last Receive Time                       : 2020-07-08 22:01:43
TransType                               : Https
If the server connection status does not show “Ready,” use the command “show
ap debug ble-relay report ” for more detailed connection logs for
troubleshooting purposes.
d0:d3:e0:c3:3b:e0# show ap debug ble-relay report kloudspot

---------------------------Profile[kloudspot]---------------------------
Last Send Time: 2020-07-08 22:03:03

Sent report to Endpoint server (6s) ago: success 84, failed 0, last curl result code 200

Timeout(-1):20 Jobs added: 84

Server: https://<server>/aruba-iot with proxy: NA

Proxy username: NA, password: NA

Vlan Interface                          : Not Configured
Request to Server:
{"meta": {"version": 1}, "reporter": {"name": "d0:d3:e0:c3:3b:e0", "mac": "D0:D3:E0:C3:3B:E0", "ipv4": "10.90.37.235", "hwType": "AP-303", "swVersion": "8.6.0.4-8.6.0.4", "swBuild": "74969", "time": 1594245782}, "reported": [{"deviceClass": ["iBeacon", "eddystone"], "model": "iBeacon", "vendorName": "Apple", "mac": "AC:23:3F:5E:67:FF", "stats": {"adv_cnt": 7641266, "frame_cnt": 12, "uptime": 78288870}, "beacons": [{"eddystone": {"uid": {"nid": "00112233445566778899", "bid": "ABCDE23A00E1"}, "url": {"prefix": 1, "urlBytes": "6D696E65770012"}, "power": -24}}, {"ibeacon": {"uuid": "E2C56DB5-DFFB-48D2-B060-D0F5A71096E0", "major": 0, "minor": 0, "power": -59}}], "rssi": {"avg": -41}, "BeaconEvent": {"event": "update"}, "lastSeen": 7, "sensors": {"voltage": 3.12, "temperatureC": 25.0}}]}

Last Curl logs:
....
Host: <server>
Content-Type: application/json
Authorization: Bearer 12345
Accept: application/json
Content-Length: 792

* upload completely sent off: 792 out of 792 bytes
< HTTP/1.1 200 OK
< Server: nginx/1.14.0 (Ubuntu)
< Date: Wed, 08 Jul 2020 22:03:03 GMT
< Transfer-Encoding: chunked
< Connection: keep-alive
< Keep-Alive: timeout=5
< Vary: Accept-Encoding, User-Agent
<
* Curl_http_done: called premature == 0
* Connection #0 to host smoke.kloudspot.com left intact
ARUBAOS
This chapter describes the configuration and verification steps necessary to
set-up the IoT feed to KloudInsights on controller-based installations running
ArubaOS.
- In controller based set-ups the BLE radios and IoT profiles have to be enabled per AP groups.
- Mobility Master vs. Standalone ControllerThe configuration steps for IoT profiles in a mobility master and a standalone controller set-up are the same except that in a mobility master scenario the configuration is done on the mobility master using the configuration hierarchy.
Set-up
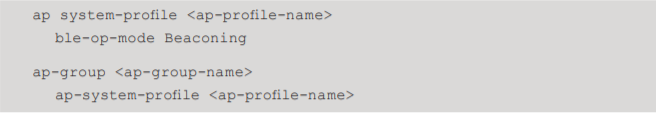
- Enable the Bluetooth radio on the desired AP groups by setting the ble-op-mode to Beaconing in the corresponding AP system profile.
- The deviceClassFilter all is enabled by default. The deviceClassFilter all has to be explicitly set to disable-dIn to send only telemetry updates for ibeacon and eddystone devices to the backed.
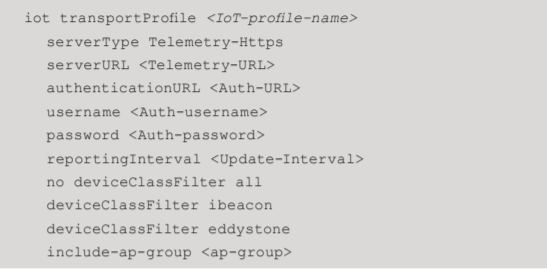
- Add a new IoT transport profile using the set-up information collected in chapter “REQUIRED INFORMATION”.
- Enable the configured IoT profile.

- Apply the new configuration to the Aruba controller/mobility master.

Verification and Troubleshooting
Mobility Master vs. Standalone ControllerThe verification and troubleshooting
steps for IoT profiles in a mobility master and a standalone controller set-up
are the same except that in a mobility master scenario the verification and
troubleshooting is done on the managed devices.
After the IoT profile has been configured and enabled the Aruba controller
will immediately connect to the backend server and start sending telemetry
information.
The commands below can used be to validate and troubleshoot the IoT
configuration and connectivity to the backend server.
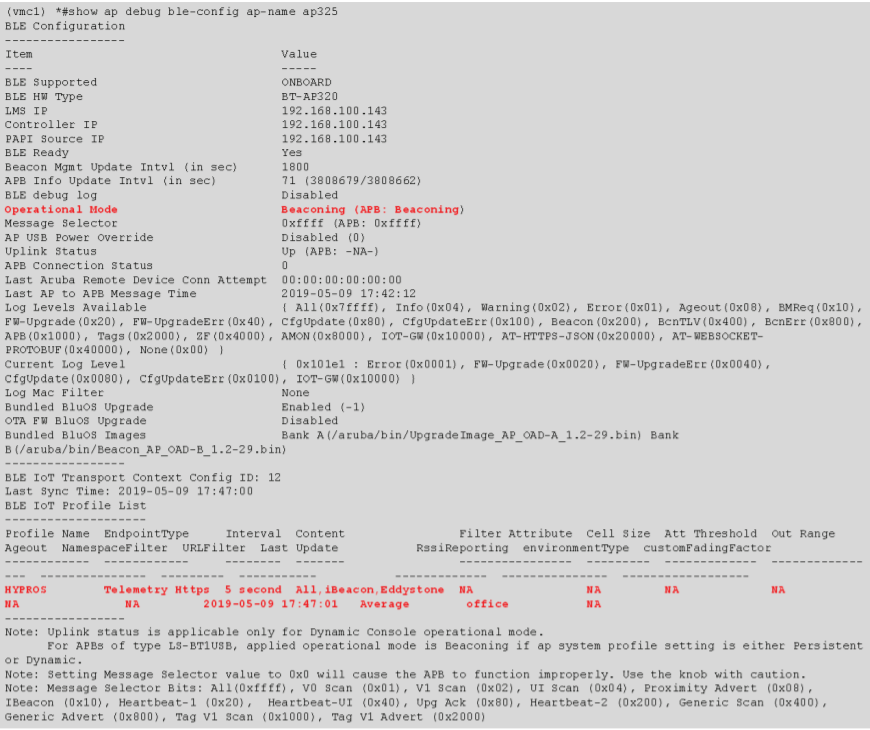
Check first to ensure that the access points’ BLE radios have been enabled and
if the APs can receive data form the BLE devices. The show ap debug ble-
config [ap-name|ip-addr|ip6-addr] command should show the BLE Operation Mode
as “Beaconing” and the configured IoT profile should be displayed.
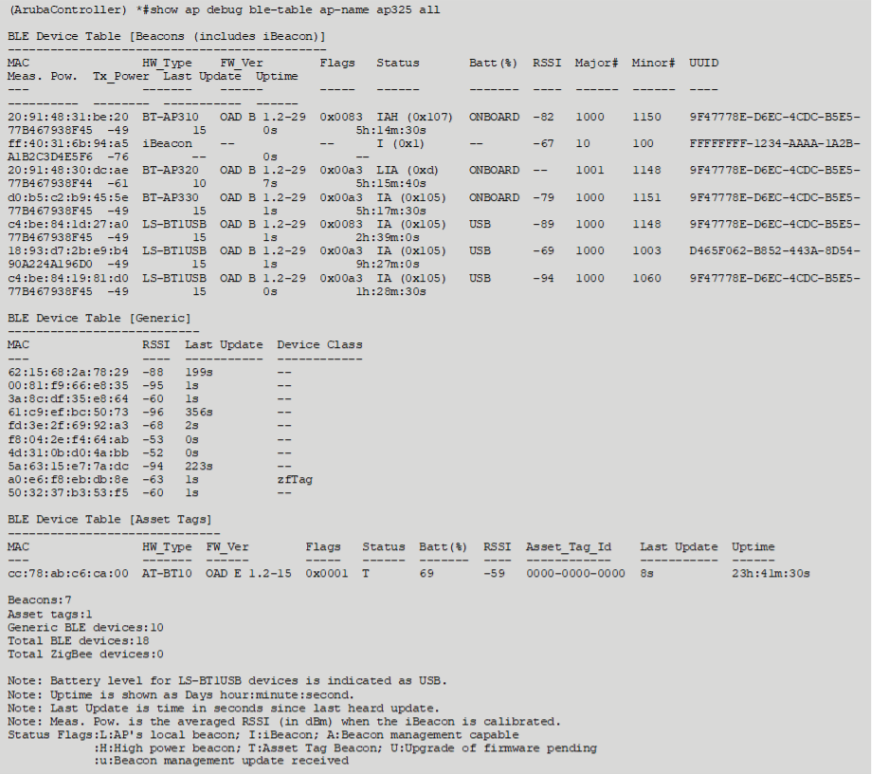
Using the show ap debug ble-table [ap-name|ip-addr|ip6-addr] all command
verify if - and which - Bluetooth devices are seen by the access points.
Use the command show ble_relay iot-profile to check the IoT profile
configuration and server connection status of the IoT profile. The state of
the response should show “Ready.”
If the server connection status does not show “Ready,” use the command show
ble_relay report report [] to obtain more detailed connection logs for
troubleshooting.
Subsections of WiFi/BLE Event Recievers
Aruba ALE
The Kloudspot Analytics Engine can receive events from many types of WiFi
network.
One or more of event sources can be configured in the Configuration - >
Event Processing- >Wi-Fi screen.
Validate the Receiver URLs
The protocol (HTTP/HTTPS) used varies depending on the source. We support both
HTTP and HTTPS protocols using port 48082 and 48083. Refer to the specific
data source below to determine the correct one to use.
If you have set a SSL certificate for the UI, that will be used instead of the
self signed one.
You can check access to both the HTTP and HTTPS urls with a ‘ping’:
$ curl http://{server}:48082/ping
hi from http receiver
$ curl -k https://{server}:48083/ping
hi from https receiver
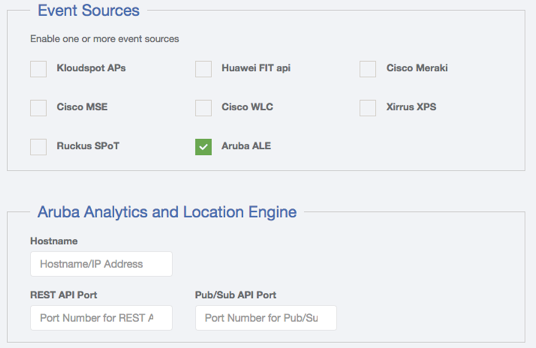
Aruba ALE
Refer to the ‘Analytics and Location Engine 2.0 - User Guide’. This will give
the necessary information to set up the connection and/or the Websocket
tunnel. Here are the Aruba
docs.
Three parameters need to be entered into the Kloudspot Analytics configuration
screen:
- Hostname: of the ALE Websocket Proxy
- REST API Port: Typically 8700
- Pub/Sub API Port: The port used for the ZMQ connection. This is the port mapped to port 7779 on the ALE (typically 12000).
In summary:
- The Analytics Engine can either access the ALE Engine directly or make use of the supplied Websocket Tunnel. In either case enter the required port details into the configuration screen and click save.
- The ALE Engine should be configured to not anonymize Mac addresses.
- At present only presence (Context Mode) is support for this source.
The Aruba websocket endpont can be set up anywhere, which can help with
firewall issues. Depending on the circumstances, the endpoint could be
installed on the Kloudspot Analytics server itself (with a localhost
connection).
Check Event Reception
Login to the Analytics Engine via SSH and run the kafka-listen command:
$ kafka-listen
{"vendor": "Kloudspot", "eventType": "PRESENCE", "location": null,..
{"vendor": "Kloudspot", "eventType": "PRESENCE", "location": null,..
{"vendor": "Kloudspot", "eventType": "PRESENCE", "location": null,..
{"vendor": "Kloudspot", "eventType": "PRESENCE", "location": null,..
You will be able to see the ‘raw’ event feed going into the stream processing.
Aruba RTLS
Overview
The Kloudspot Analytics Engine can receive events from many types of WiFi
network.
One or more of event sources can be configured in the ‘Configuration - >
Event Processing - > Wi-Fi’ screen.
Validate the Receiver URLs
The protocol (HTTP/HTTPS) used varies depending on the source. We support both
HTTP and HTTPS protocols using port 48082 and 48083. Refer to the specific
data source below to determine the correct one to use.
If you have set a SSL certificate for the UI, that will be used instead of the
self signed one.
You can check access to both the HTTP and HTTPS urls with a ‘ping’:
$ curl http://{server}:48082/ping
hi from http receiver
$ curl -k https://{server}:48083/ping
hi from https receiver
Aruba RTLS Feed
In addition to a feed from the Aruba Location Engine, we can also take a feed
direct from the APs. This can be set up either on individual APs or for groups
of APs via Airwave or Aruba Central.
In order for this work, the APs must be able to access port 3333 on the
Kloudspot server using the UDP protocol. Depending on firewall requirements,
it should be possible to use a [standalone proxy data
receiver](https://documentation.kloudspot.com/help/standalone-receiver-setup-
for-cisco-wlc “Standalone Receiver Setup for Cisco WLC”).
The setup is similar regardless of the approach:
- Enable the event type in the KloudInsights configuration screen and set a passphrase to use:
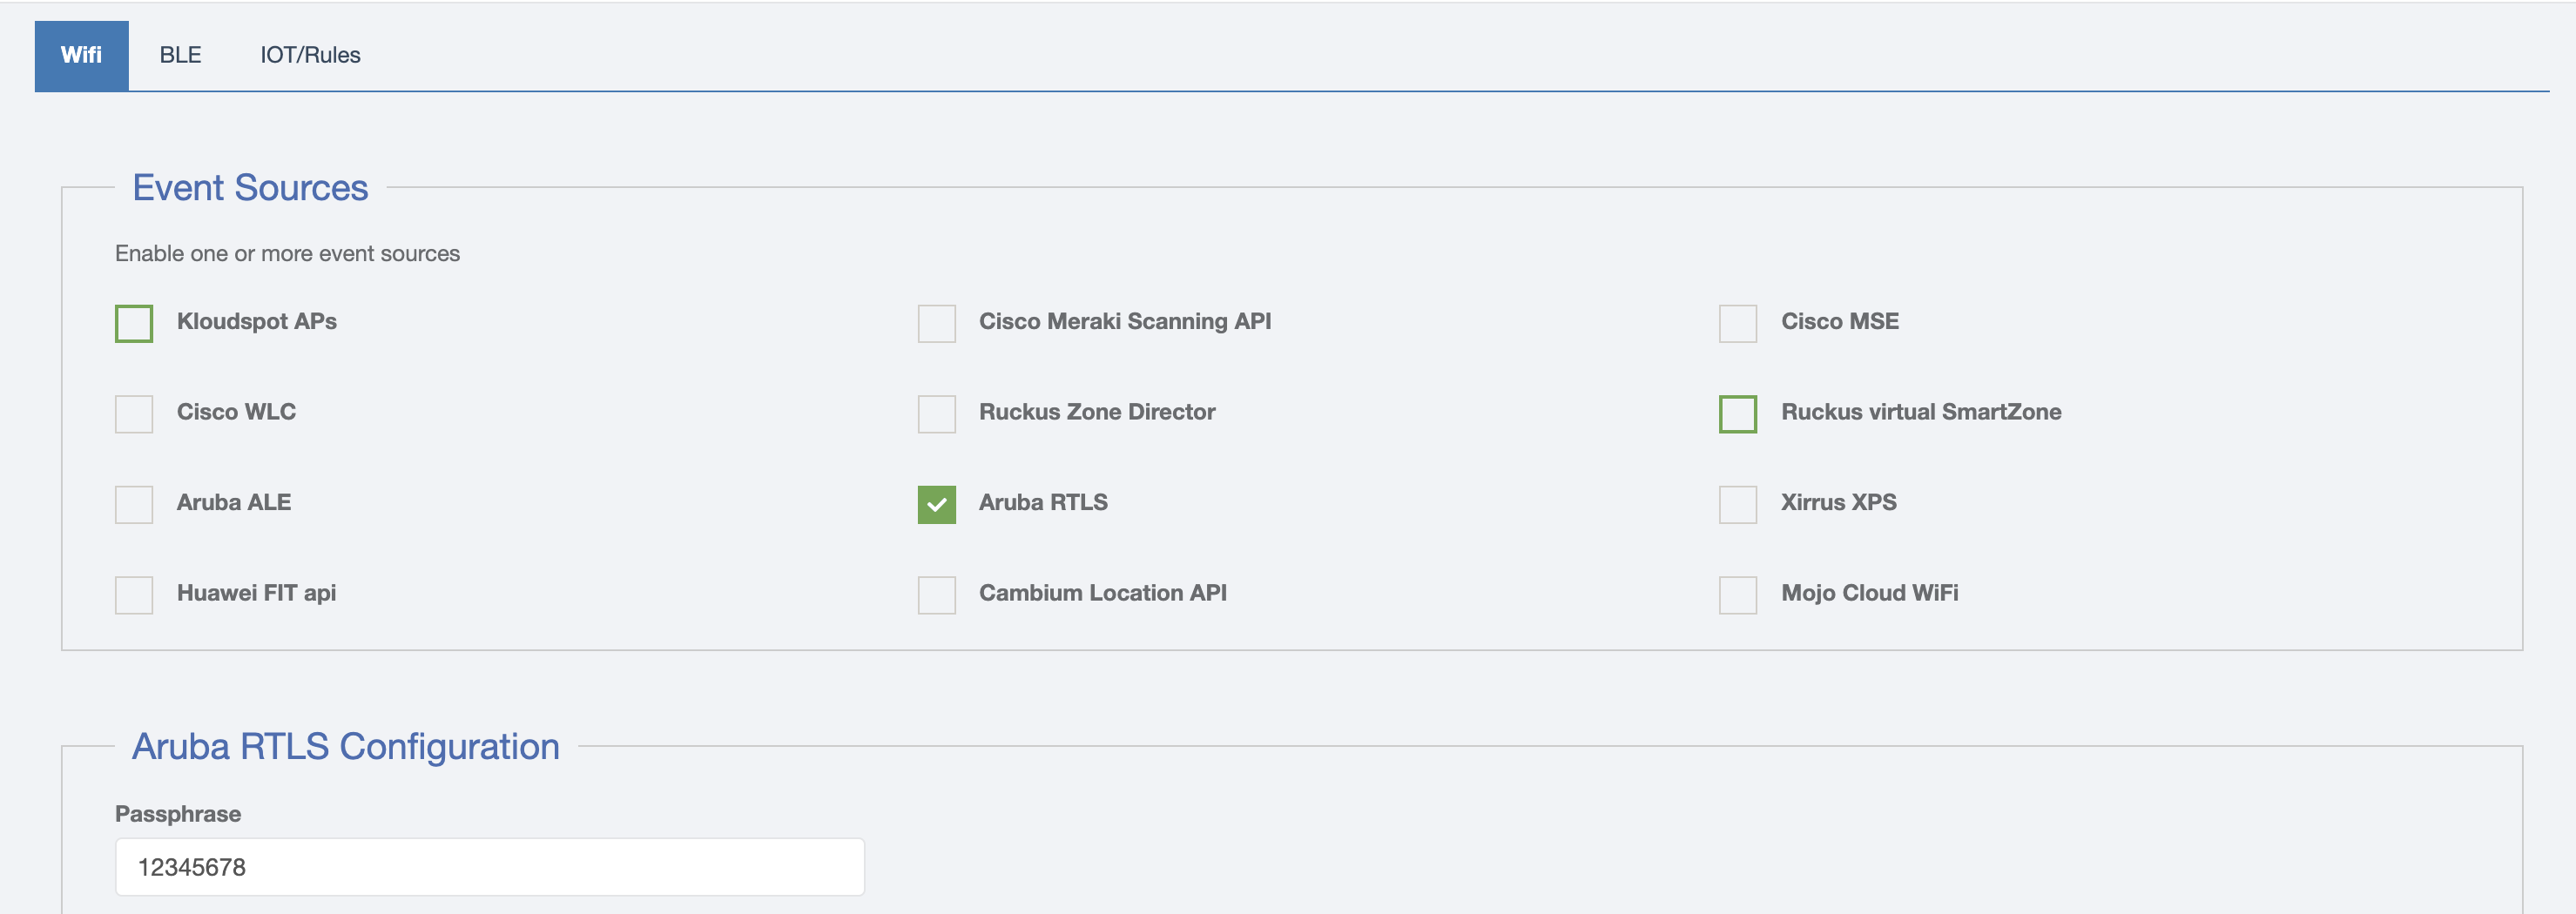
- In the Aruba dashboard, enable the RTLS feed in the Services menu for the AP or Group, using the passphrase you created above and port 3333
See these references in the Aruba documentation for information:
Regardless of the method used, the following parameters are needed:
- The fully qualified domain name or IP Address of the KloudInsights server.
- The port will be 3333.
- The passphrase set in the KloudInsights configuration.
Check Event Reception
Login to the Analytics Engine via SSH and run the kafka-listen command:
$ kafka-listen
{"vendor": "Kloudspot", "eventType": "PRESENCE", "location": null,..
{"vendor": "Kloudspot", "eventType": "PRESENCE", "location": null,..
{"vendor": "Kloudspot", "eventType": "PRESENCE", "location": null,..
{"vendor": "Kloudspot", "eventType": "PRESENCE", "location": null,..
You will be able to see the ‘raw’ event feed going into the stream processing.
Related Articles
[template(“related”)]
Cambium
Overview
The Kloudspot Analytics Engine can receive events from many types of WiFi
network.
One or more of event sources can be configured in the ‘Configuration - >
Event Processing - > Wi-Fi’ screen.
Validate the Receiver URLs
The protocol (HTTP/HTTPS) used varies depending on the source. We support both
HTTP and HTTPS protocols using port 48082 and 48083. Refer to the specific
data source below to determine the correct one to use.
If you have set a SSL certificate for the UI, that will be used instead of the
self signed one.
You can check access to both the HTTP and HTTPS urls with a ‘ping’:
$ curl http://{server}:48082/ping
hi from http receiver
$ curl -k https://{server}:48083/ping
hi from https receiver
Cambium cnPilot
Kloudspot Analytics support the WiFi Location API provided by Cambium cnPilot
Enterprise APs. The API can be setup either on standalone APs or via the
cnMeastro Wireless Controller/Network Manager.
In either case the setup is the same:
- Go to the Radio options and enable Off Channel scan and Auto RF and save.
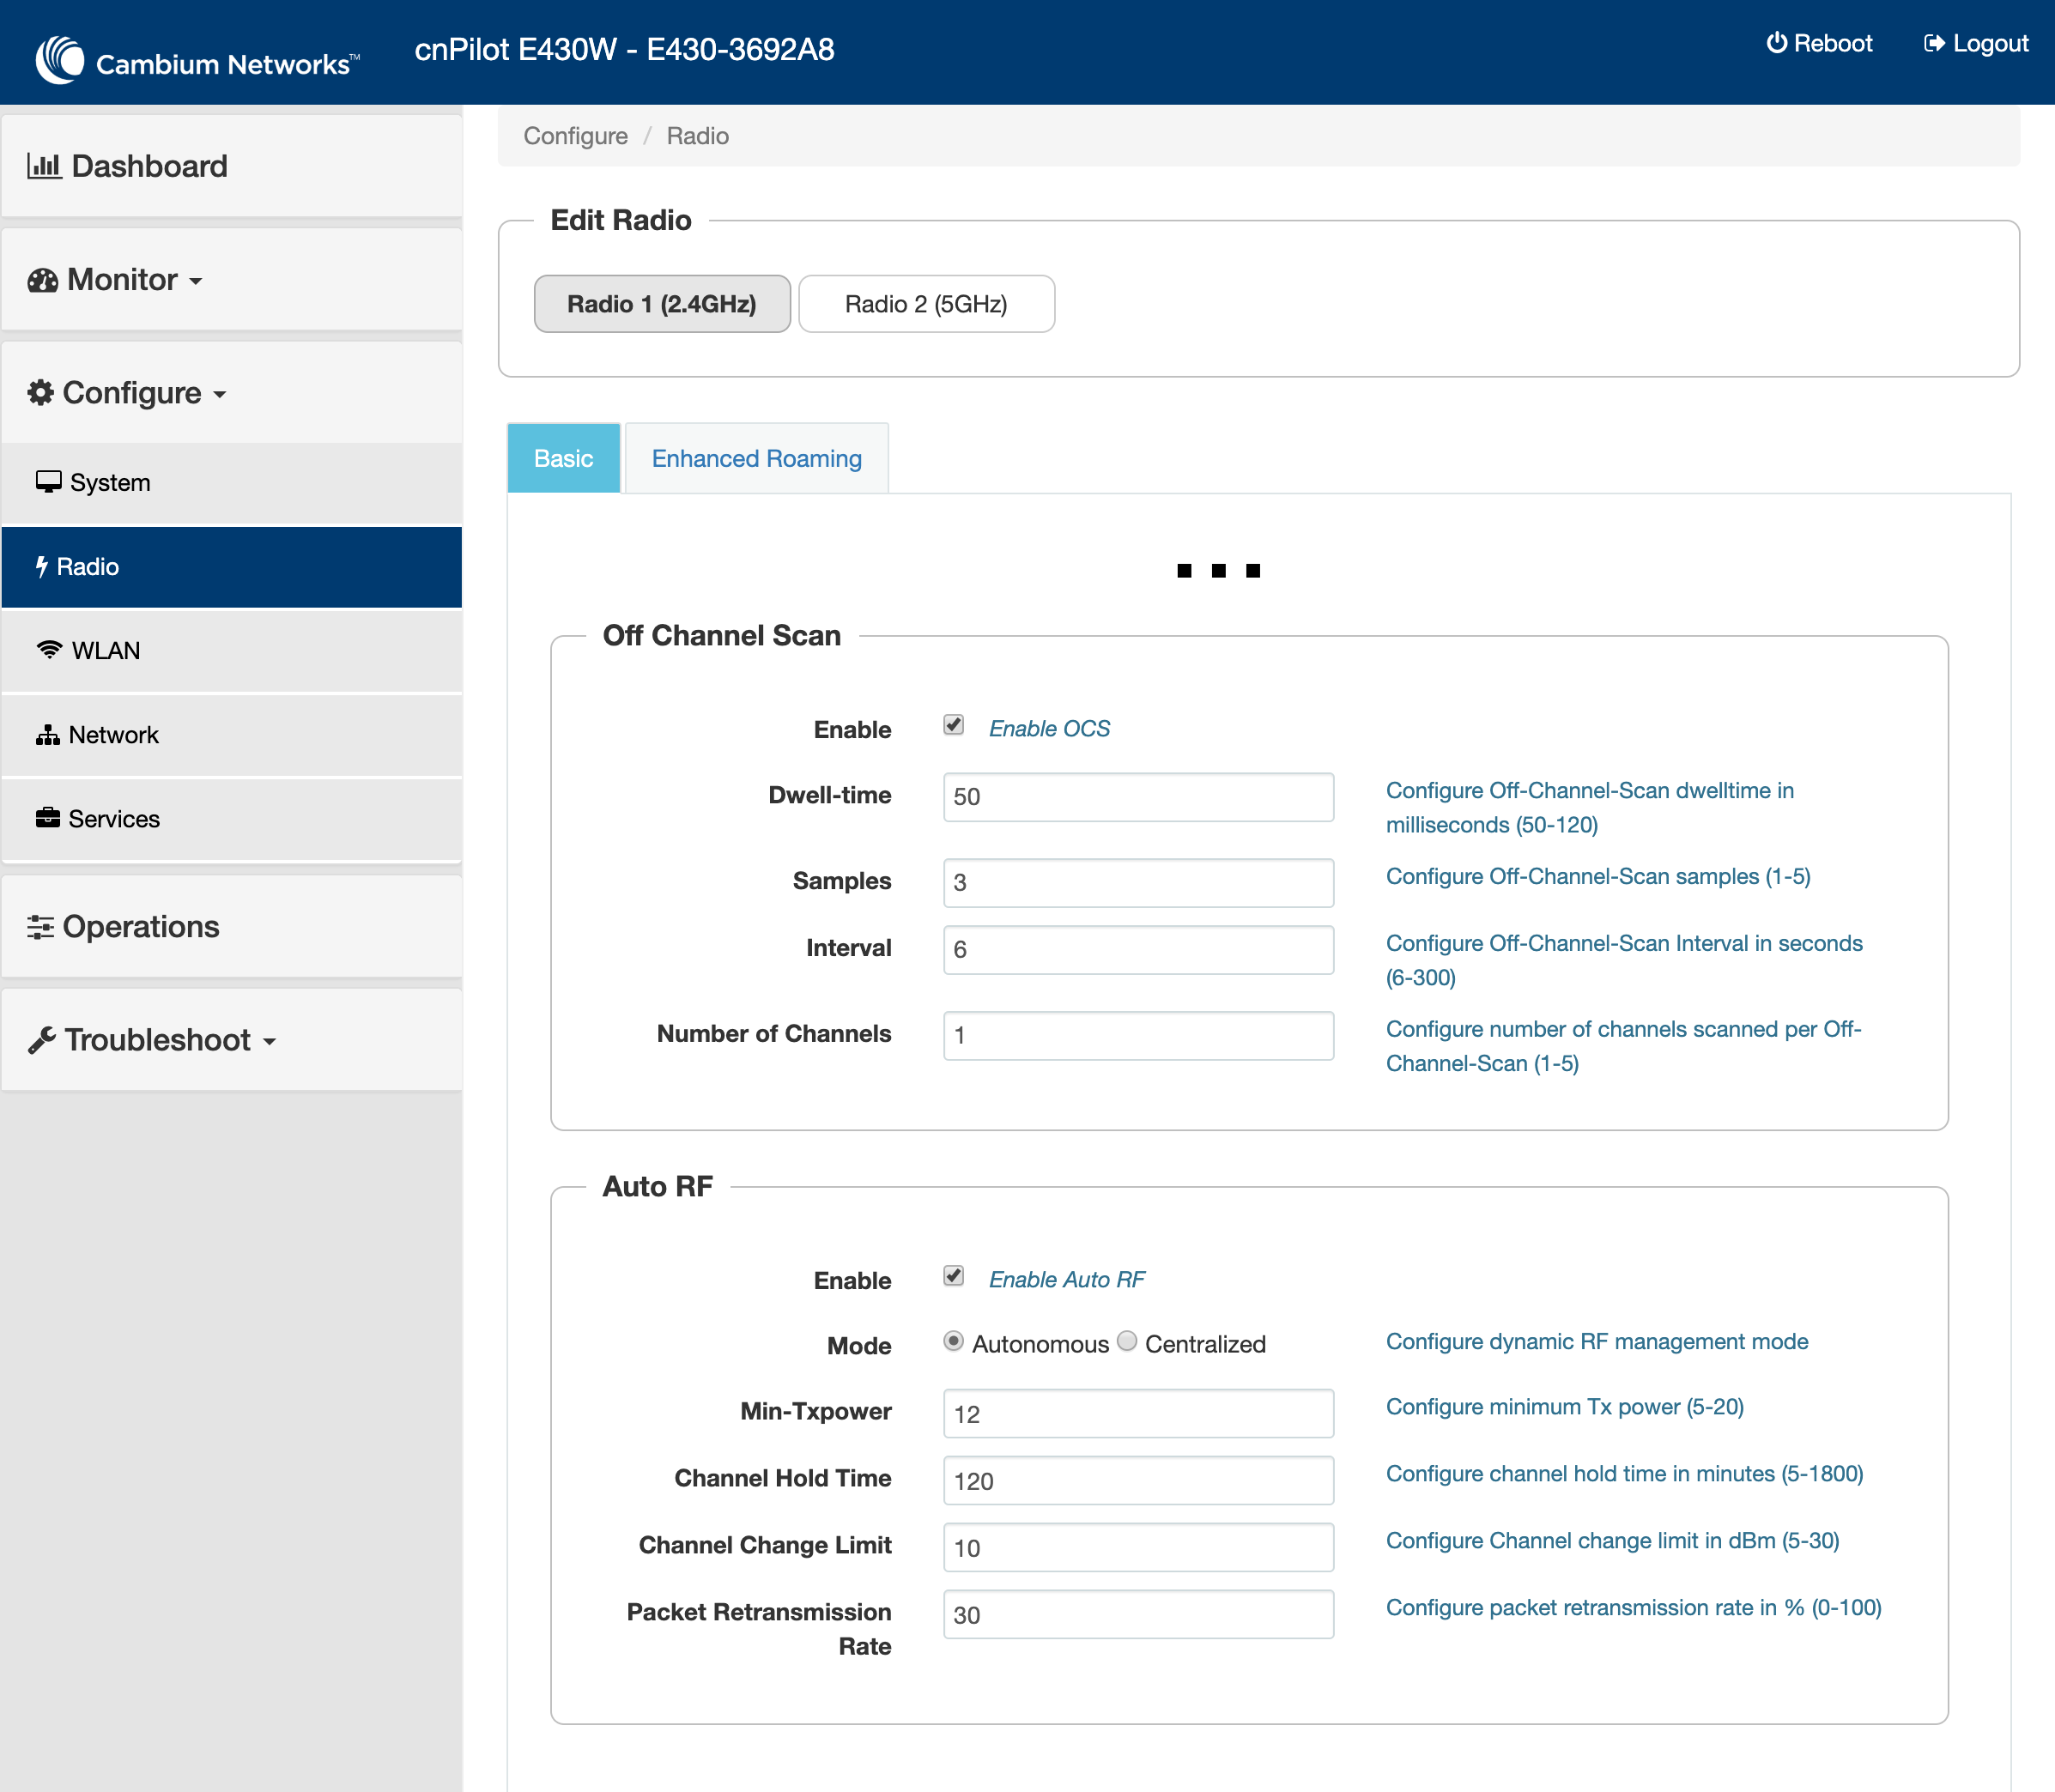
- Then to the Services options and enable the Location API and save.
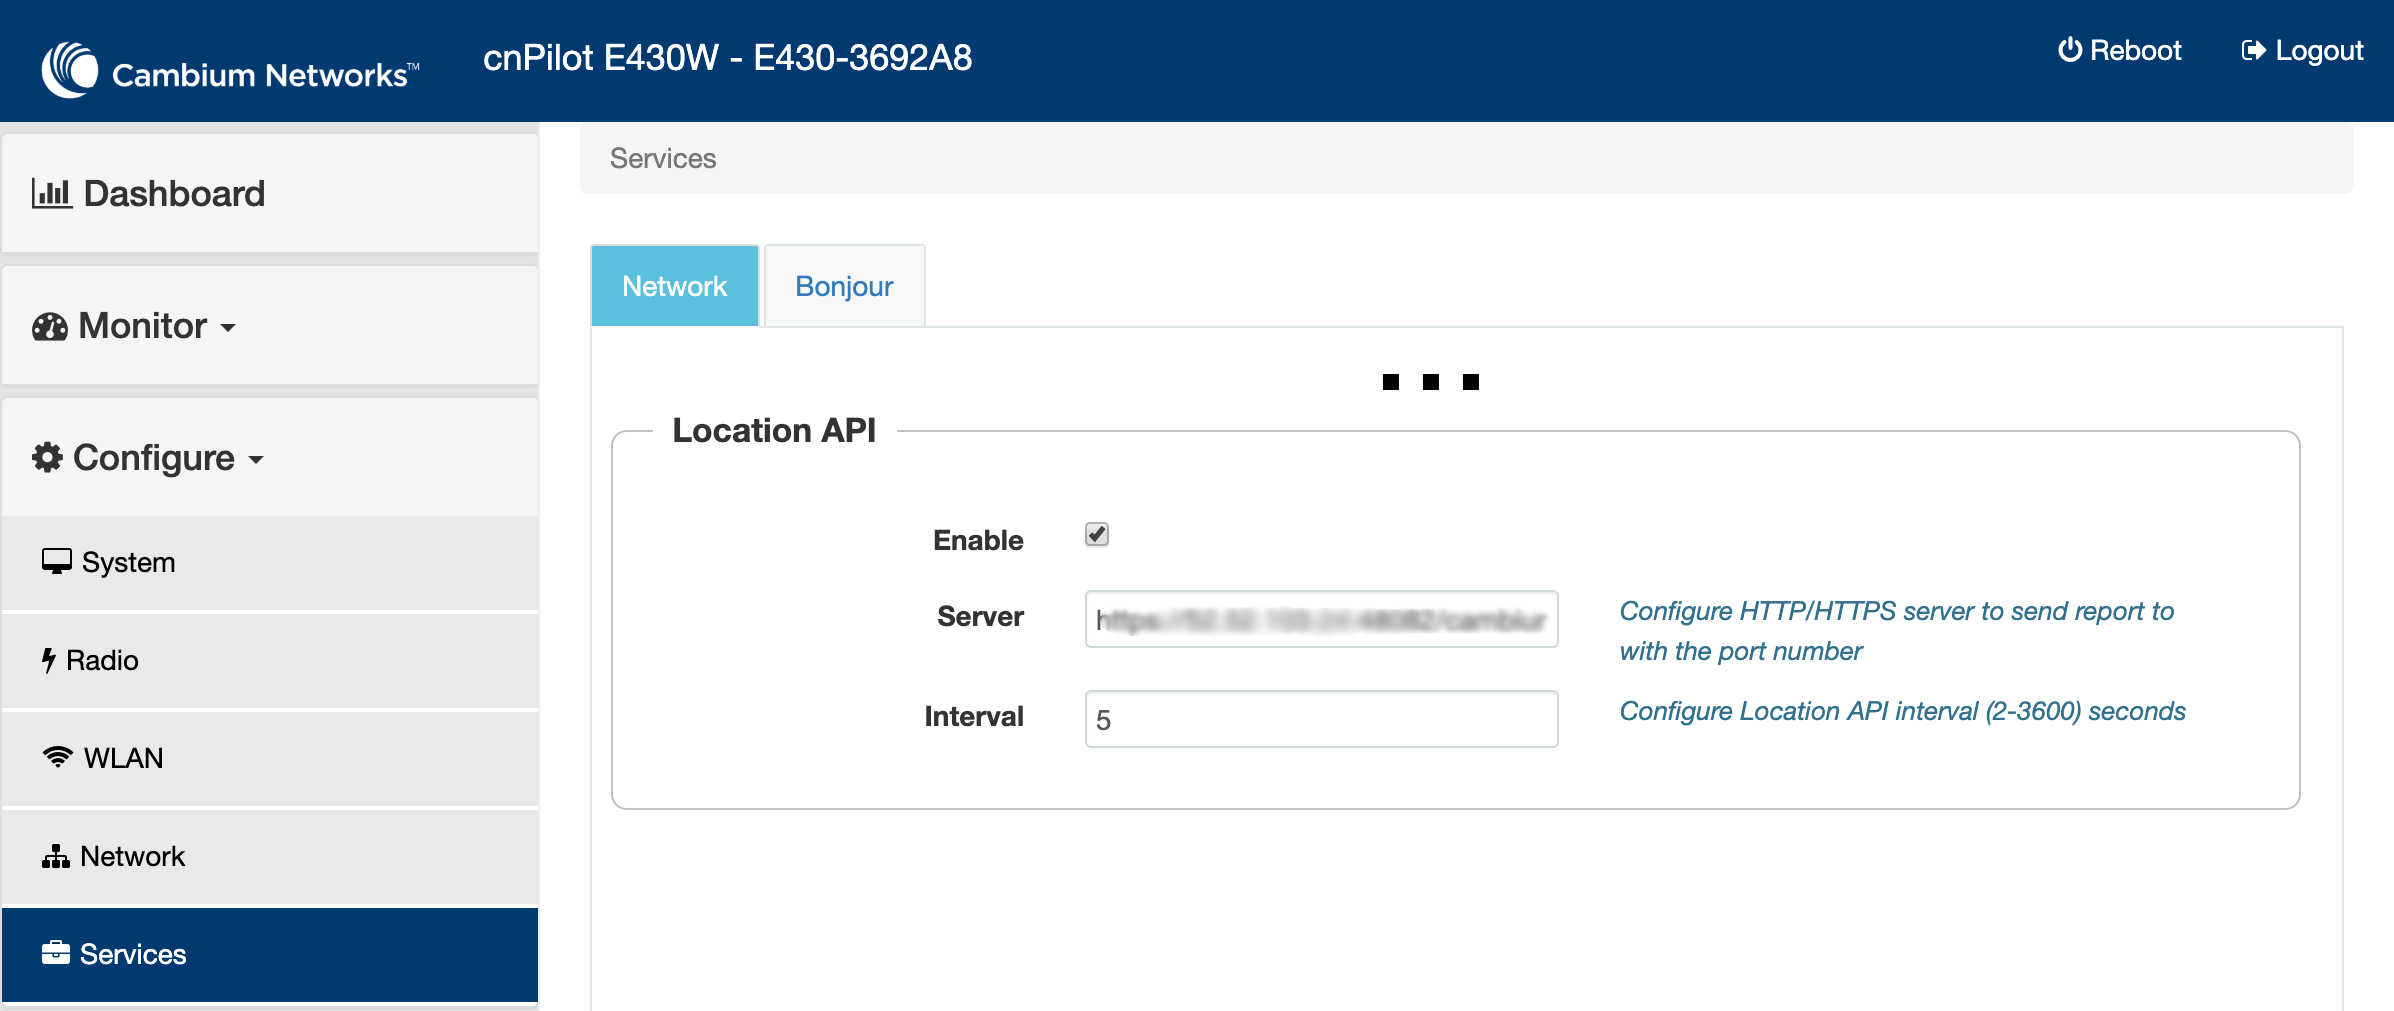
The default Server URL will be: https://<server>:48083/cambium. The Interval
should be ~30 seconds.
- Go the the event sources screen in the Kloudspot Analytics Engine, enable the ‘Cambium Location API’ source and then restart the Stream Processing job.
Cambium cnMaestro
For cnMaestro, the steps to be taken are the same as with cnPilot, however to
navigate to the radio & service settings please follow the steps in the below
screenshot:
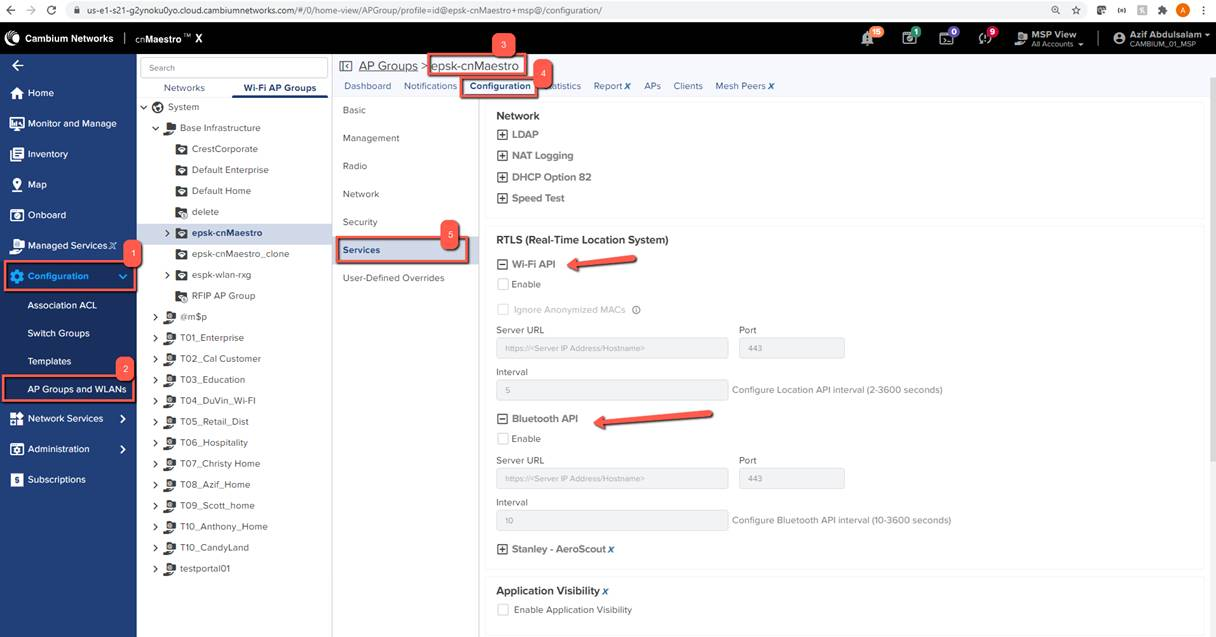
If BLE is also being scanned for, make sure to enable the Bluetooth API on the
services page, and enter in the same information entered for WiFi.
Check Event Reception
Login to the Analytics Engine via SSH and run the kafka-listen command:
$ kafka-listen
{"vendor": "Kloudspot", "eventType": "PRESENCE", "location": null,..
{"vendor": "Kloudspot", "eventType": "PRESENCE", "location": null,..
{"vendor": "Kloudspot", "eventType": "PRESENCE", "location": null,..
{"vendor": "Kloudspot", "eventType": "PRESENCE", "location": null,..
You will be able to see the ‘raw’ event feed going into the stream processing.
Related Articles
[template(“related”)]
Cisco CMX
Overview
The Kloudspot Analytics Engine can receive events from many types of WiFi
network.
One or more of event sources can be configured in the ‘Configuration - >
**Event Processing - > Wi-Fi’**screen.
Validate the Receiver URLs
The protocol (HTTP/HTTPS) used varies depending on the source. We support both
HTTP and HTTPS protocols using port 48082 and 48083. Refer to the specific
data source below to determine the correct one to use.
If you have set a SSL certificate for the UI, that will be used instead of the
self signed one.
You can check access to both the HTTP and HTTPS urls with a ‘ping’:
$ curl http://{server}:48082/ping
hi from http receiver
$ curl -k https://{server}:48083/ping
hi from https receiver
Cisco CMX/MSE
The Kloudspot Location Engine supports Notifications from the Cisco CMX v10.X
operating in ‘presence’ mode.
On Kloudspot Location Engine, select the ‘Cisco MSE’ Event source and click
‘save’.
Then login to Cisco CMX and configure the following notification types:
- Movement
- Area Change
- Location Update
- Absence
See CMX Manual for instructions on setting up
notifications
When setting up a notification:
-
Use the following receiver URL:
https://{server}:48083/event10
-
Select JSON message format.
-
Turn MAC scrambling off.
Check Event Reception
Login to the Analytics Engine via SSH and run the kafka-listen command:
$ kafka-listen
{"vendor": "Kloudspot", "eventType": "PRESENCE", "location": null,..
{"vendor": "Kloudspot", "eventType": "PRESENCE", "location": null,..
{"vendor": "Kloudspot", "eventType": "PRESENCE", "location": null,..
{"vendor": "Kloudspot", "eventType": "PRESENCE", "location": null,..
You will be able to see the ‘raw’ event feed going into the stream processing.
Cisco Meraki
Overview
The Kloudspot Analytics Engine can receive events from many types of WiFi
network.
One or more of event sources can be configured in the ‘Configuration - >
Event Processing - > Wi-Fi’ screen.
Validate the Receiver URLs
The protocol (HTTP/HTTPS) used varies depending on the source. We support both
HTTP and HTTPS protocols using port 48082 and 48083. Refer to the specific
data source below to determine the correct one to use.
If you have set a SSL certificate for the UI, that will be used instead of the
self signed one.
You can check access to both the HTTP and HTTPS urls with a ‘ping’:
$ curl http://{server}:48082/ping
hi from http receiver
$ curl -k https://{server}:48083/ping
hi from https receiver
Meraki MV Sense
Follow the instructions provided on the link to configure MQTT broker in the
Meraki Dashboard:
Follow the instructions provided on the link to subscribe to different MQTT
Messages
Enable location Services: TCP port 6666 needs to be opened to start
capturing Meraki MV sense Data.
Cisco Meraki Location Scanning API
To enable, the Meraki scanning API feed, follow the following steps:
When enabling the API, set the following parameters:
- API Version : 2
- Post URL : https://{server}:48083/meraki/{name}
- Secret : for example - kloudspot12345678
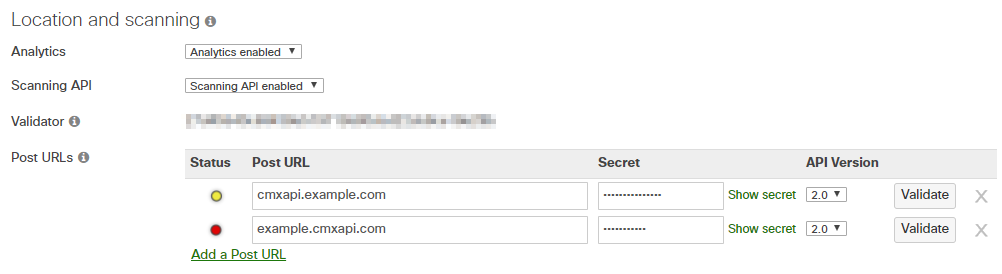
For ‘{name}’ use a friendly alphanumeric label for the account.
- Next go to the Kloudspot Web UI and select ‘Cisco Meraki’ source in the Event Sources.
- Add an entry for each account (one is enabled by default) by clicking the ‘+’ sign.
- Enter the ’name’, ‘validation’ and secret’ from above for each account and click ‘Save’.

- Restart the stream processing job.
Check Event Reception
Login to the Analytics Engine via SSH and run the kafka-listen command:
$ kafka-listen
{"vendor": "Kloudspot", "eventType": "PRESENCE", "location": null,..
{"vendor": "Kloudspot", "eventType": "PRESENCE", "location": null,..
{"vendor": "Kloudspot", "eventType": "PRESENCE", "location": null,..
{"vendor": "Kloudspot", "eventType": "PRESENCE", "location": null,..
You will be able to see the ‘raw’ event feed going into the stream processing.
Cisco WLC
Overview
The Kloudspot Analytics Engine can receive events from many types of WiFi
network.
One or more of event sources can be configured in the ‘Configuration - >
Event Processing - > Wi-Fi’ screen.
Validate the Receiver URLs
The protocol (HTTP/HTTPS) used varies depending on the source. We support both
HTTP and HTTPS protocols using port 48082 and 48083. Refer to the specific
data source below to determine the correct one to use.
If you have set a SSL certificate for the UI, that will be used instead of the
self signed one.
You can check access to both the HTTP and HTTPS urls with a ‘ping’:
$ curl http://{server}:48082/ping
hi from http receiver
$ curl -k https://{server}:48083/ping
hi from https receiver
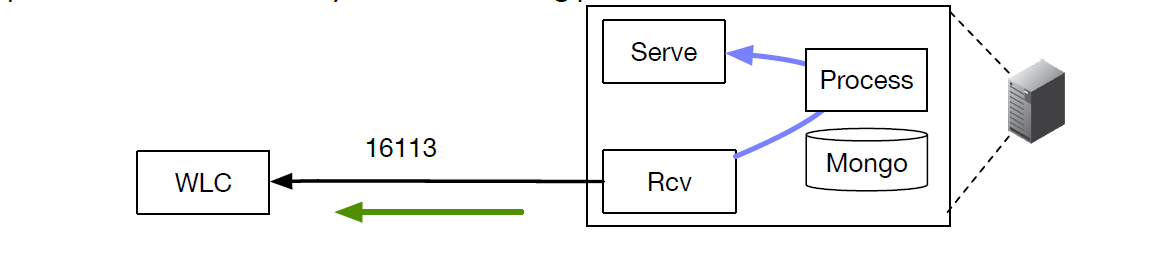
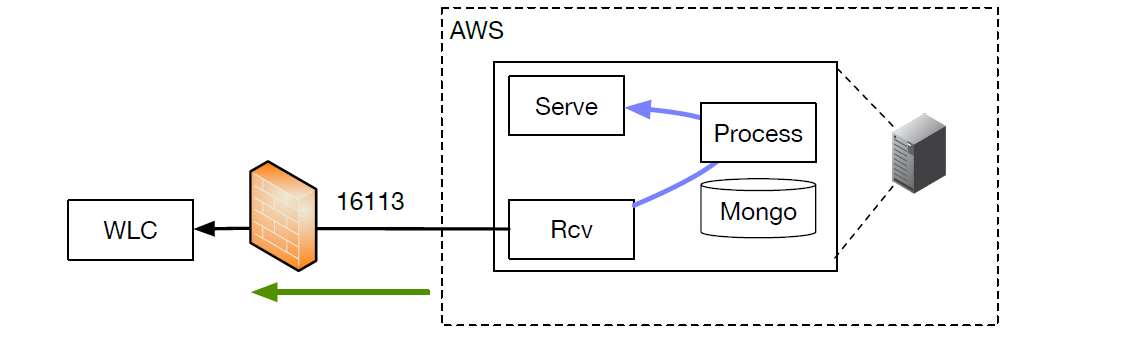
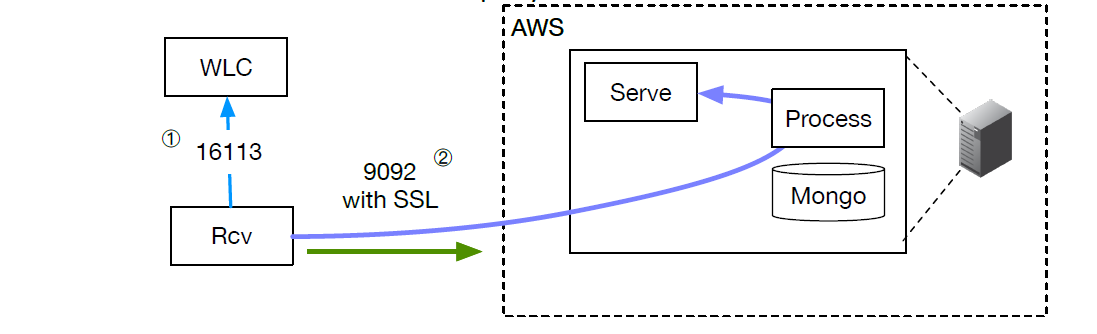
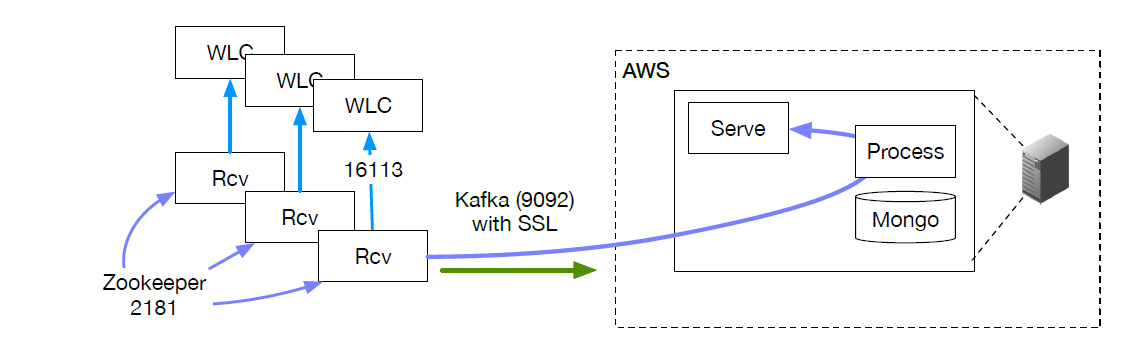
Cisco Wireless Lan Controller
To configure a Cisco Wireless WAN Controller to send events, follow the
following steps.
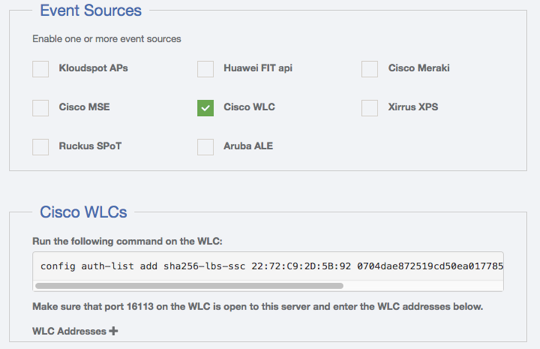
- Ensure that the Kloudspot Analytics Engine can access port 16113 on the WLC.
- Enable the Cisco WLC Event source in the Kloudspot Analytics Engine.
- Copy the command from the Kloudspot UI and run on the WLC. This will allow the Analytics Engine to connect and subscribe for events.
- Add the IP address for WLC to the list of WLC Addresses in the Analytics Engine UI and click ‘Save’.
Check Event Reception
Login to the Analytics Engine via SSH and run the kafka-listen command:
$ kafka-listen
{"vendor": "Kloudspot", "eventType": "PRESENCE", "location": null,..
{"vendor": "Kloudspot", "eventType": "PRESENCE", "location": null,..
{"vendor": "Kloudspot", "eventType": "PRESENCE", "location": null,..
{"vendor": "Kloudspot", "eventType": "PRESENCE", "location": null,..
You will be able to see the ‘raw’ event feed going into the stream processing.
Huawei
Overview
The Kloudspot Analytics Engine can receive events from many types of WiFi
network.
One or more of event sources can be configured in the **‘Configuration - >
****Event Processing** **- > ****Wi-Fi** ’ screen.
Validate the Receiver URLs
The protocol (HTTP/HTTPS) used varies depending on the source. We support both
HTTP and HTTPS protocols using port 48082 and 48083. Refer to the specific
data source below to determine the correct one to use.
If you have set a SSL certificate for the UI, that will be used instead of the
self signed one.
You can check access to both the HTTP and HTTPS urls with a ‘ping’:
$ curl http://{abc}-rcv.apps.kloudspot.com/{xyz}
hi from http receiver
$ curl -k https://{abc}-rcv.apps.kloudspot.com/{xyz}
hi from https receiver
- Use port 443
- {abc} = customer vanity URL
- {xyz} = type of receiver used
Huawei
To configure a Huawei AP, select ‘Huawei’ from the event sources available.
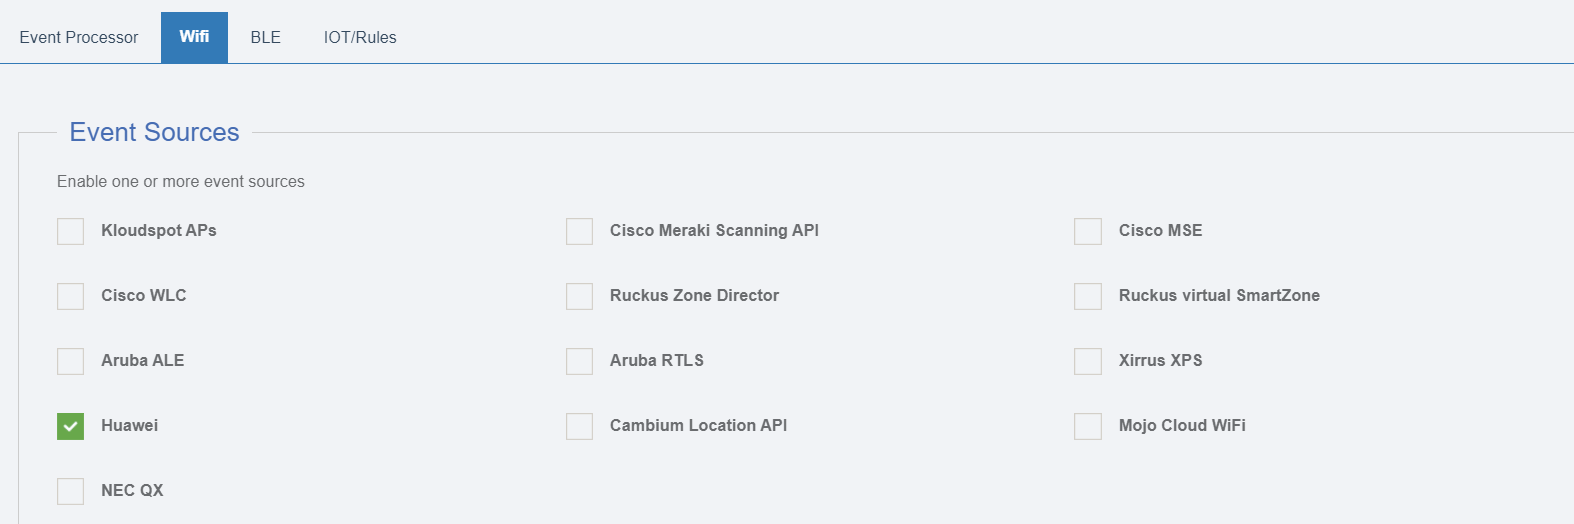
Enable location Services
To enable location services for Huawei APs please follow the steps below.
- Open 7777/ UDP port for collecting Wi-Fi data
- Open 7778/UDP port for collecting BLE data.
Accuracy: The accuracy provided for Huawei AP is approximately between 3-5
meters for WiFi and 1-3 meters for BLE.
Reference links for Huawei
- Reference link for BLE integration from Huawei
https://intl.devzone.huawei.com/en/enterprise/campus/lbsBluetoothSolution.html
- Reference link for Wi-Fi integration from Huawei
https://intl.devzone.huawei.com/en/enterprise/campus/lbsWiFiSolution.html
- Integration Document Kloudspot-Huawei
Integration Document
Check Event Reception
Login to the Analytics Engine via SSH and run the kafka-listen command:
$ kafka-listen
{"vendor": "Kloudspot", "eventType": "PRESENCE", "location": null,..
{"vendor": "Kloudspot", "eventType": "PRESENCE", "location": null,..
{"vendor": "Kloudspot", "eventType": "PRESENCE", "location": null,..
{"vendor": "Kloudspot", "eventType": "PRESENCE", "location": null,..
You will be able to see the ‘raw’ event feed going into the stream processing.
Kloudspot Event Receiver
Overview
The Kloudspot Analytics Engine can receive events from many types of WiFi
network.
One or more of event sources can be configured in the **‘Configuration - >
****Event Processing** **- > ****Wi-Fi** ’ screen.
Validate the Receiver URLs
The protocol (HTTP/HTTPS) used varies depending on the source. We support both
HTTP and HTTPS protocols using port 48082 and 48083. Refer to the specific
data source below to determine the correct one to use.
If you have set a SSL certificate for the UI, that will be used instead of the
self signed one.
You can check access to both the HTTP and HTTPS urls with a ‘ping’:
$ curl http://{server}:48082/ping
hi from http receiver
$ curl -k https://{server}:48083/ping
hi from https receiver
Kloudspot
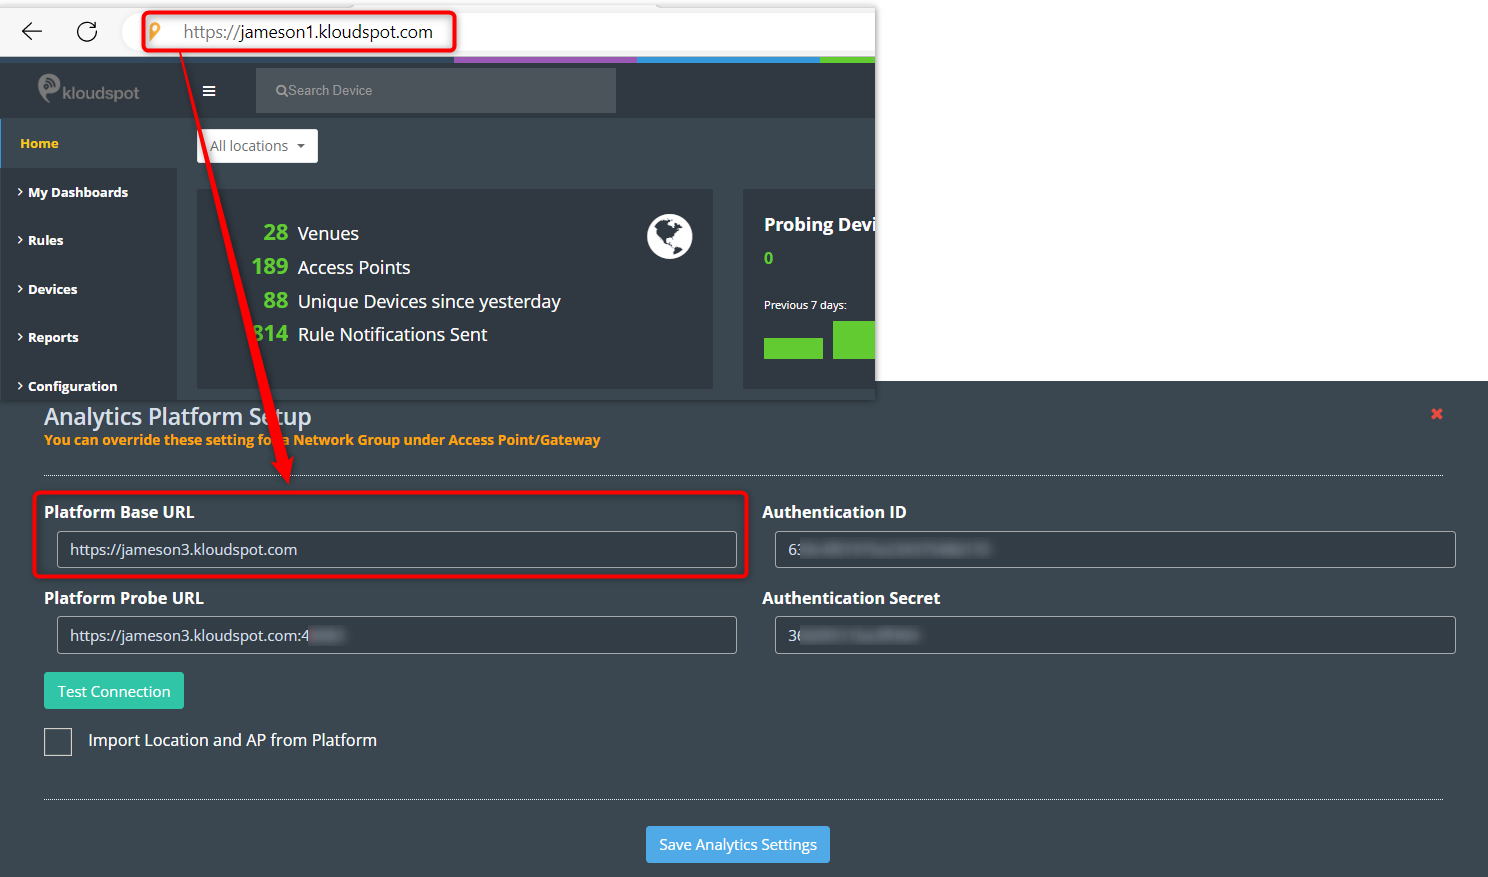
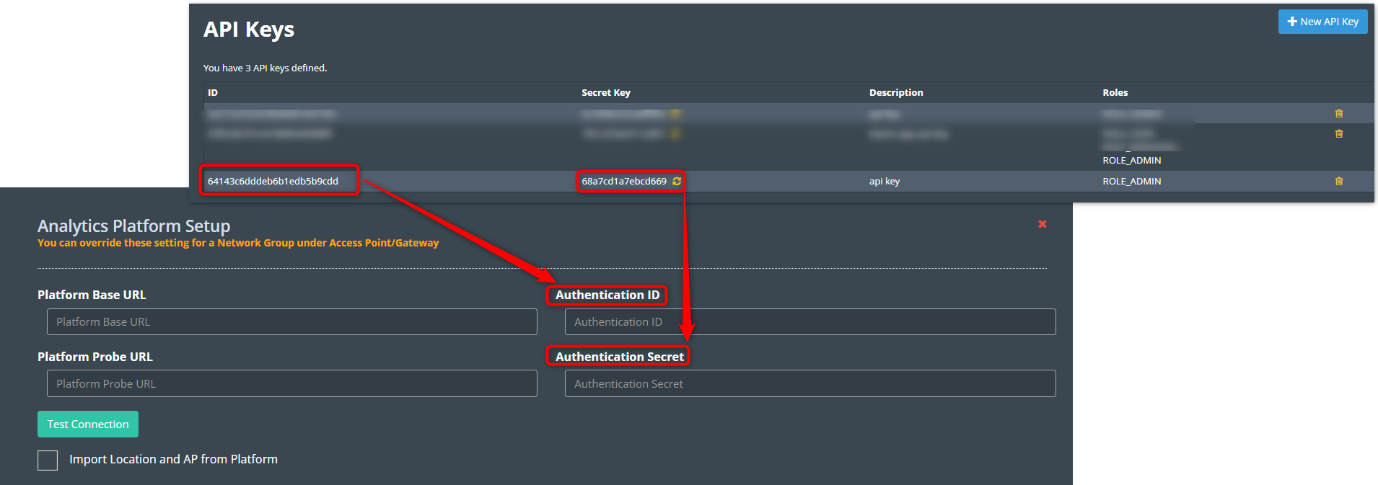
The following steps are needed to configure Kloudspot APs to send events:
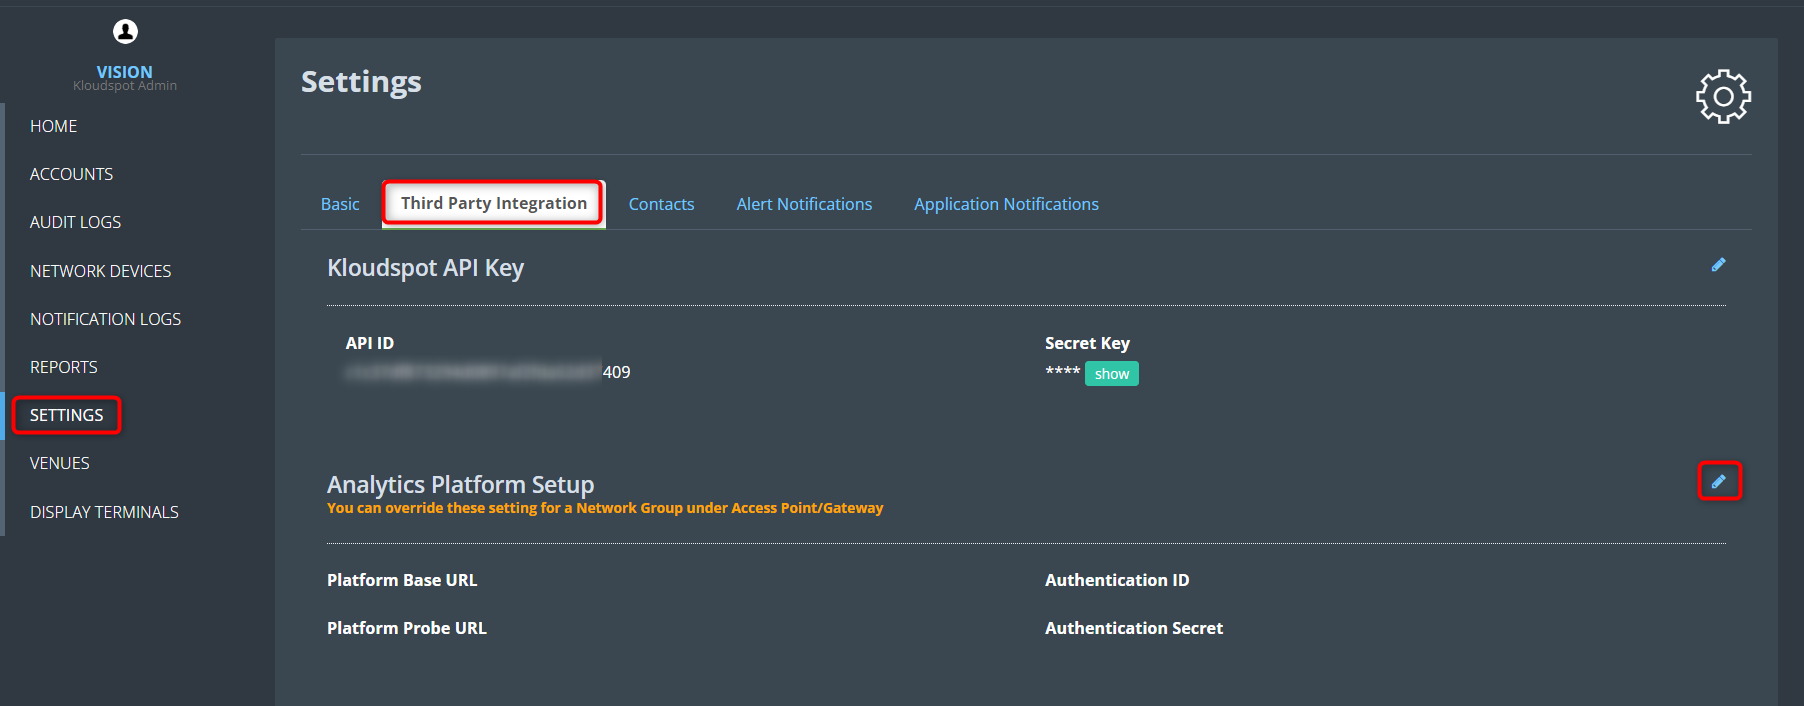
- Login to Kloudspot AP Management and edit the account configuration. Set the Platform Probe URL to point to the Analytics Engine HTTPS port (48083).
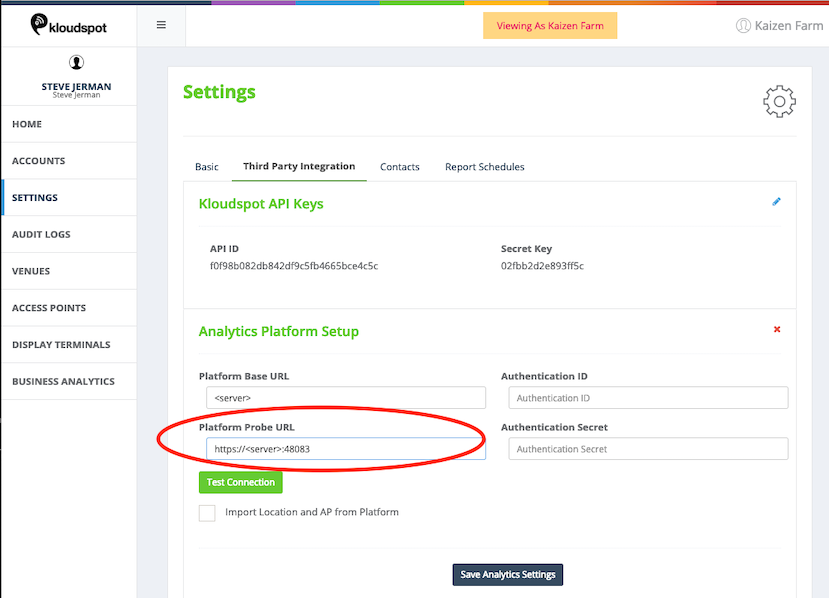
- Then edit the appropriate network groups to enable ‘Guest Proximity/Awareness’
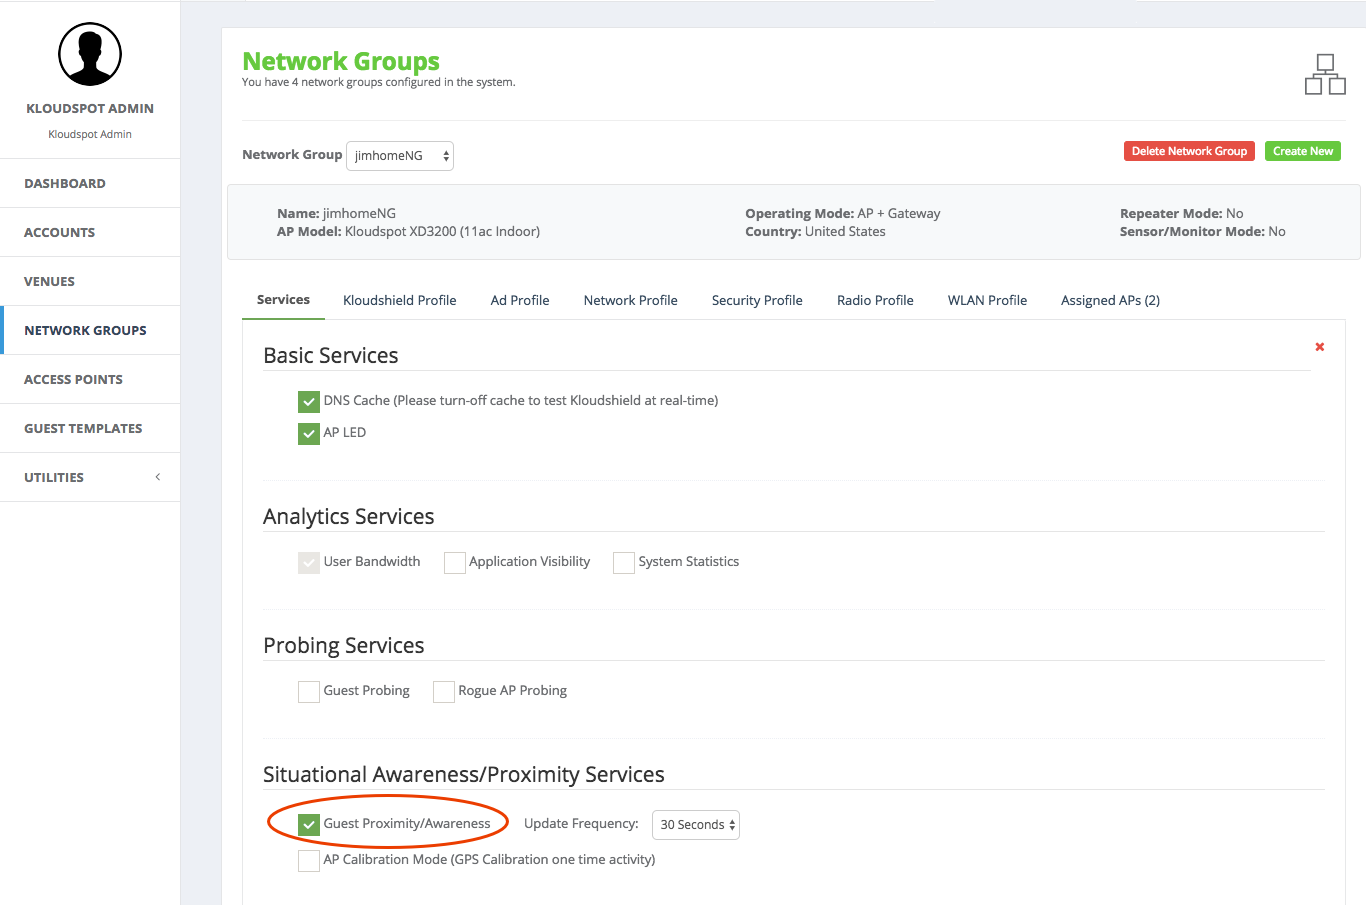
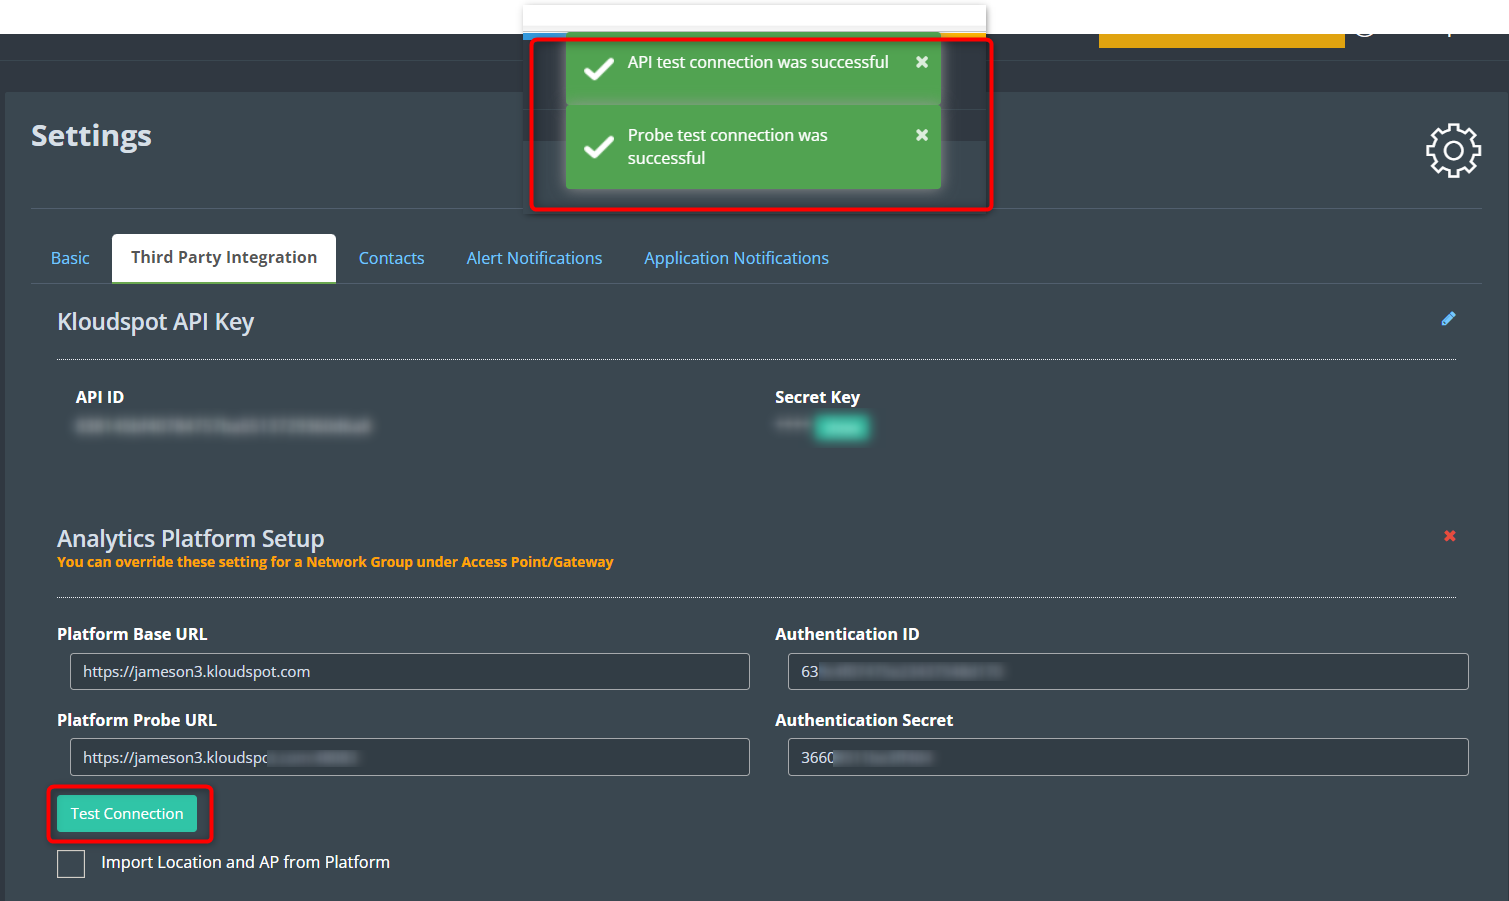
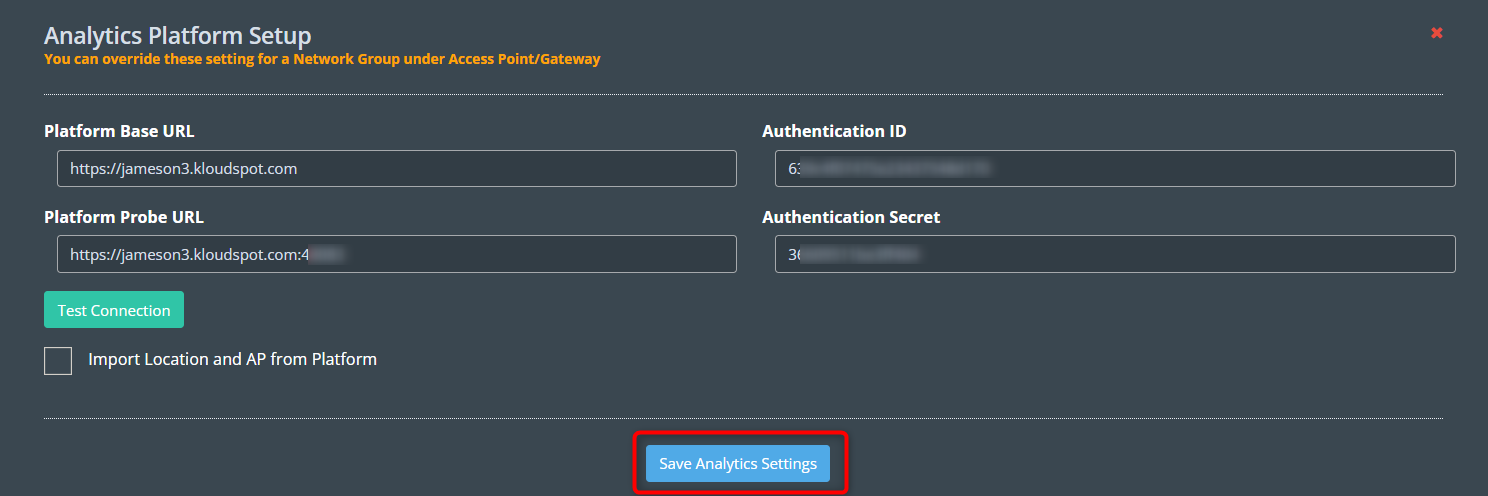
- Finally, select ‘Kloudspot APs’ in the Event sources in the Analytics Engine and click ‘Save’
Check Event Reception
Login to the Analytics Engine via SSH and run the kafka-listen command:
$ kafka-listen
{"vendor": "Kloudspot", "eventType": "PRESENCE", "location": null,..
{"vendor": "Kloudspot", "eventType": "PRESENCE", "location": null,..
{"vendor": "Kloudspot", "eventType": "PRESENCE", "location": null,..
{"vendor": "Kloudspot", "eventType": "PRESENCE", "location": null,..
You will be able to see the ‘raw’ event feed going into the stream processing.
NEC QX
Overview
The Kloudspot Analytics Engine can receive events from many types of WiFi
network.
One or more of event sources can be configured in the ‘Configuration - >
Event Processing - > Wi-Fi’ screen.
Validate the Receiver URLs
The protocol (HTTP/HTTPS) used varies depending on the source. We support both
HTTP and HTTPS protocols using port 48082 and 48083. Refer to the specific
data source below to determine the correct one to use.
If you have set a SSL certificate for the UI, that will be used instead of the
self signed one.
You can check access to both the HTTP and HTTPS urls with a ‘ping’:
$ curl http://{server}:48082/ping
hi from http receiver
$ curl -k https://{server}:48083/ping
hi from https receiver
NEC QX
available.
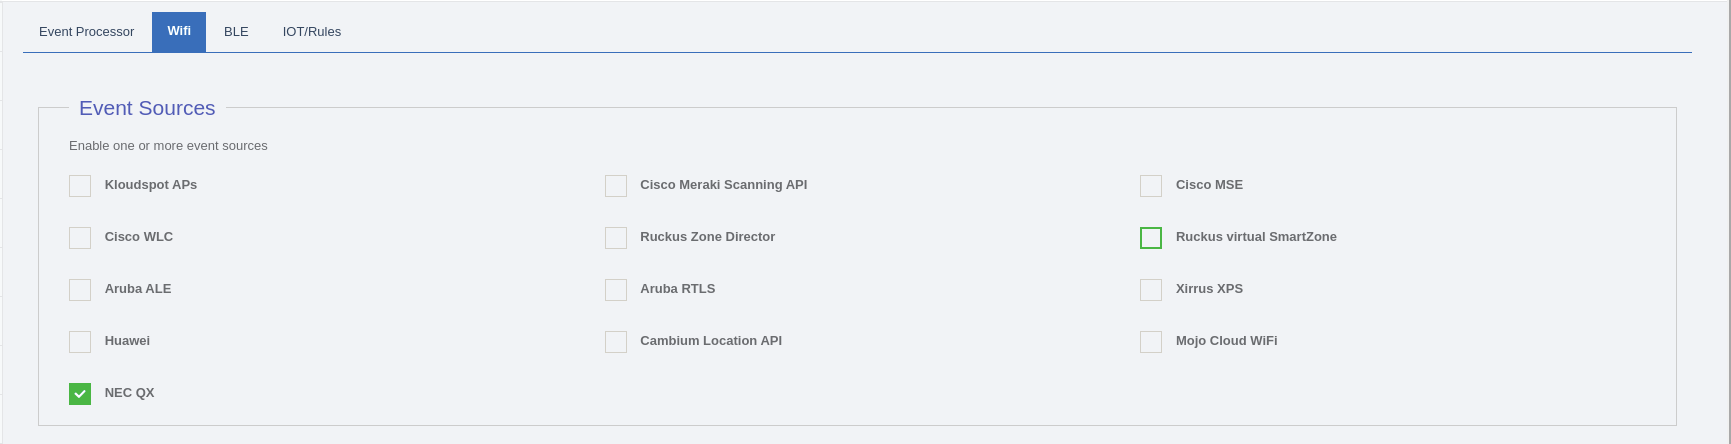
Enable location Services: To enable location services for NEC QX APs we need
to open 5555/UDP port.
Check Event Reception
Login to the Analytics Engine via SSH and run the kafka-listen command:
$ kafka-listen
{"vendor": "Kloudspot", "eventType": "PRESENCE", "location": null,..
{"vendor": "Kloudspot", "eventType": "PRESENCE", "location": null,..
{"vendor": "Kloudspot", "eventType": "PRESENCE", "location": null,..
{"vendor": "Kloudspot", "eventType": "PRESENCE", "location": null,..
You will be able to see the ‘raw’ event feed going into the stream processing.
Ruckus virtual SmartZone
Overview
The Kloudspot Analytics Engine can receive events from many types of WiFi
network.
One or more of event sources can be configured in the ‘Configuration - >
Event Processing - > Wi-Fi’ screen.
Validate the Receiver URLs
The protocol (HTTP/HTTPS) used varies depending on the source. We support both
HTTP and HTTPS protocols using port 48082 and 48083. Refer to the specific
data source below to determine the correct one to use.
If you have set a SSL certificate for the UI, that will be used instead of the
self signed one.
You can check access to both the HTTP and HTTPS urls with a ‘ping’:
$ curl http://{server}:48082/ping
hi from http receiver
$ curl -k https://{server}:48083/ping
hi from https receiver
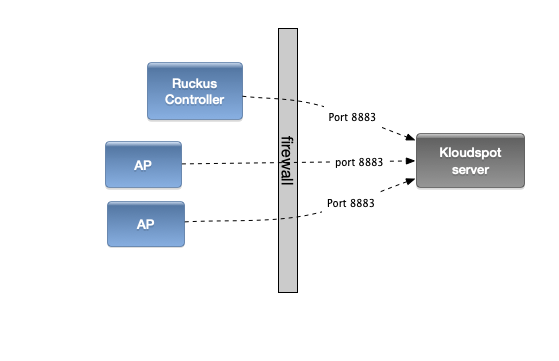
Ruckus virtual SmartZone
Port 8883 must be open from the Ruckus controller and APs to the Kloudspot
Analytics server. [See the Ruckus Zone Director instructions for
details](https://documentation.kloudspot.com/analytics/web-
ui/configuration/event-receivers#ruckus-zone-director).
In addition this integration needs access to the [Ruckus SmartZone
API](http://docs.ruckuswireless.com/sz-100/sz-public-api-reference-
guide-3-0.html) which is normally on port 7443.
Ruckus APs can send event data directly to the Kloudspot Analytics Engine. The
following steps set this up.
- Go the the event sources screen in the Kloudspot Analytics Engine and enable the ‘Ruckus virtual SmartZone’ source.
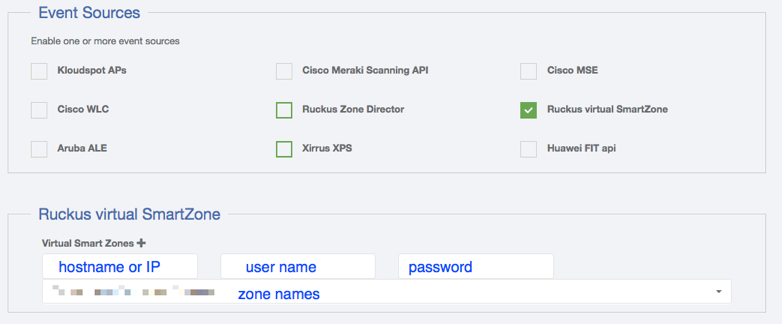
- Click the ‘+’ sign to add a virtual SmartZone contoller.
- Enter the server address and credentials.
- Once the server, username and password fields are valid, the Kloudspot Analytics Engine will contact the Ruckus server and download a list of zones. Select one or more zones from the dropdown.
- Click ‘Save’
At this point, the Kloudspot Analytics engine will contact the Ruckus virtual
SmartZone controller and set up all the required Location Based Services
configuration.
Check Event Reception
Login to the Analytics Engine via SSH and run the kafka-listen command:
$ kafka-listen
{"vendor": "Kloudspot", "eventType": "PRESENCE", "location": null,..
{"vendor": "Kloudspot", "eventType": "PRESENCE", "location": null,..
{"vendor": "Kloudspot", "eventType": "PRESENCE", "location": null,..
{"vendor": "Kloudspot", "eventType": "PRESENCE", "location": null,..
You will be able to see the ‘raw’ event feed going into the stream processing.
Ruckus Zone Director
Overview
The Kloudspot Analytics Engine can receive events from many types of WiFi
network.
One or more of event sources can be configured in the ‘Configuration - >
Event Processing - > Wi-Fi’ screen.
Validate the Receiver URLs
The protocol (HTTP/HTTPS) used varies depending on the source. We support both
HTTP and HTTPS protocols using port 48082 and 48083. Refer to the specific
data source below to determine the correct one to use.
If you have set a SSL certificate for the UI, that will be used instead of the
self signed one.
You can check access to both the HTTP and HTTPS urls with a ‘ping’:
$ curl http://{server}:48082/ping
hi from http receiver
$ curl -k https://{server}:48083/ping
hi from https receiver
Ruckus Zone Director
The Ruckus APs use the MQTT protocol to
communicate with the Kloudspot Analytics server. For this to work Port 8883
must be open from the Ruckus controller and APs to the Kloudspot Analytics
server:
Ruckus APs can send event data directly to the Kloudspot Analytics Engine. The
following steps set this up.
- Go the the event sources screen in the Kloudspot Analytics Engine and enable the ‘Ruckus Zone Director’ source. Note the secret key and then restart the Stream Processing job.
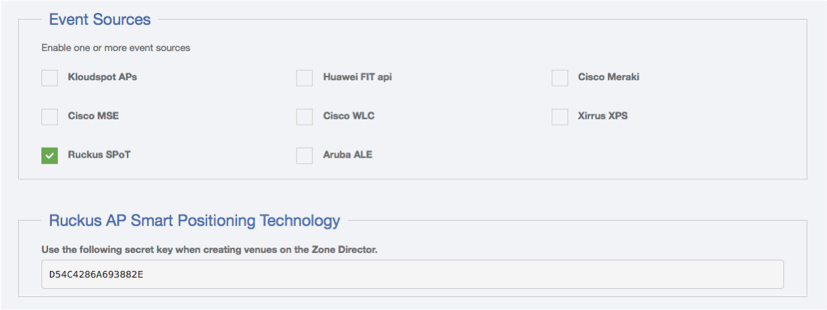
- Click ‘Save’
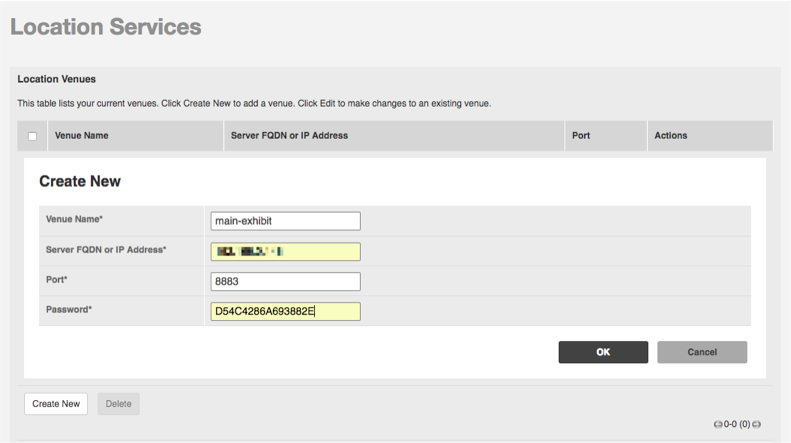
- Go to the Ruckus Zone Director. Login and select the Services & Profiles -> Location Services menu entry.
- Click ‘Create New’
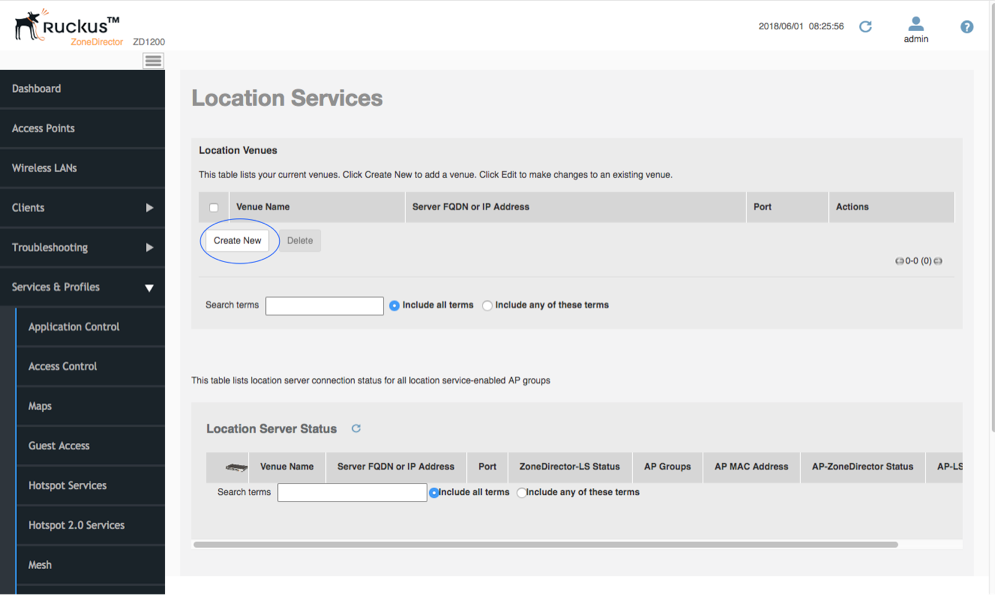
- Enter the required information including the secret key from above and click OK.
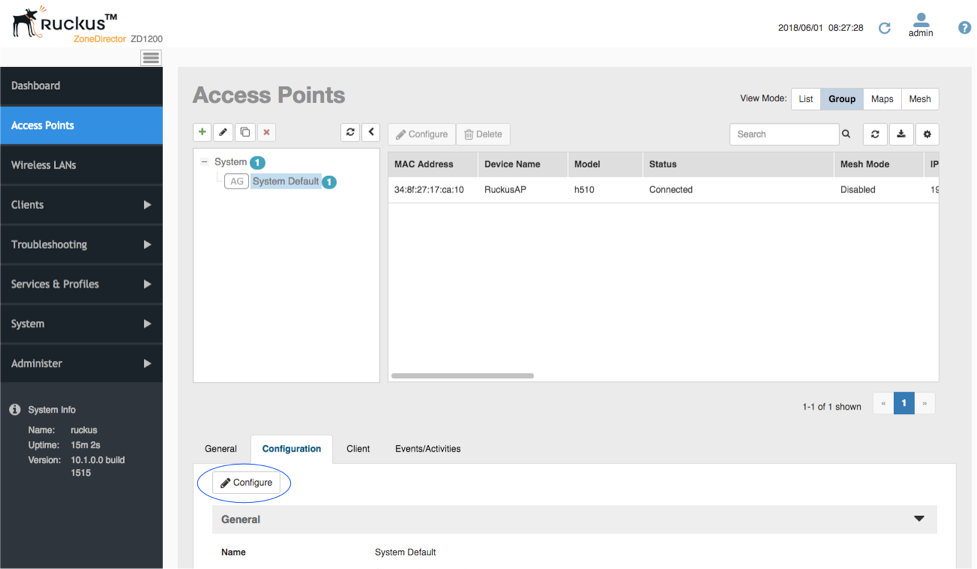
- Then select the Access Points menu entry. Select the access point group for which you want to send events. Click configure.
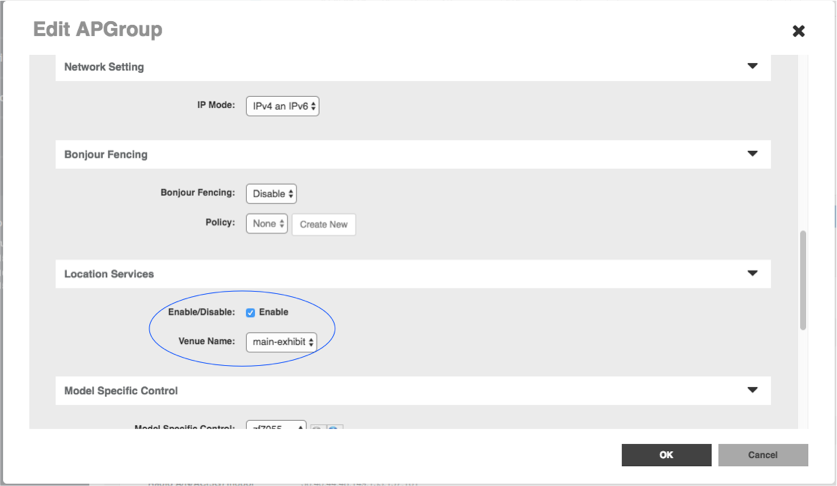
- Scroll down to Location Services and enable the venue we just set up. Click ‘OK’.
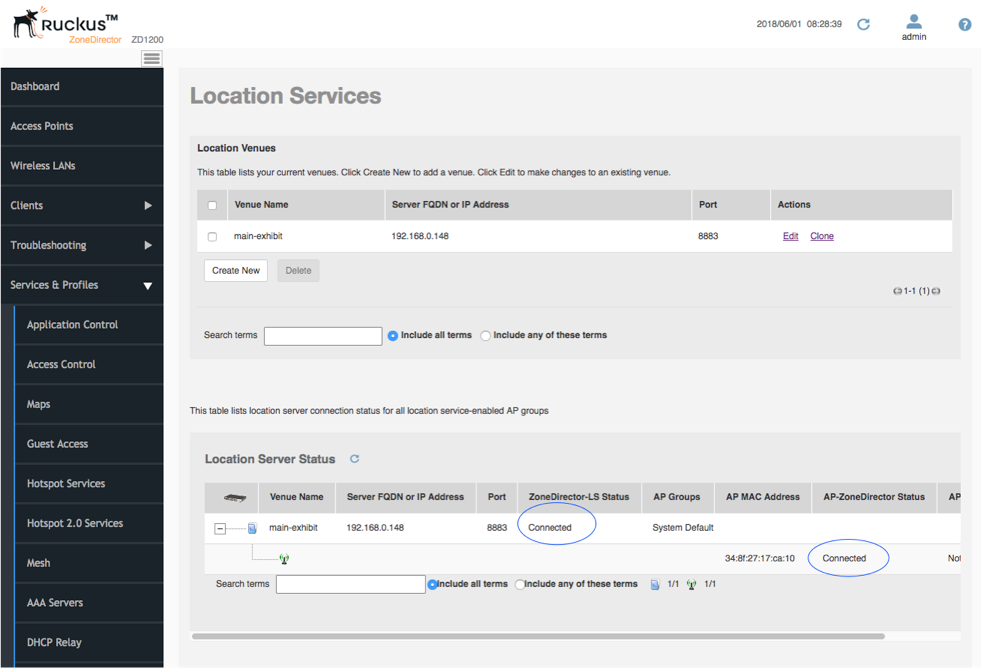
- Finally select the Services & Profiles -> Location Services menu entry. You now see the director and the APs all showing connected status.
Check Event Reception
Login to the Analytics Engine via SSH and run the kafka-listen command:
$ kafka-listen
{"vendor": "Kloudspot", "eventType": "PRESENCE", "location": null,..
{"vendor": "Kloudspot", "eventType": "PRESENCE", "location": null,..
{"vendor": "Kloudspot", "eventType": "PRESENCE", "location": null,..
{"vendor": "Kloudspot", "eventType": "PRESENCE", "location": null,..
You will be able to see the ‘raw’ event feed going into the stream processing.
Xirrus XPS
Overview
The Kloudspot Analytics Engine can receive events from many types of WiFi
network.
One or more of event sources can be configured in the ‘Configuration - >
Event Processing - > Wi-Fi’ screen.
Validate the Receiver URLs
Most of the receivers below ‘push’ to a specific URL. The protocol
(HTTP/HTTPS) used varies depending on the source. We support both HTTP and
HTTPS protocols using port 48082 and 48083. Refer to the specific data source
below to determine the correct one to use.
If you have set a SSL certificate for the UI, that will be used instead of the
self signed one.
You can check access to both the HTTP and HTTPS urls with a ‘ping’:
$ curl http://{server}:48082/ping
hi from http receiver
$ curl -k https://{server}:48083/ping
hi from https receiver
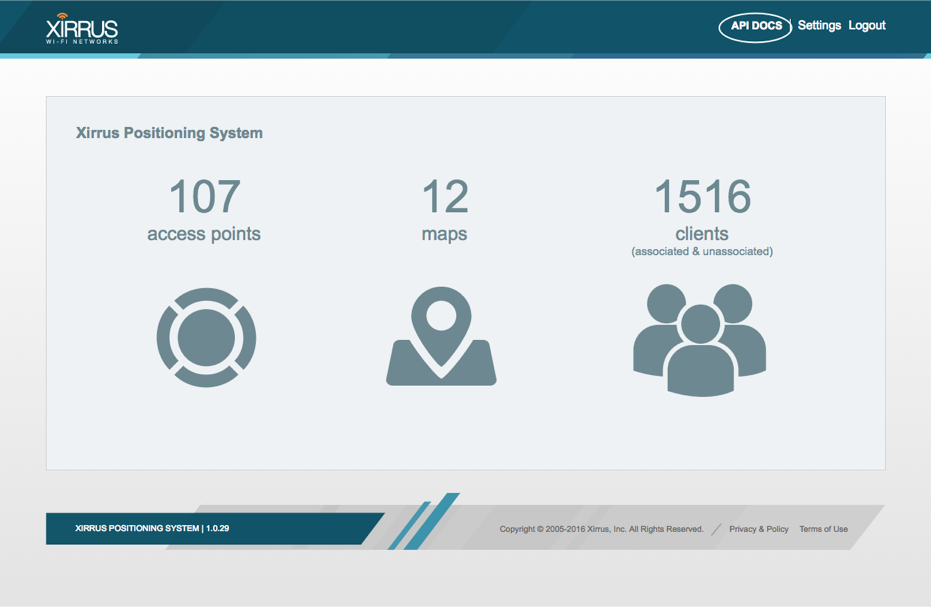
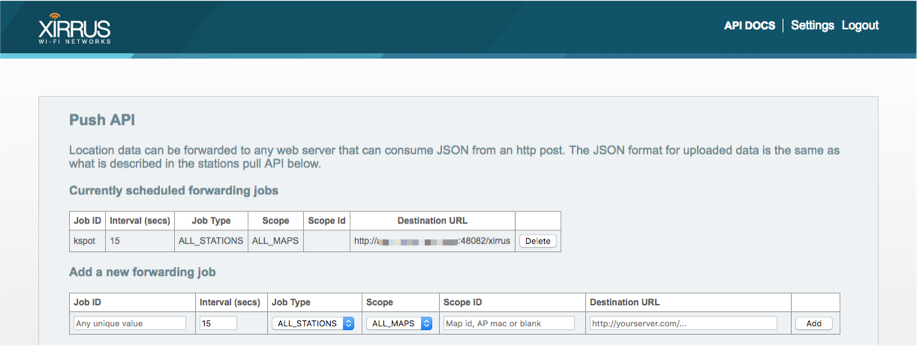
Xirrus XPS
The Kloudspot Analytics Engine can receive location update events from the
Xirrus Positioning System (XPS) as follows:
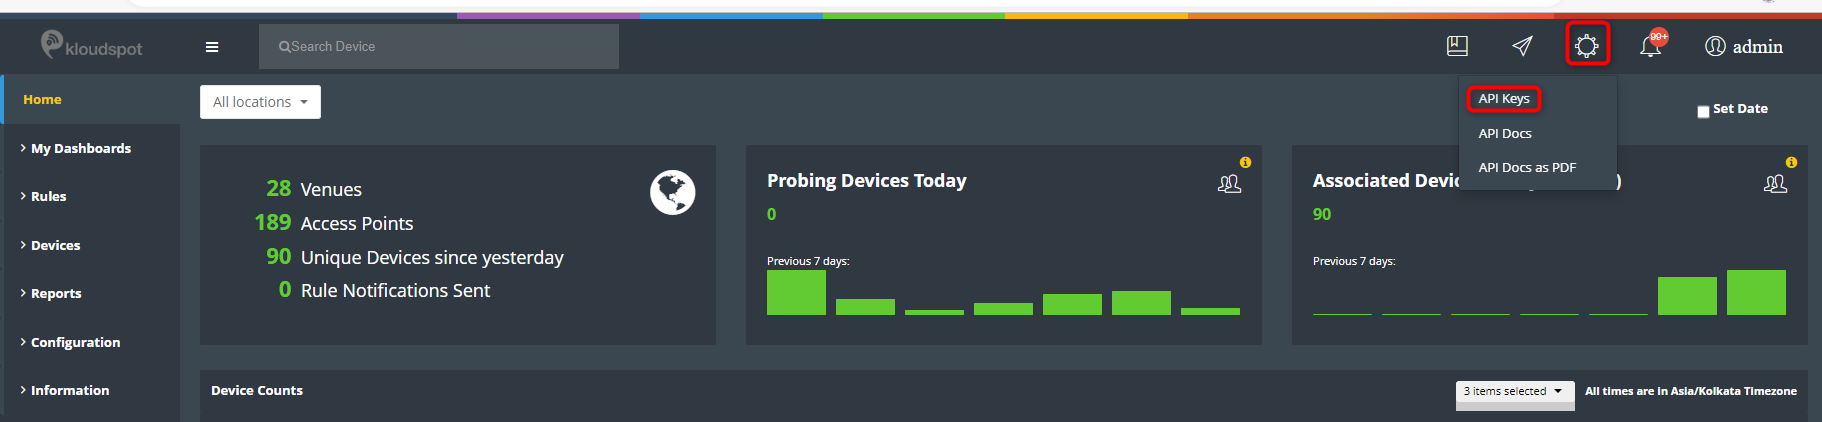
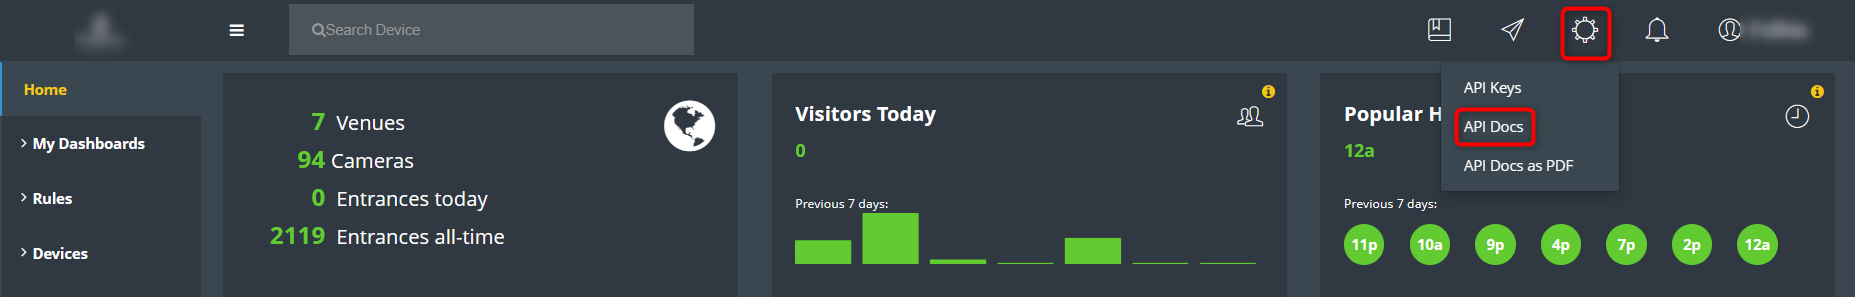
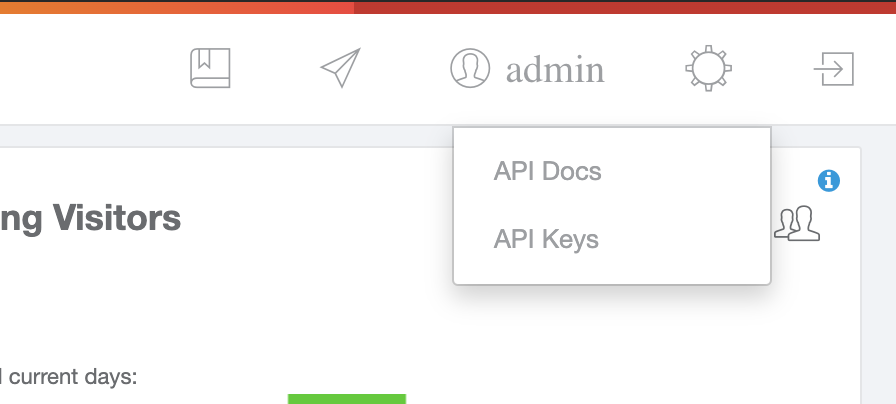
- Enable the Xirrus Event source in the Kloudspot Analytics Engine.
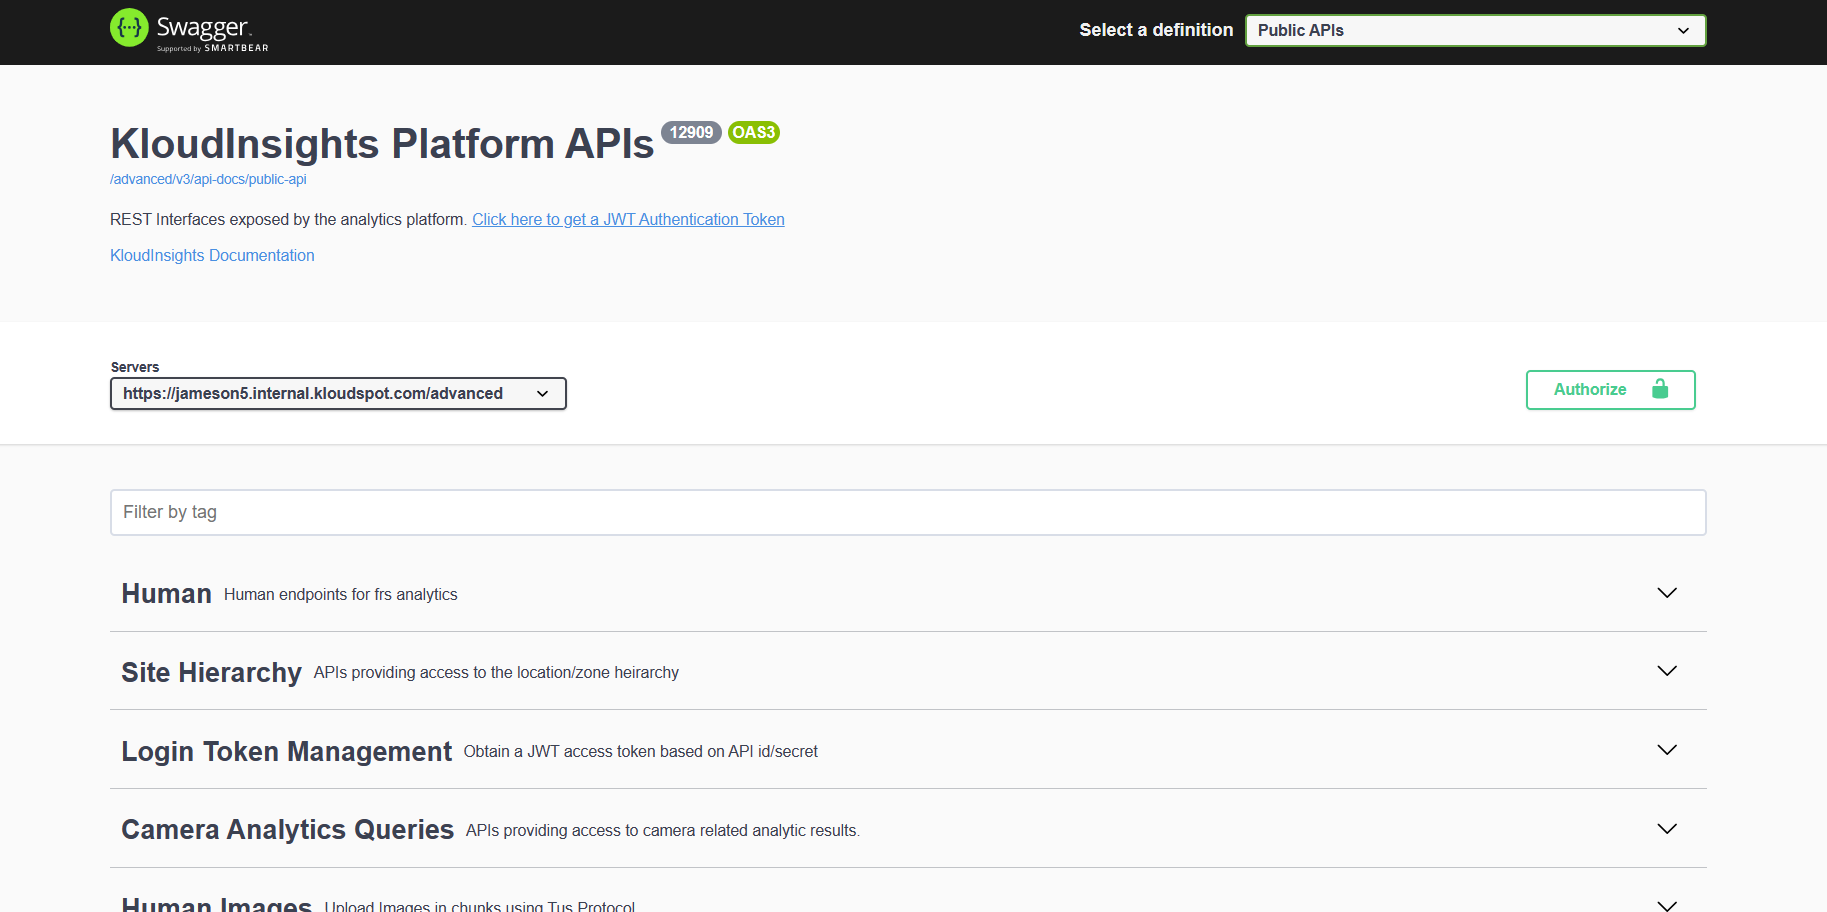
- Next login to XPS, click on API Docs
 You should immediately start receiving
events from the XPS.
You should immediately start receiving
events from the XPS.
The feed sent from the XPS doesn’t include information about APs. In order to
deal with this, some special configuration (including setting an External
Reference ID) is needed when setting up the location configuration in the
Analytics Engine. Please ask your Klouspot contact with help setting this up.
Check Event Reception
Login to the Analytics Engine via SSH and run the kafka-listen command:
$ kafka-listen
{"vendor": "Kloudspot", "eventType": "PRESENCE", "location": null,..
{"vendor": "Kloudspot", "eventType": "PRESENCE", "location": null,..
{"vendor": "Kloudspot", "eventType": "PRESENCE", "location": null,..
{"vendor": "Kloudspot", "eventType": "PRESENCE", "location": null,..
You will be able to see the ‘raw’ event feed going into the stream processing.