Project Analytics
Overview
The “Project Analytics” feature in the KloudHybrid app empowers users with the tools and insights necessary to analyze and evaluate project performance. By leveraging the data and metrics provided, users can make informed decisions, optimize project outcomes, and drive continuous improvement within their projects and organizations.
Open Project Analytics
-
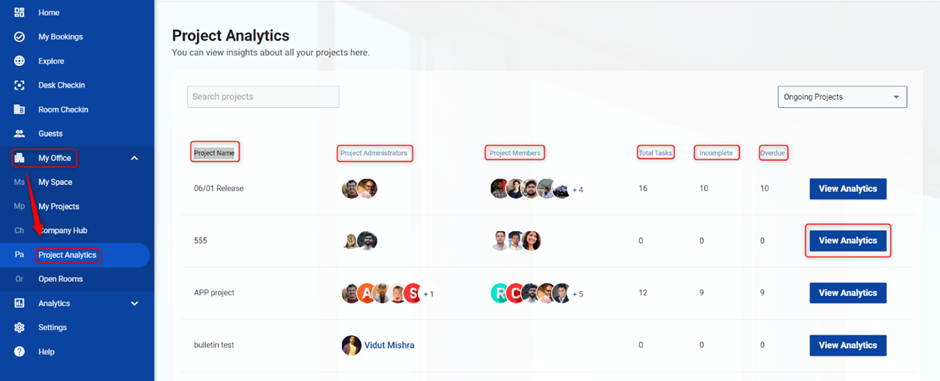
Project analytics can be used to get insights about the project. To go to the project analytics page, click on Project Analytics from the My Office dropdown menu. The list of projects will open.
-
You can search for Projects using the search bar
-
You can sort projects using the drop-down menu.
-
The project analytics page contains basic information related to the project.
Project name, Project administrators, Project members, total tasks, incomplete tasks, overdue, etc.
-
To know more about the project, click on the View Analytics button.
To view the Analytics
-
Click on View Analytics Button.
-
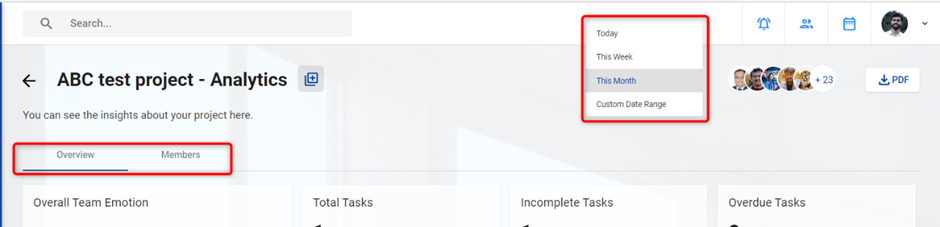
If you want to know the project statistics for a specific period, you can use the date filter option. 4 filter options are available Today, This week, This Month and Custom date range.
-
It mainly consists of 2 tabs.
- Overview tab
- Members tab
Overview tab
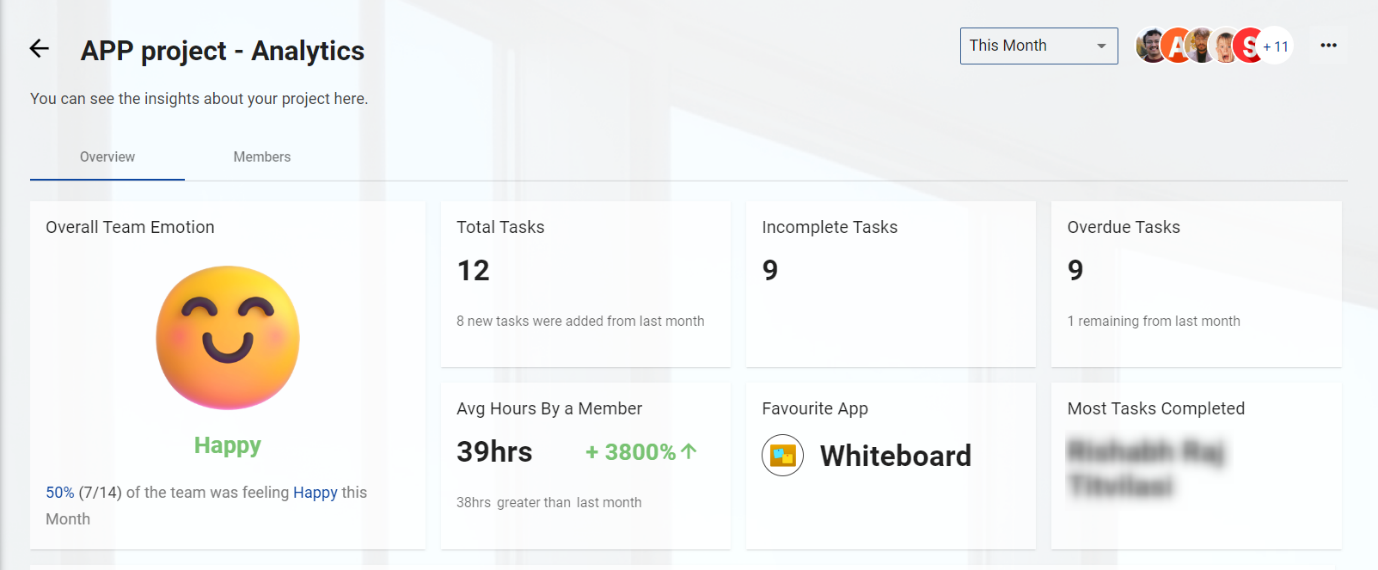
The information contained in the overview tab is listed below.
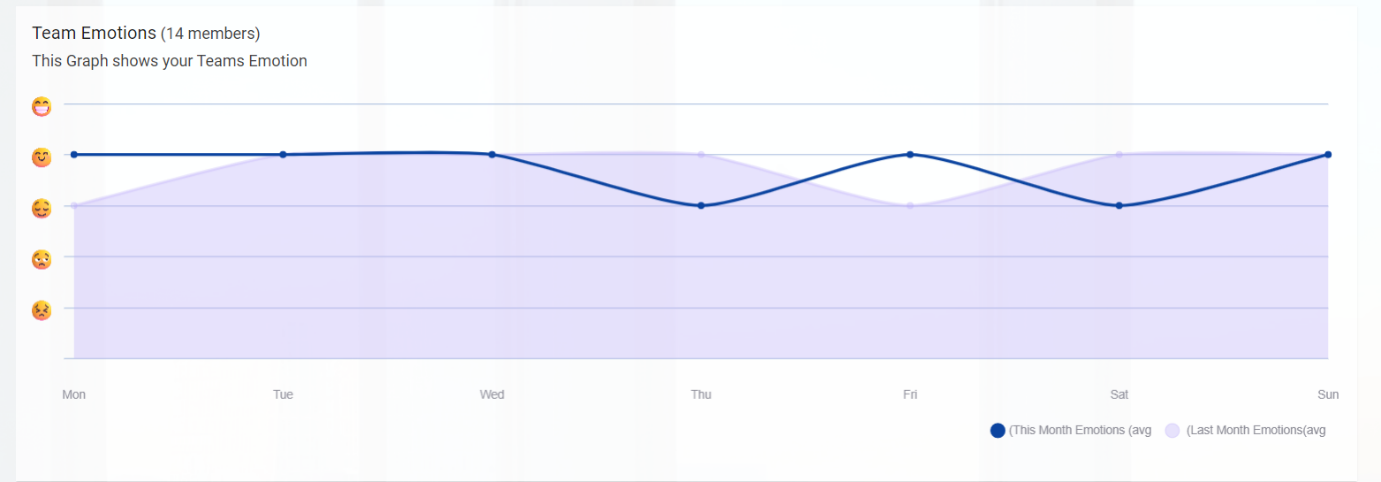
- Overall team emotion: Shows the average of everyone’s emotion. It is calculated based on the time of mood recorded by each member.
- Total tasks: Shows the number of tasks that have been added to this project so far.
- Incomplete tasks: Shows the number of unfinished tasks.
- Overdue tasks: Shows the number of tasks that have not been completed even after the due date.
- Avg Hours By a Member:
- Favourite App: Shows which app is most used in this project.
- Most Tasks Completed: Shows who has completed the most tasks.
Note: The result will vary depending on the period selected.
- Team Emotion graph: The emotions of the members of the team are recorded in graph form. This is shown based on the selected period.
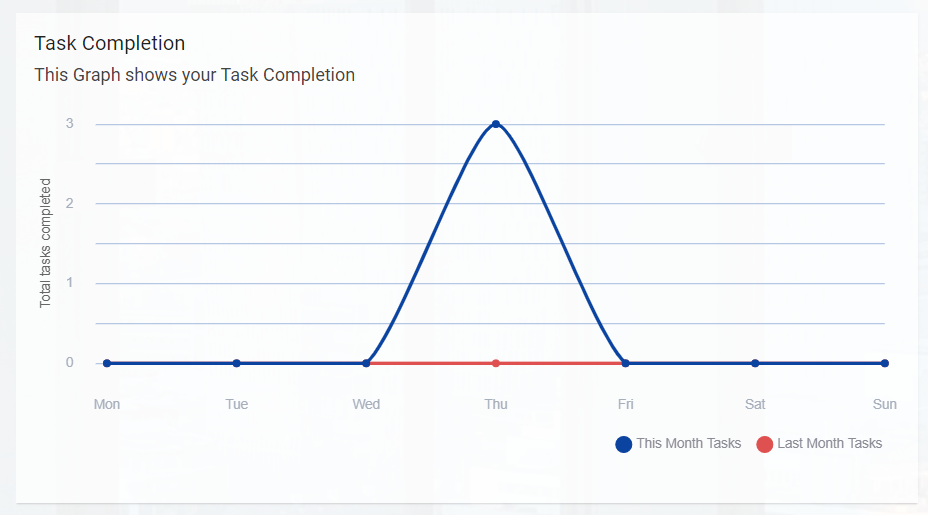
- Task Completion graph: The completed projects in the selected period are shown in graph form.
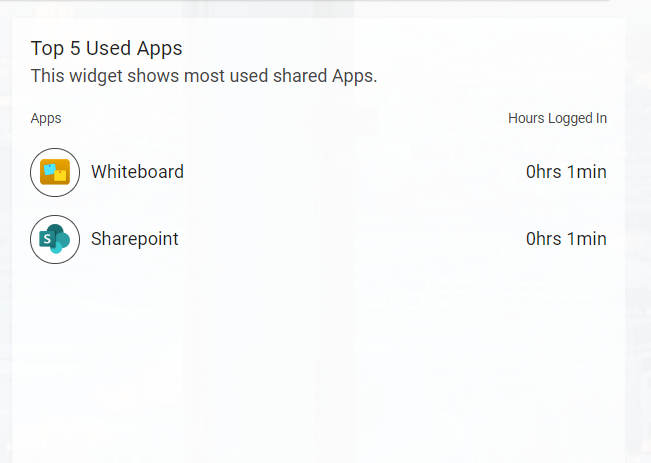
- Top 5 Used Apps: Shows which are the 5 most used apps for this project.
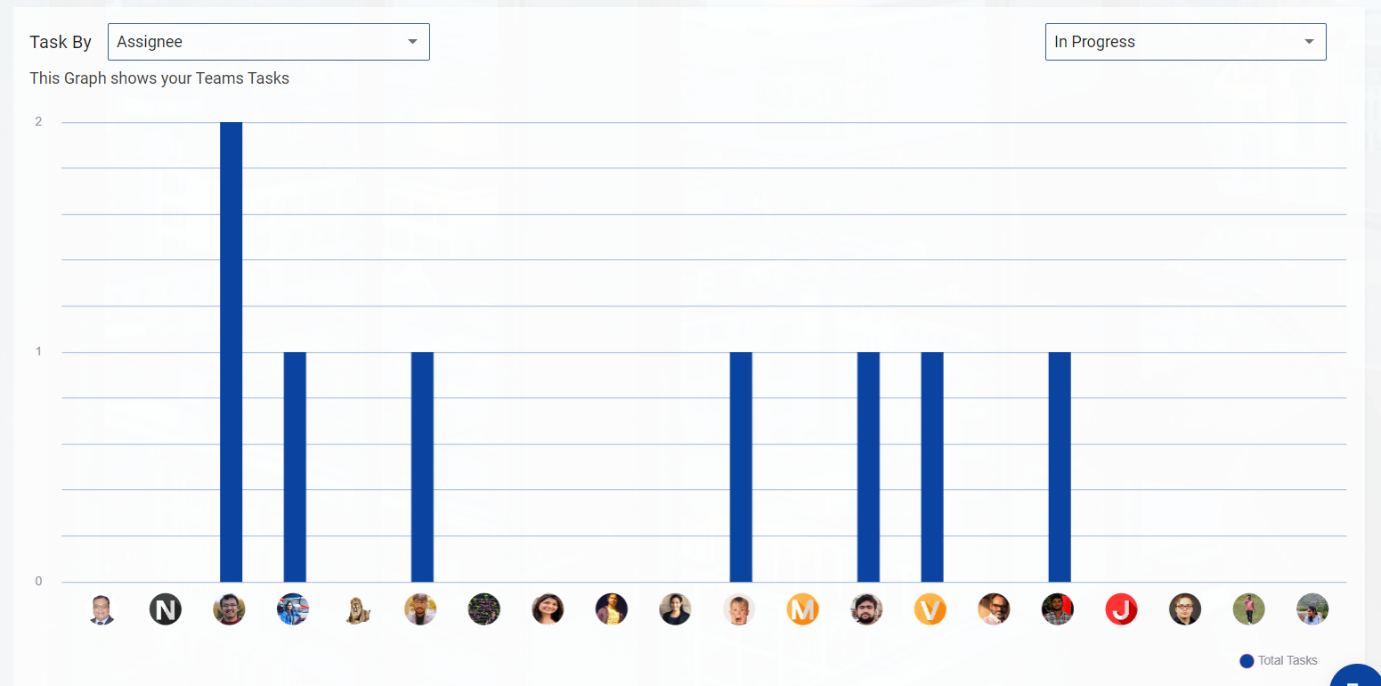
- Teams task graph: The chart shows the number of tasks assigned to each member of the team.
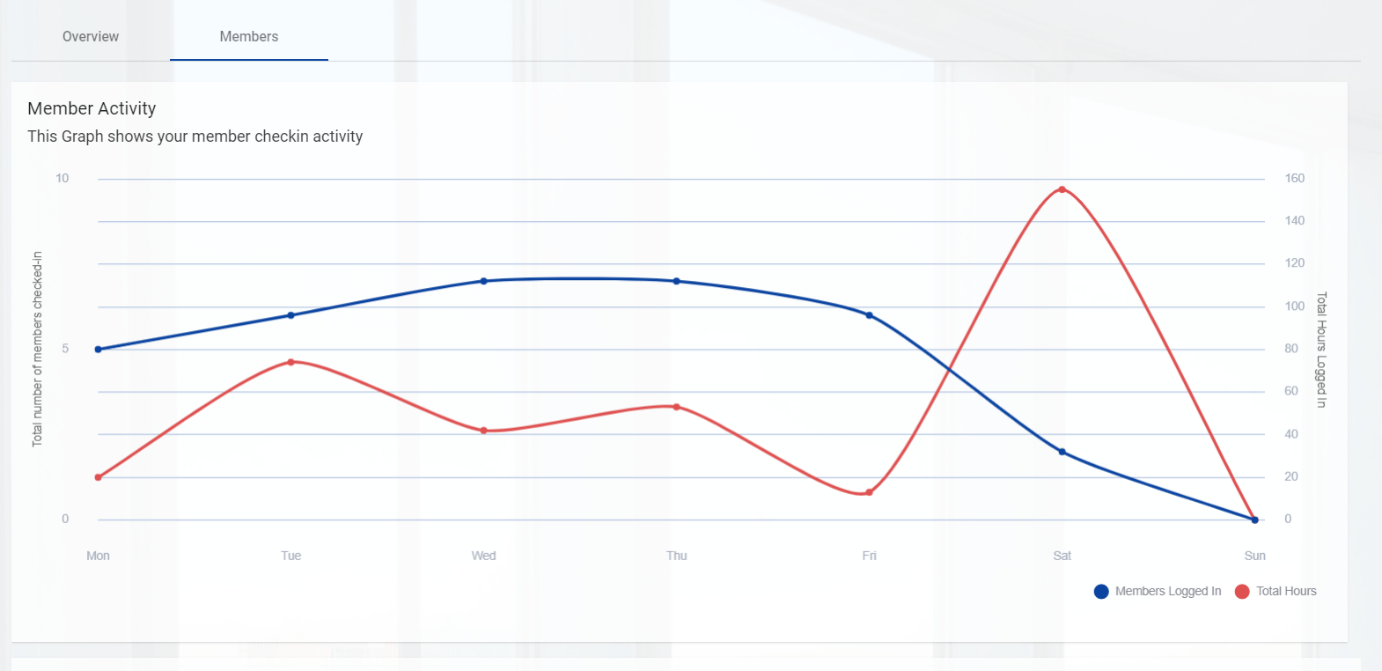
Members tab
- The member’s tab mainly shows the activities of the individuals who are part of the project.
Member activity graph: This graph displays the check-in activity of project members.
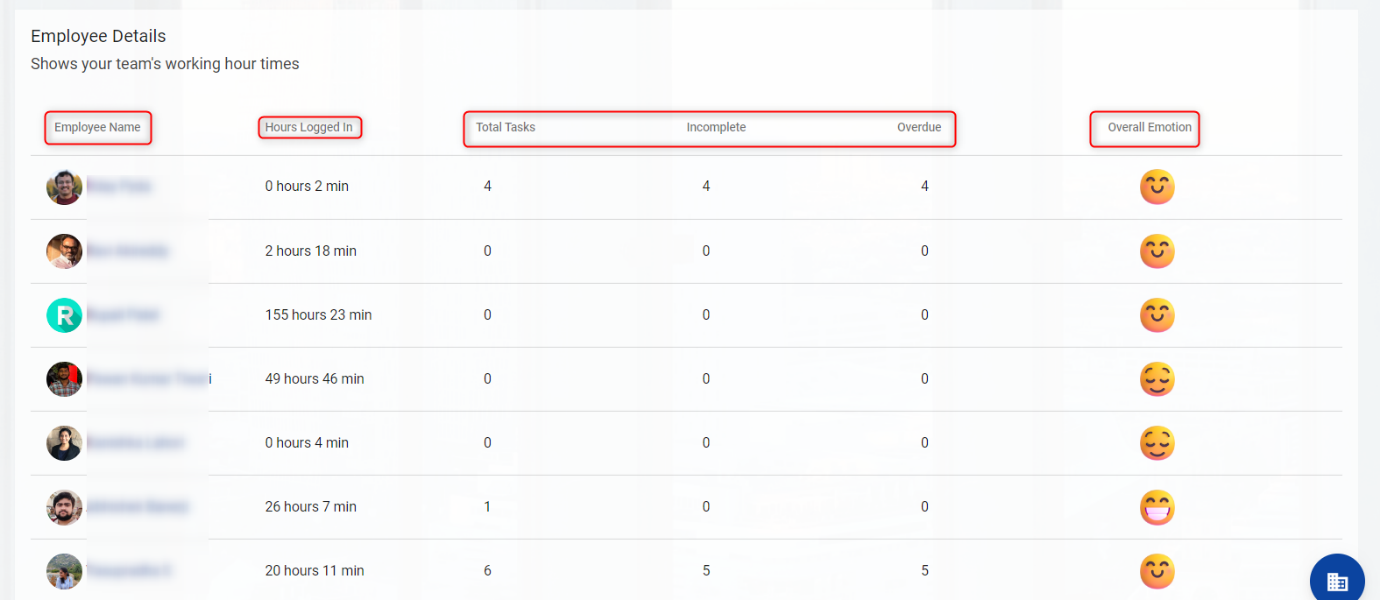
Employee Details:
- Employee name
Shows the name of the members contained in the project.
- Hours Logged In
Displays the amount of time spent on the project.
- Task details
Helps to find out how many tasks have been completed and how many are yet to be completed.
- Emotion
Displays each member’s mood for the day. Visit the Avatar Button to learn more about mood.