Analytics
For generating and processing various types of reports, refer the given document. You can use this feature to create the following reports:
- Summary
- Housekeeping
- Punchcard
- Contact Tracing
- Timesheet
- Availability
- Direct Reports
- Manage booking
- Infospots
- Conference Room usage
This menu is enabled only in the Admin privileges.
It has the following sub-menus:
- Hot Desk
- Conference Room
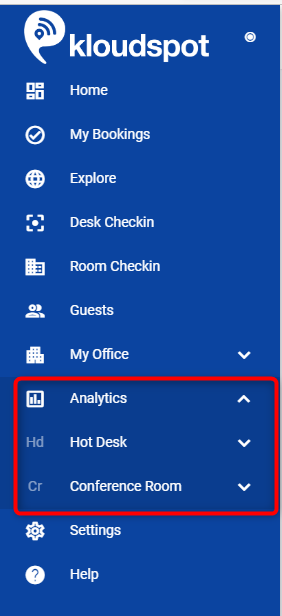
Hot Desk
- It helps to understand how effective space utilization is. It allows you to review the physical and virtual login of employees.
- It is also possible to trace the contact of physically logged employees in case of an emergency.
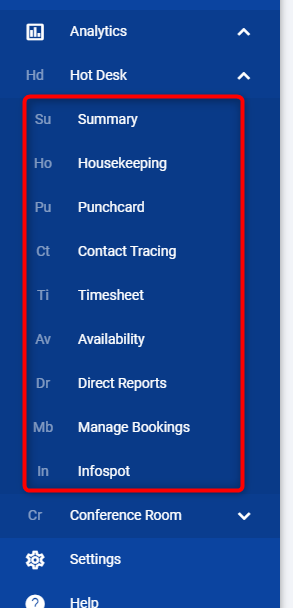
Functions with Hot Desk are added below.
- Summary
- Housekeeping
- Punchcard
- Contact Tracing
- Timesheet
- Availability
- Direct Reports
- Manage booking
- Infospots
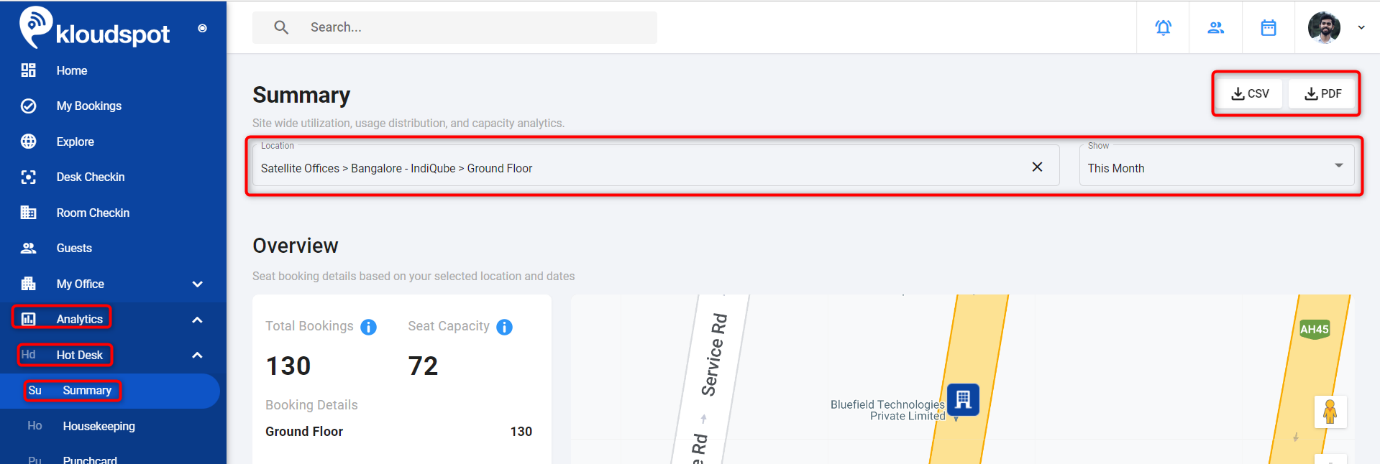
Summary
- The summary report generates the overall report with respect to the location and the period selected.
- Based on the location and the period selected, the report is generated which comprises of Overview, Utilization, Peak Utilization Statistics. The Peak Utilization Statistics has Space Utilization, Booking Hours Distribution, Usage Days Of the Week, Hours Of The Day. The report is generated for both physical and virtual bookings.
To generate the summary:
- Navigate to Analytics > Hot Desk > Summary.
- Select the location from the Location drop-down menu. And select the report generation period
- When you select Custom Date Range, select a range of dates you want in the calendar.
- The summary report will be generated immediately.
- The generated report can be saved as a PDF by clicking on the PDF button.
- The generated report can be saved as a CSV by clicking on the CSV button.
The report has 3 sections.
- Overview
- Utilization
- Peak Utilization Statistics
Overview
- The overview section shows the seat booking details for the selected period.
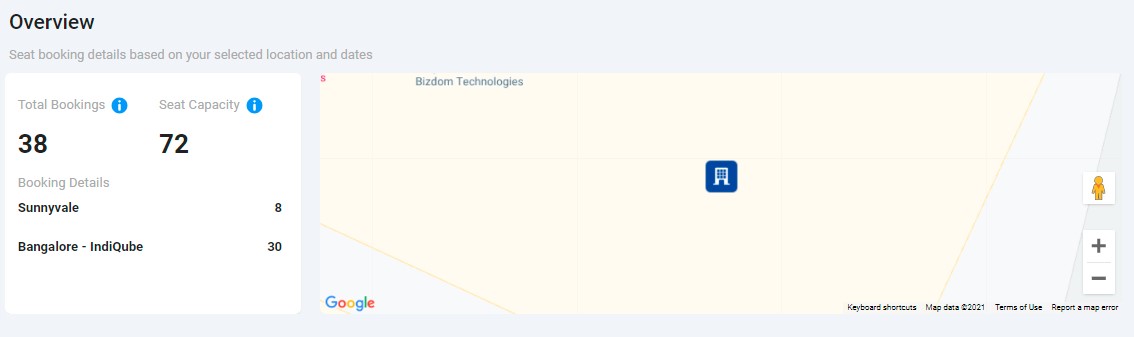
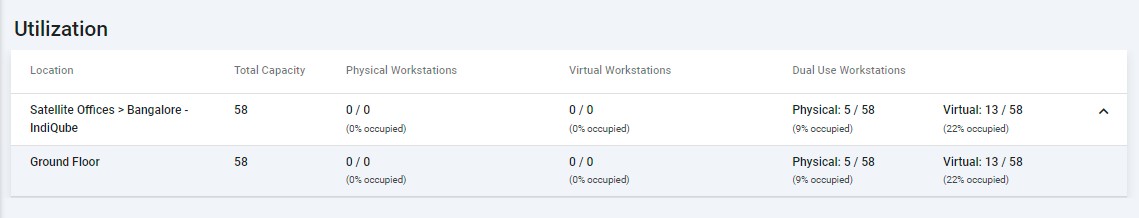
Utilization
- In the utilization section, we get physical and virtual seat booking information for a specific period at the selected location.
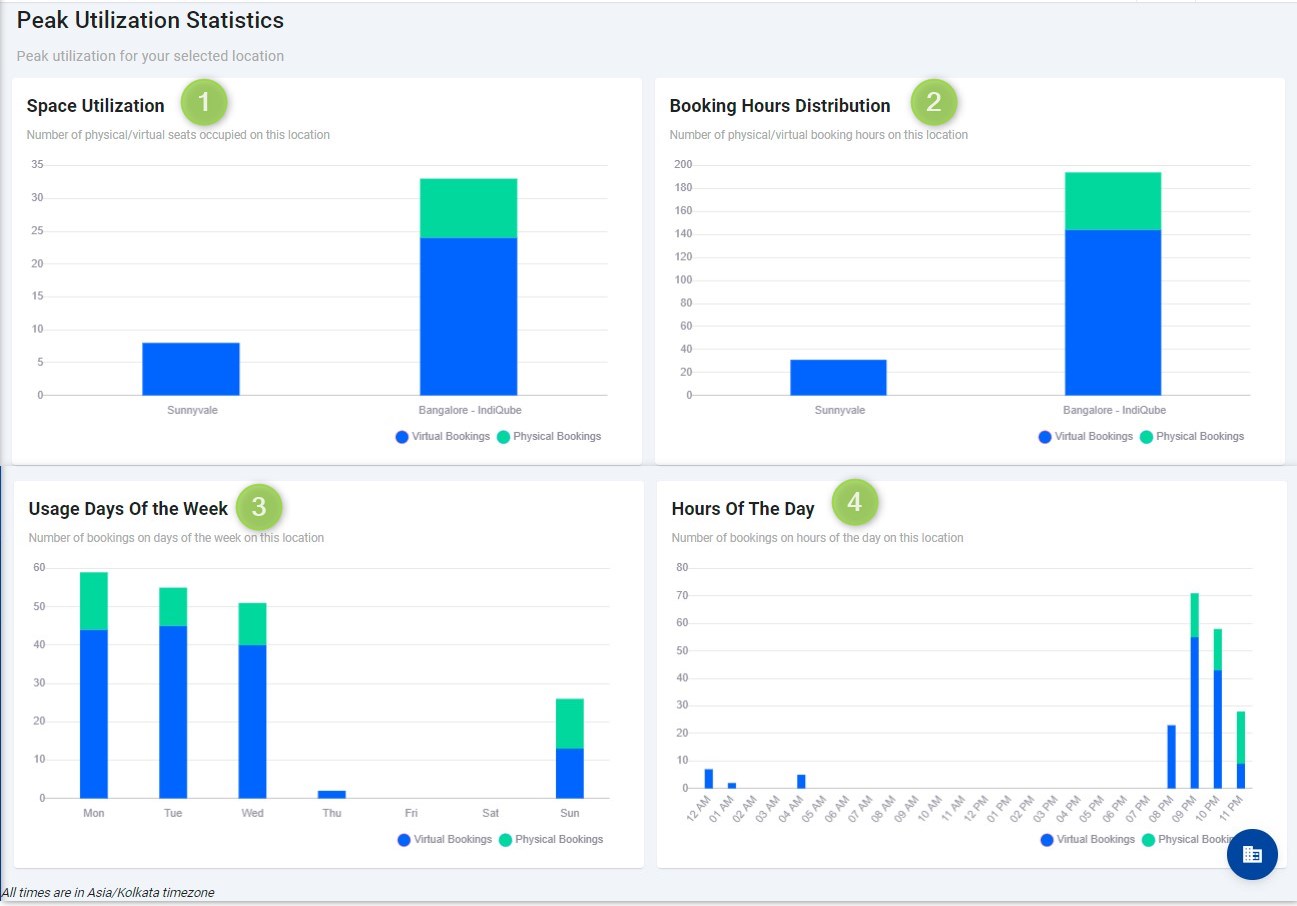
Peak Utilization Statistics
Peak Utilization Statistics provide valuable insights into the usage of seats at a selected location. These statistics are presented through various graphs and highlight important information, including:
-
Space utilization: This graph displays the total number of seats that were booked at the selected location over a specific period. It gives an overview of the overall demand for seats and can help identify peak booking periods.
-
Booking Hours Distribution: This graph showcases the number of hours each seat was used or occupied during the selected time frame. It provides an understanding of how long seats were utilized, which can be useful for optimizing seat allocation or identifying underutilized seats.
-
Usage days of the Week: This graph illustrates the daily booking trends, showcasing the number of seats that were booked each day. It allows for the analysis of daily fluctuations in seat demand and helps identify patterns or recurring trends.
-
Hours of the day: This graph focuses on the hourly distribution of seat bookings. It provides a breakdown of how many seats were booked during each hour of the day. This information can be particularly useful for understanding peak hours of seat utilization or identifying any specific time slots with consistently high or low demand.
These statistics play a crucial role in facilitating data-driven decision-making for managing seat availability, optimizing resources, and improving overall customer satisfaction. By analyzing these graphs, organizations can identify patterns, trends, and potential areas for improvement in their seat booking systems.
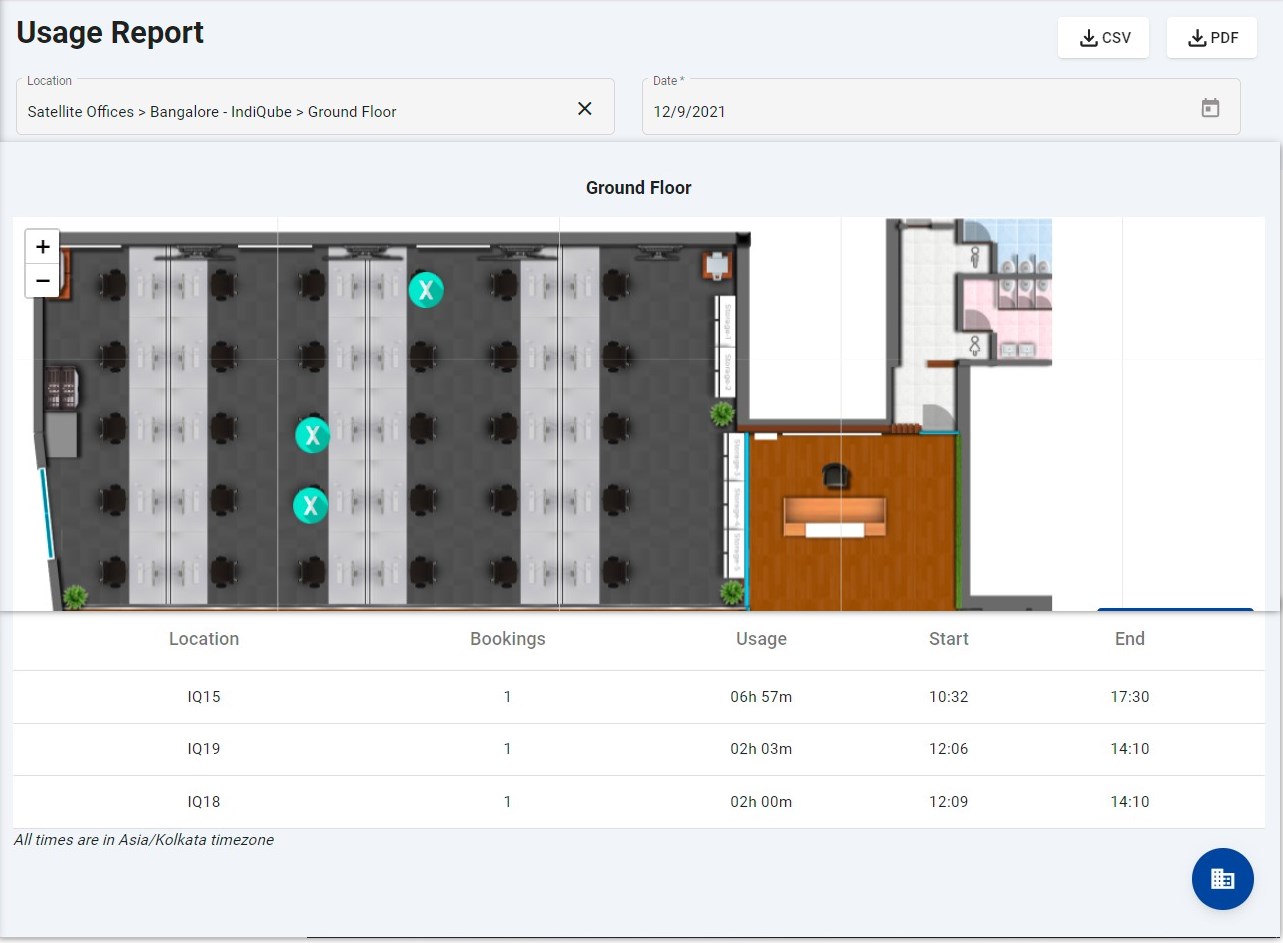
Housekeeping
- The Housekeeping report generates the data based on the location (floor wise) and the date selected.
- The Housekeeping report shows how many users physically logged in to the selected location and which seat they occupied.
- Cleaning can be done at utilised workplaces depending on the usage.
To generate the housekeeping report:
- Navigate to Analytics > Hot Desk > Housekeeping.
- Select the location from the location drop-down menu. And select the date.
- The House Keeping report will be generated immediately. The occupied Seats are indicated by a blue circle with an x mark as shown in the figure.
- The generated report can be saved as a PDF by clicking on the PDF button.
- The generated report can be saved as a CSV format by clicking on the CSV button.
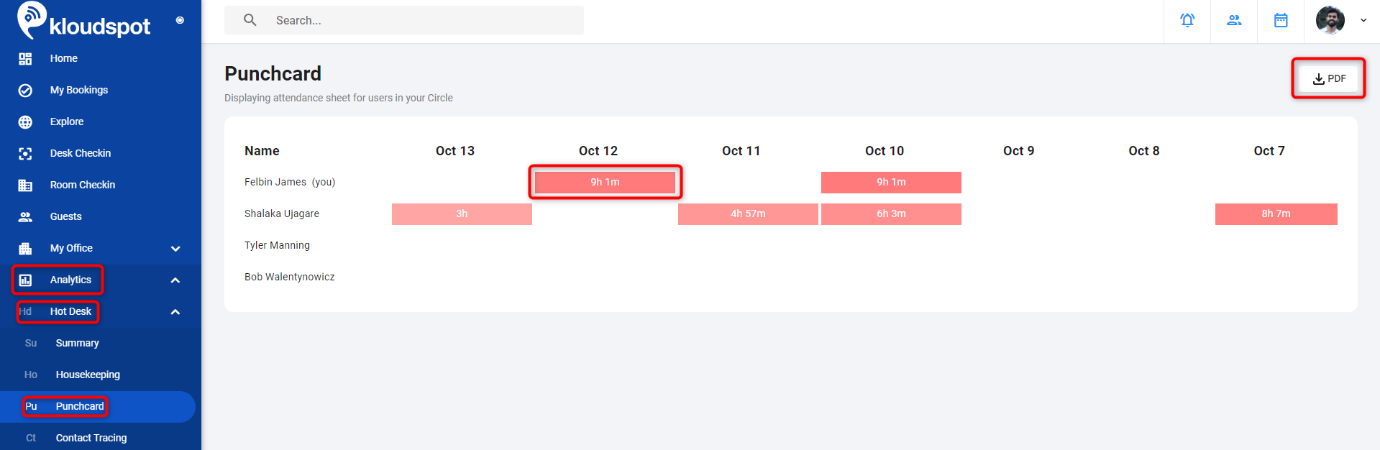
Punchcard
-
This page displays the attendance sheet of all your friends and colleagues added to your circle. Refer “My Circle/My Schedule Details” section to know about My Circle.
-
To view the working hours for each day, navigate to Analytics > Hot Desk > Punchcard.
-
Then Pachcard report will be generated, from which you can see the attendance sheet of users in your circle for a week.
-
The generated report can be saved as a PDF by clicking on the PDF button.
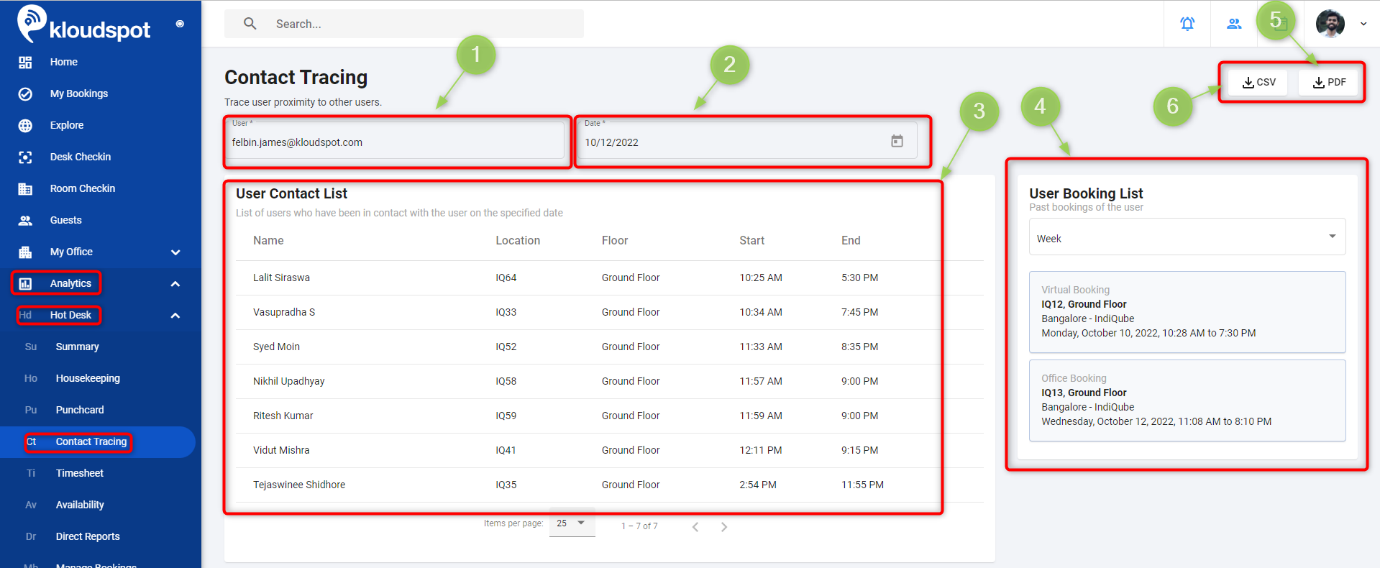
Contact Tracing
- Admin can use this to determine who is most likely to be contacted directly by a given user on a given day.
To generate the report for the contact tracing:
- Enter a name in the User field and then select a user from the search results.
- Then Select Date. The report is generated.
- The report displays a list of people who are likely to contact the selected person on the selected day.
- In addition, the User Booking List column contains information about the user’s bookings. The details of the user’s bookings made in the last month or week can be obtained using this.
- The generated report can be saved as a PDF by clicking on the PDF button.
- The generated report can be saved as a excel format by clicking on the CSV button.
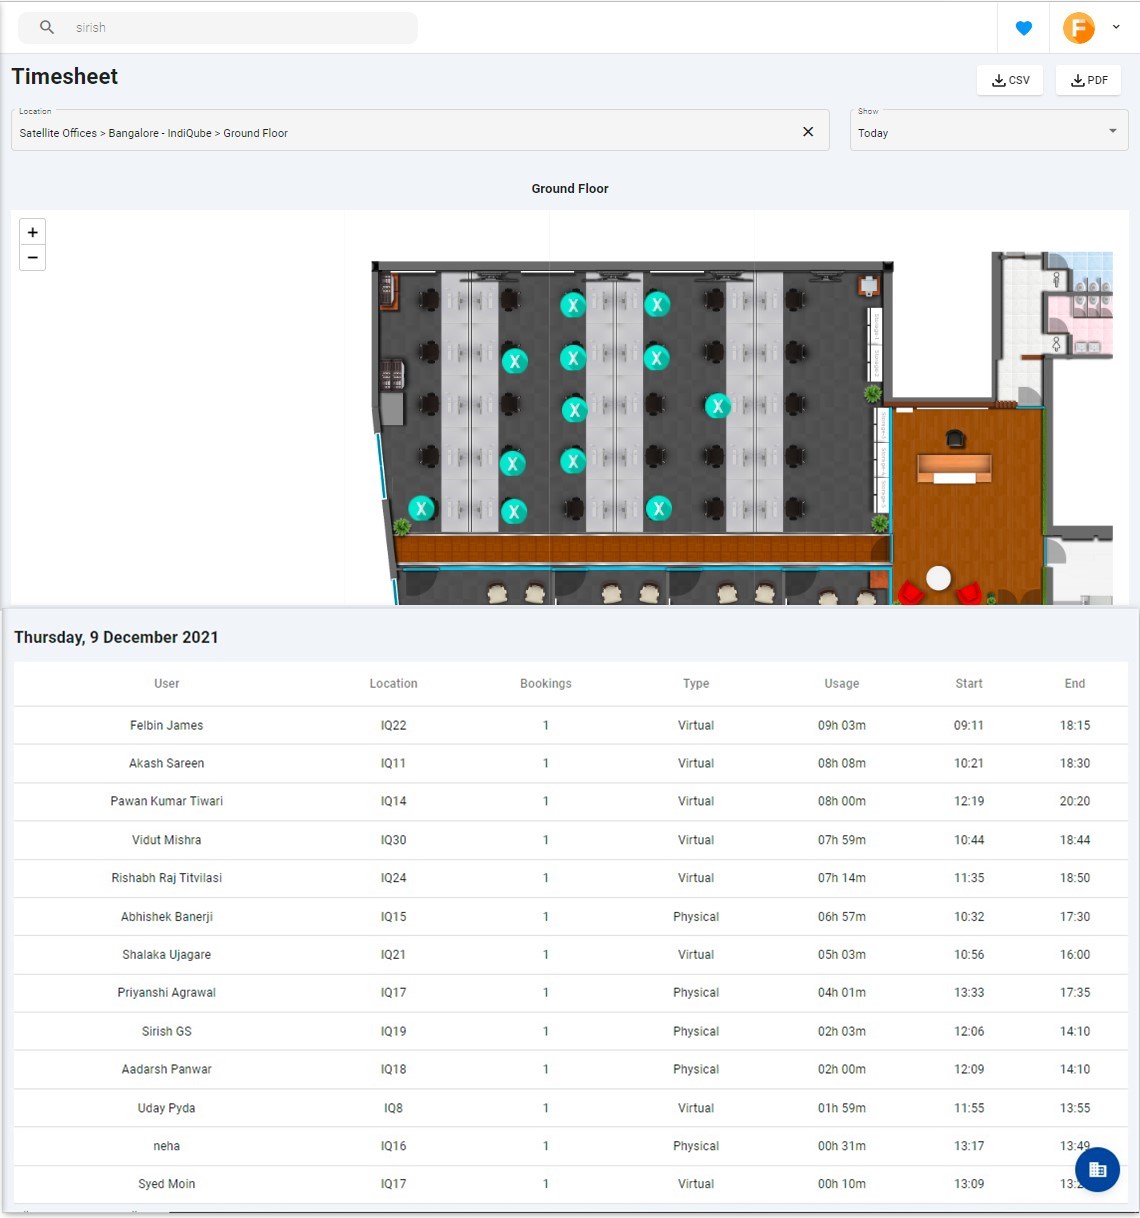
Time Sheet
- This page displays information on everyone (virtual and physical) that logs into a location at a specific time. It provides information about the user’s seating location, booking type, total usage, and start and end times.
To generate the timesheet Report
- Navigate to Analytics > Hot Desk > Time Sheet
- Select the location from the location drop-down menu. And select the report generation period
- When you select Custom Date Range, select a range of dates you want in the calendar.
- The summary report will be generated immediately.
- The generated report can be saved as a PDF by clicking on the PDF button.
- The generated report can be saved as a CSV format by clicking on the CSV button.
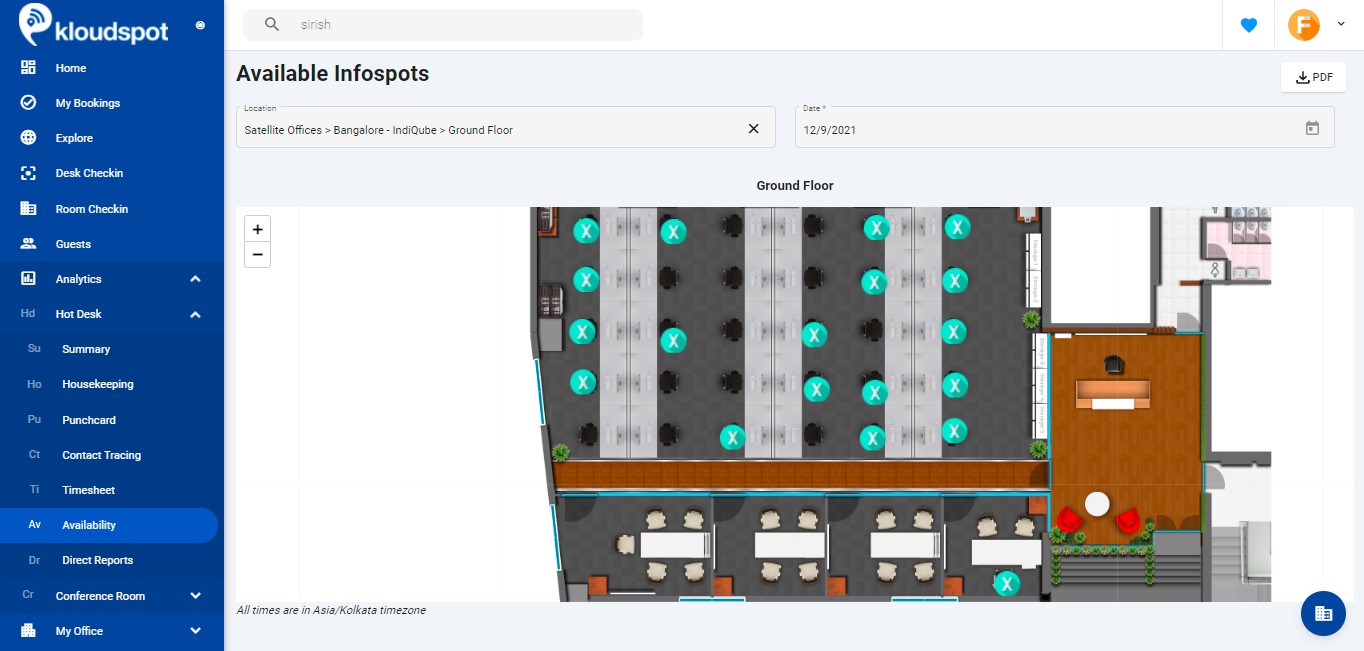
Availability
- This page displays the available infospots on the date selected.
- To do so, Navigate to Analytics > Hot Desk > Availability.
- Select the location from the location drop-down menu and select the Date.
- Available infospots are displayed. The available infospots are indicated by a blue circle with an x mark as shown in the figure.
- The generated report can be saved as a PDF by clicking on the PDF button.
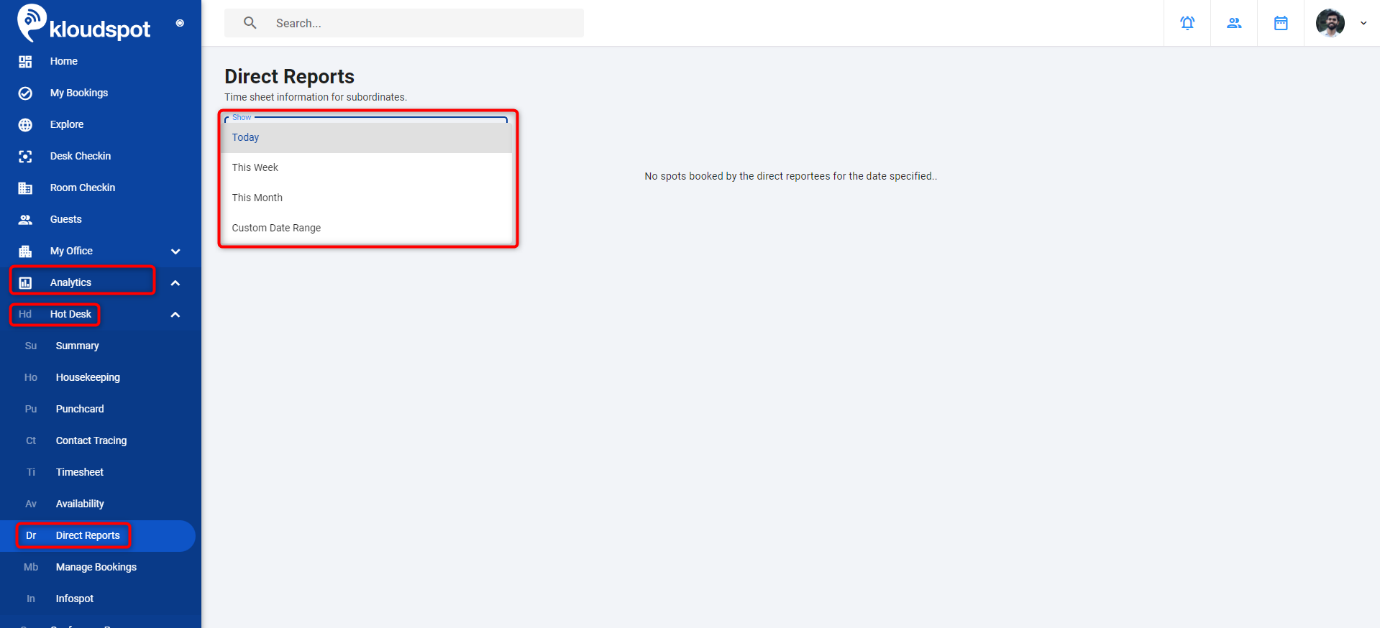
Direct Reports
- Direct report helps a manager to see the booking details of the users under them.
- To do so, navigate to Analytics > Hot Desk > Direct Reports.
- Then in the window that opens you will get the booking details of the users in your team.
- The time can be selected from the dropdown list here based on your needs.
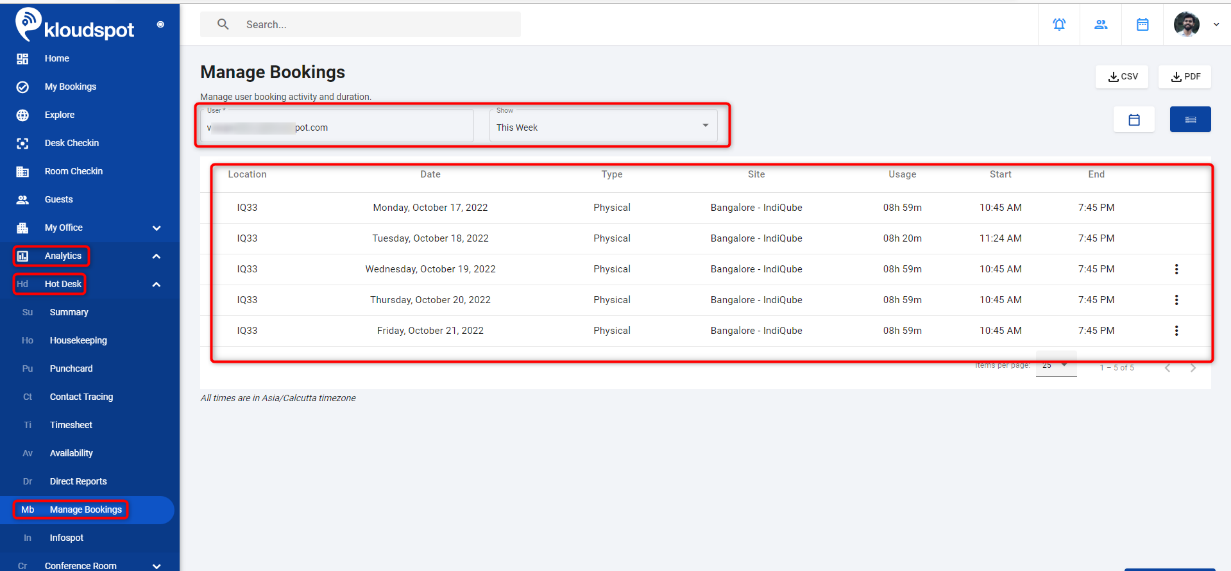
Manage Bookings
- It can be used to delete a user’s pending bookings.
- To do so, navigate to Analytics > Hot Desk > Manage Bookings.
- In the window that opens, search for the user’s name and select the time range.
- Then the bookings for the selected period will be opened.
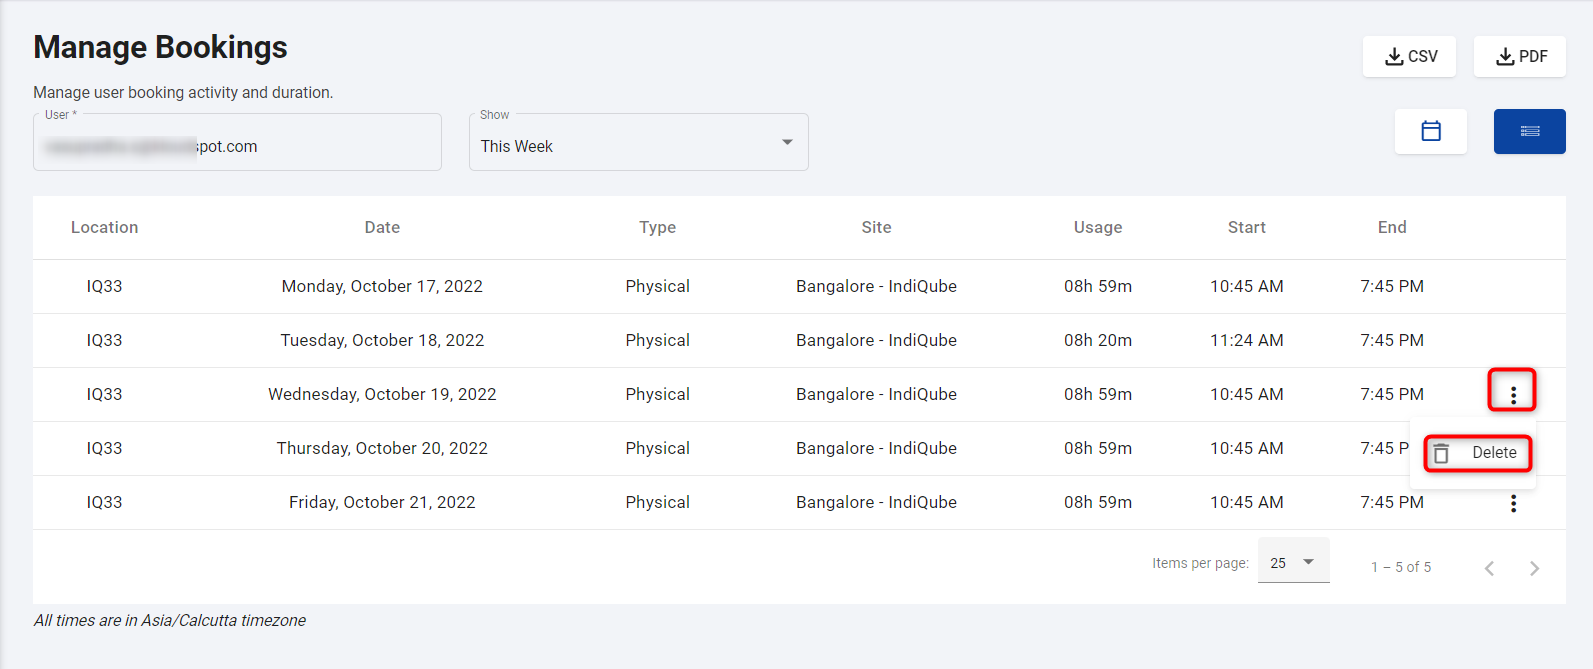
- If you want to delete any existing booking, click Delete from the menu button.
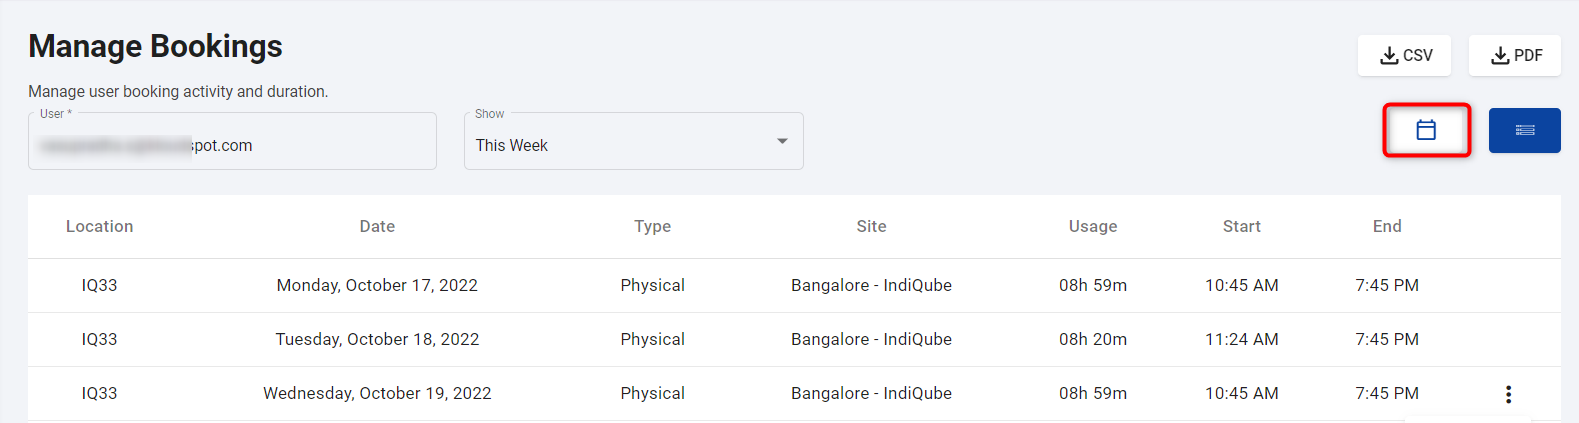
-
Click the Calendar button to change list view to calendar view.
-
The generated report can be saved as a PDF by clicking on the PDF button.
-
The generated report can be saved as a CSV by clicking on the CSV button.
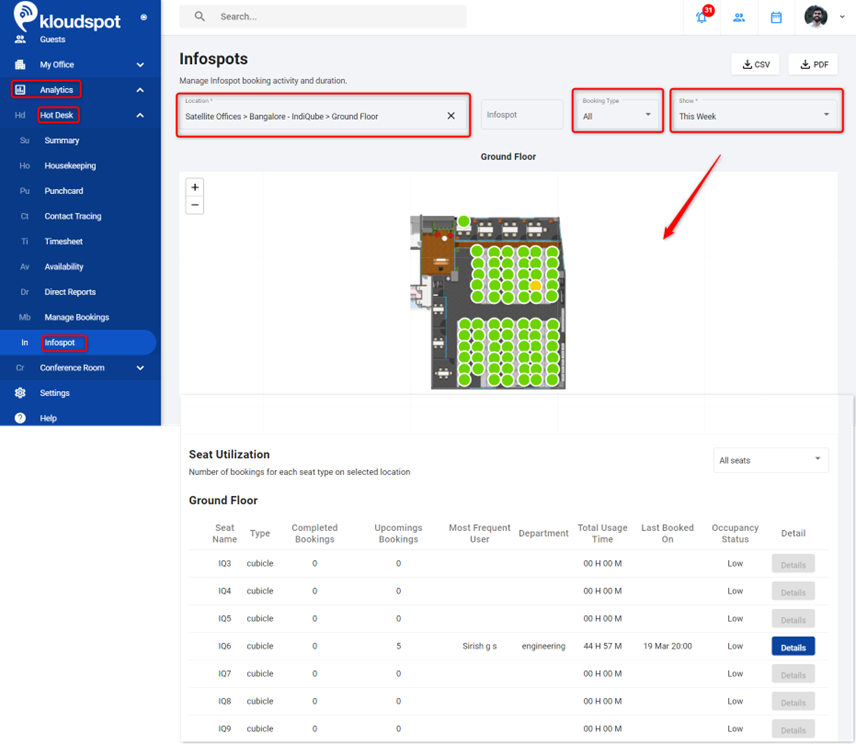
Infospot
- Use the Infospot option to get information about all the Infospots in your office.
- You can use this to view the booking history of a specific infospot and to delete upcoming bookings in an infospot.
- To do so, navigate to Analytics > Hot Desk > Infospot.
- Select the location and booking type from the dropdown list.
- Then select the period to display the list. Information about infospots will appear immediately.
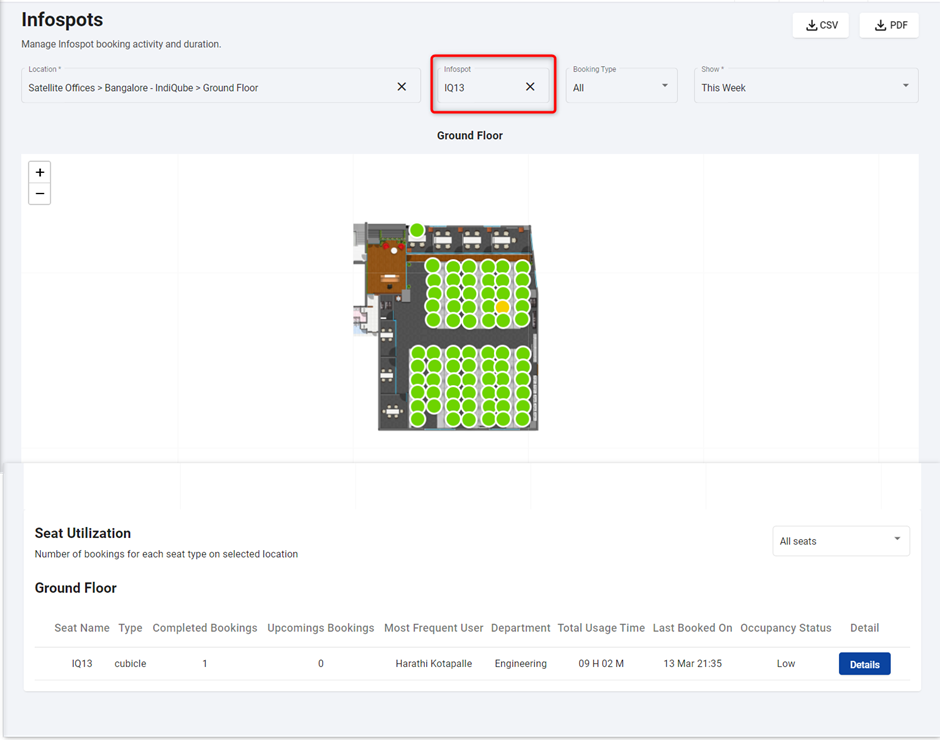
-
If you want to know information about a particular infospot, you can enter infospot’s name in the infospot column. You will receive the booking details made in that infospot during the selected period immediately.
-
The generated report can be saved as a PDF by clicking on the PDF button.
-
The generated report can be saved as a CSV by clicking on the CSV button.
-
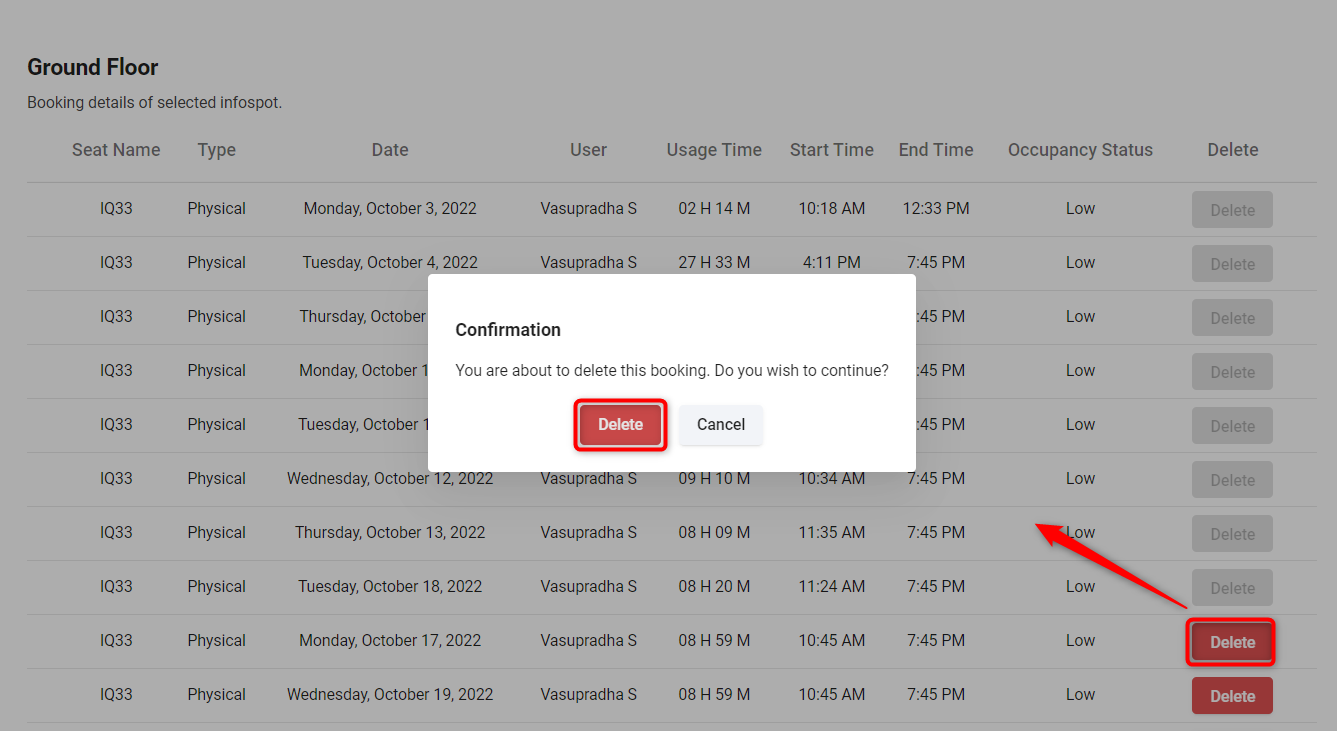
Click on the Details button to get date-wise information.
- If you want to delete any existing booking, click the Delete button and confirm it.
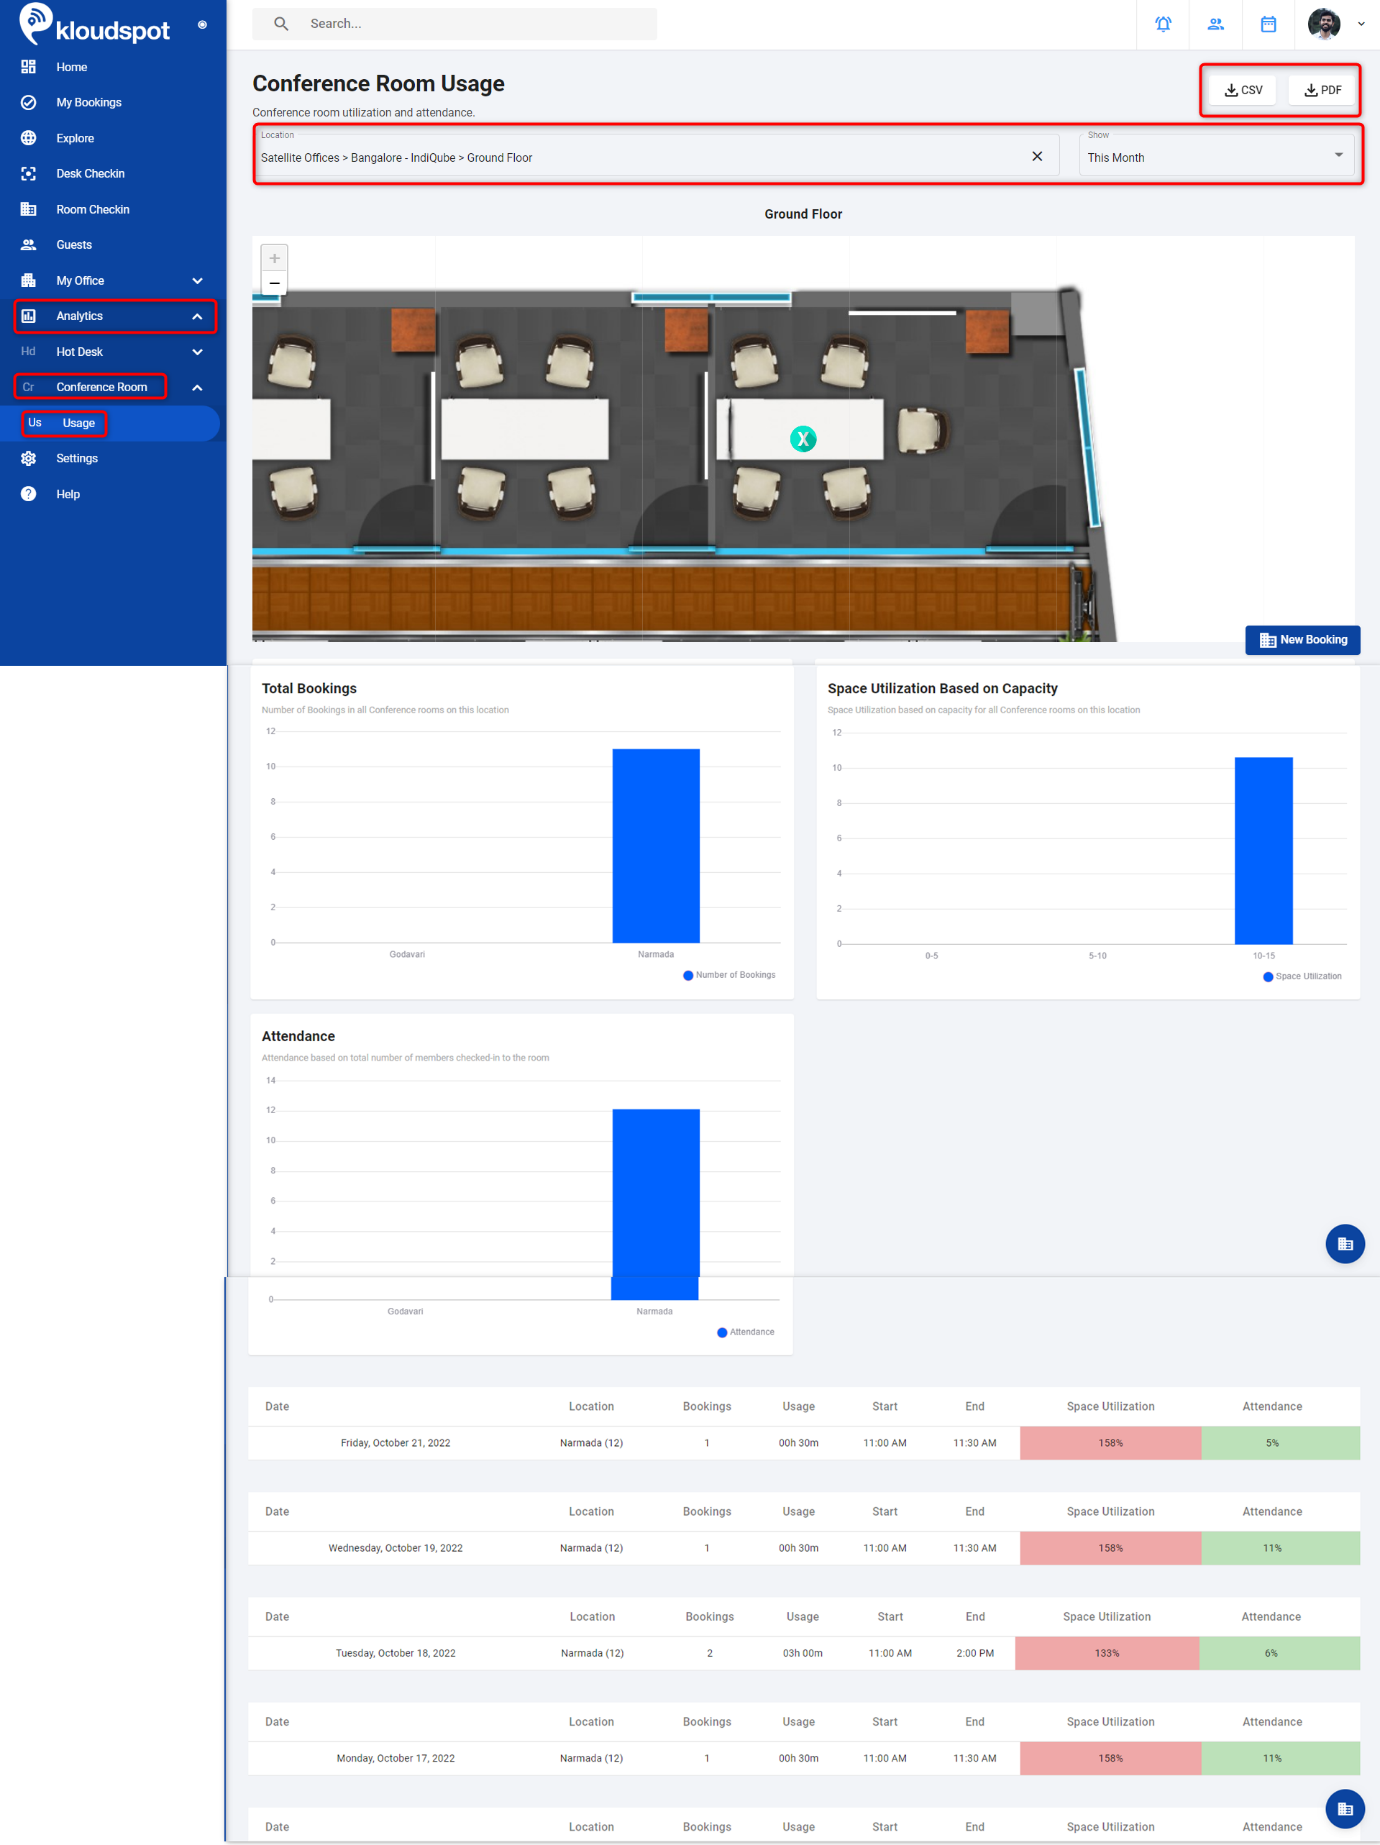
Conference Room
- It helps to get reports related to the conference room. The conference room menu contains the following option.
Usage
- It provides information related to the usage of the conference room.
- It can be used to find out how many times a conference room has been used, how much space has been used, how many people have attended, and so on.
To generate a Usage report
- Navigate to Analytics > Conference room > Usage.
- Select the location from the location drop-down menu and Select the report generation period.
- When you select Custom Date Range, select a range of dates you want in the calendar.
- The usage report will be generated immediately.
- The generated report can be saved as a PDF by clicking on the PDF button.
- The generated report can be saved as a CSV file by clicking on the CSV button.