Controller Health and Monitoring
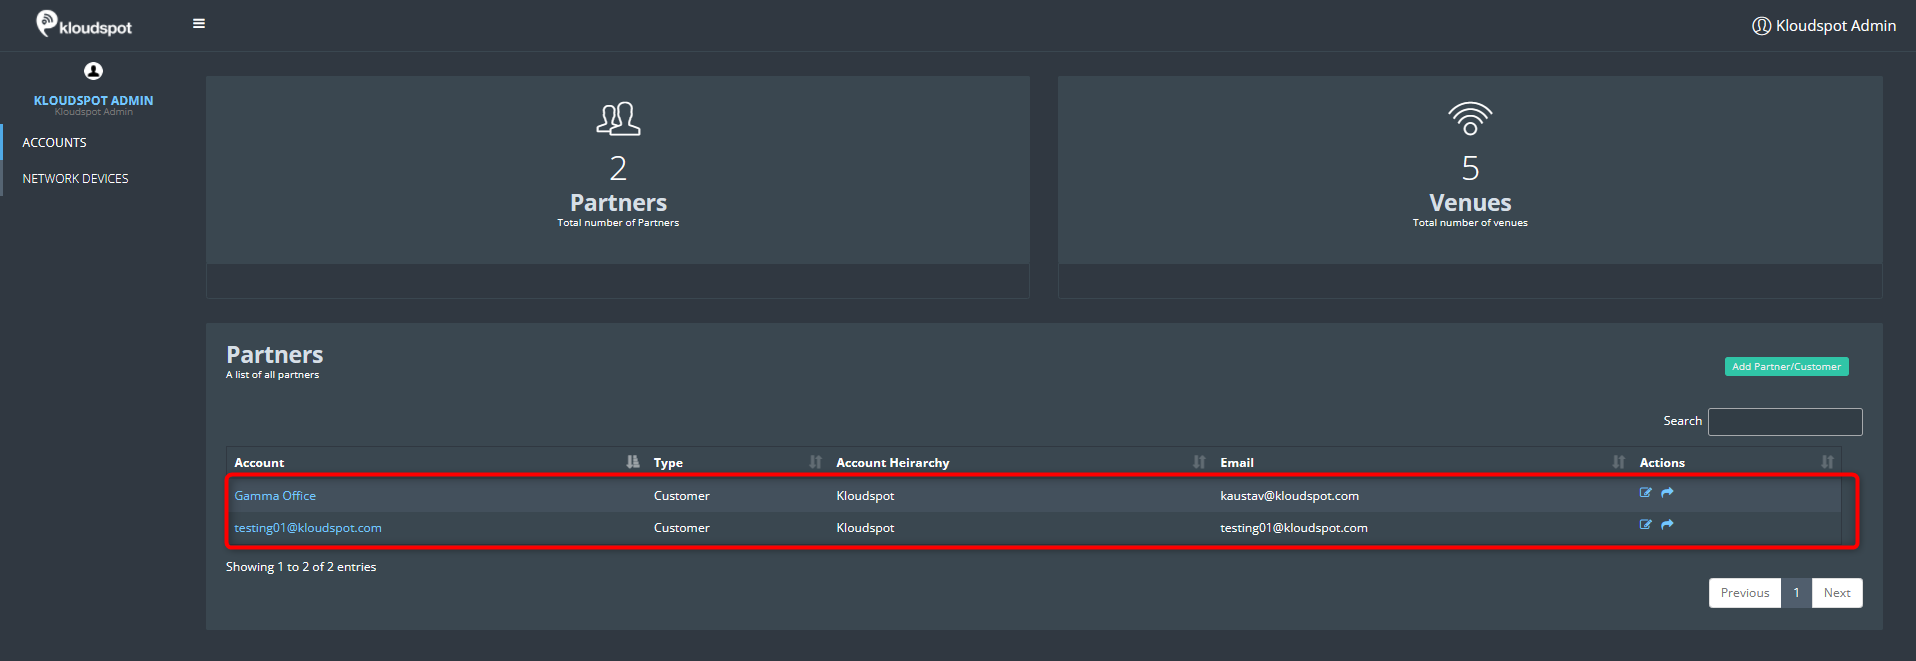
1. From the home page, select the partner’s name you want to check the controller’s health.
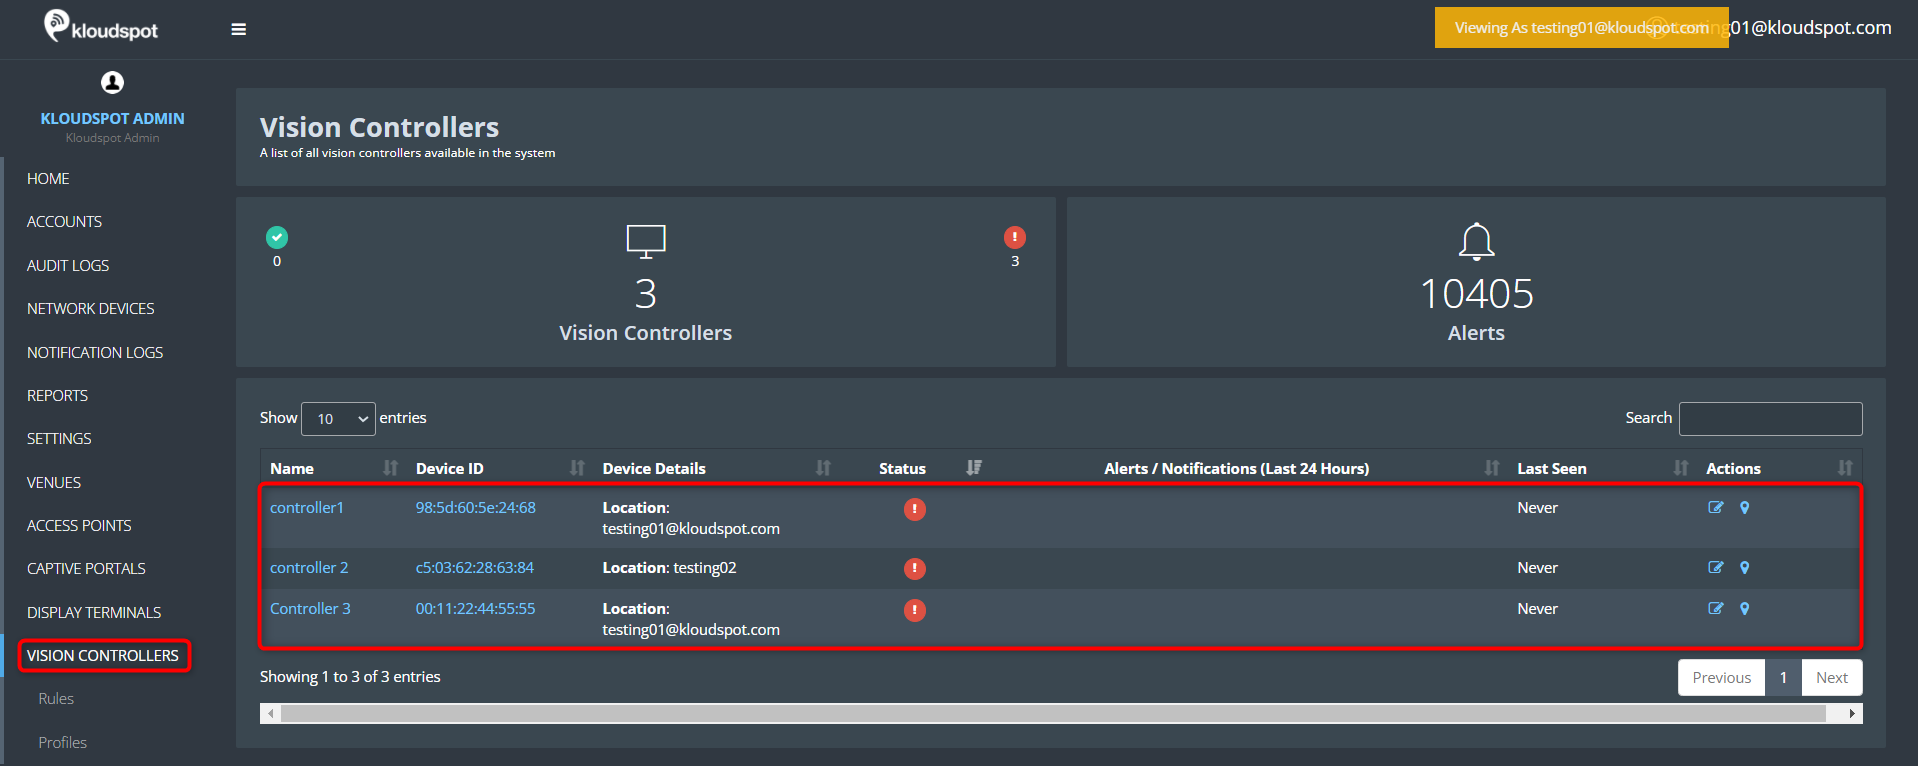
2. In the window that opens, click on Vision controllers from the menu bar.
3. In the Controller list that opens, select the controller you want to check the health.
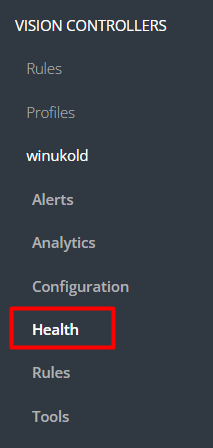
4. In the menu bar that opens, click on the Health option.
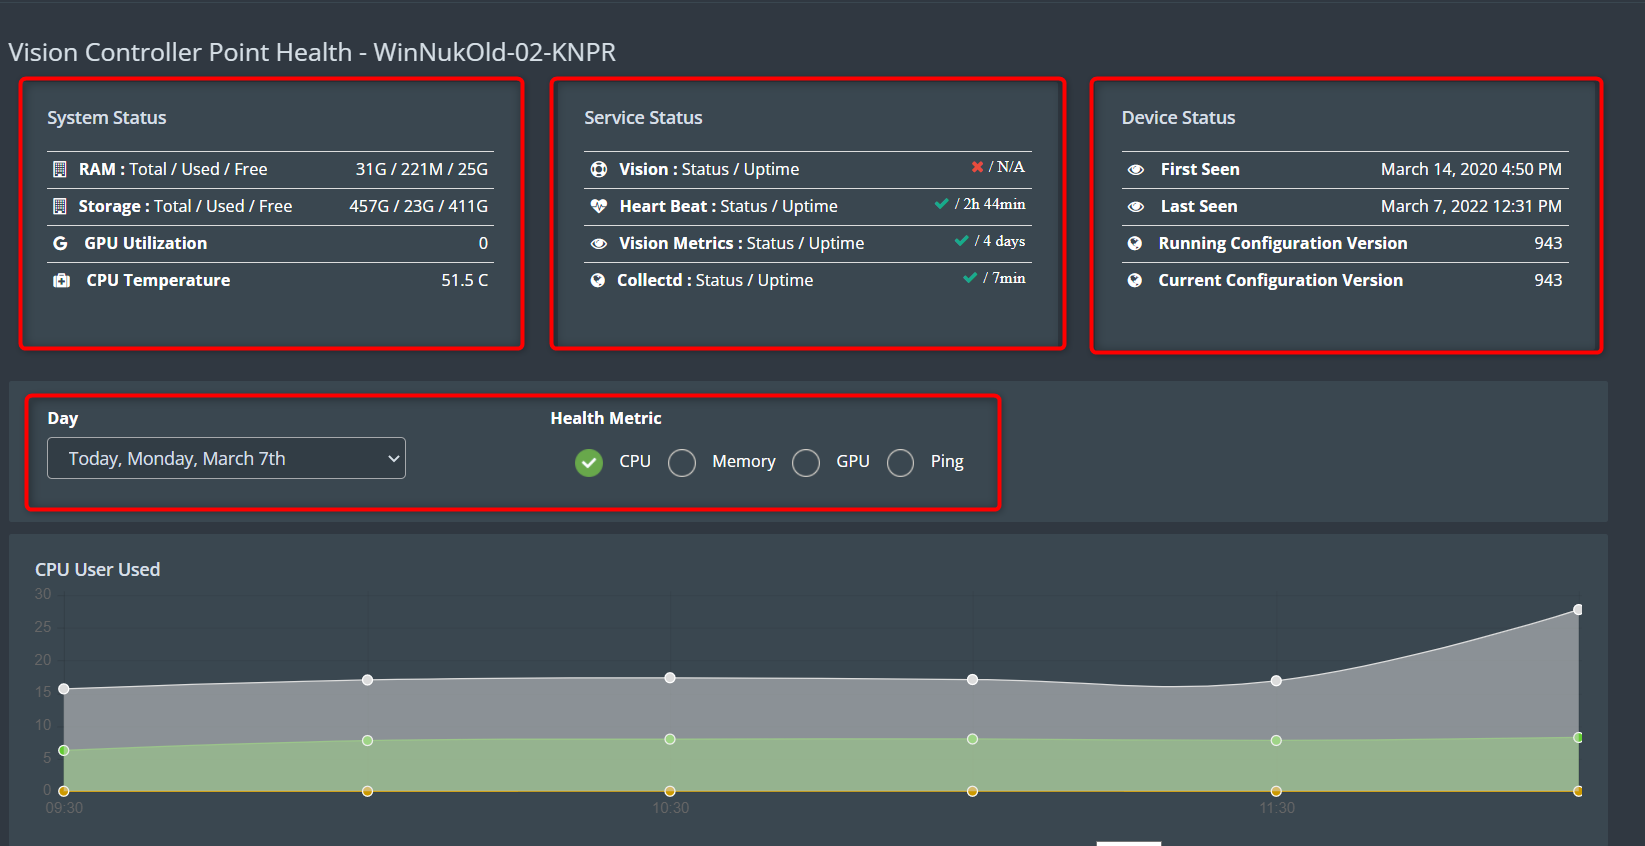
5. A window containing information related to the controller’s health will open. The window contains the following information.
- System Status
- Service Status
- Device Status
- Health metrics
6. System Status contains.
- RAM status: Provides information on RAM usage.
- Storage status: Provides information on storage and its usage.
- GPU Utilization: Provides information on GPU.
- CPU temperature: Helps to know the CPU temperature.
7. Device Status contains.
- First seen: This displays the date that the controller was added for the first time.
- Last seen: This displays the date that the controller was detected for the last time.
- Running Configuration Version: Displays the configuration version that is currently in use.
- Current Configuration Version: Displays the most recent configuration version that is currently available.
8. Health metrics.
- Get the last 7 days’ information on CPU, memory, GPU and Ping
To get health metrics
- Select the day from the dropdown menu.
- Select the metrics you want to check