NMS User Guide
This is a step-by-step procedure for configuring a Gateway device to the
Kloudspot Management portal, the NMS.
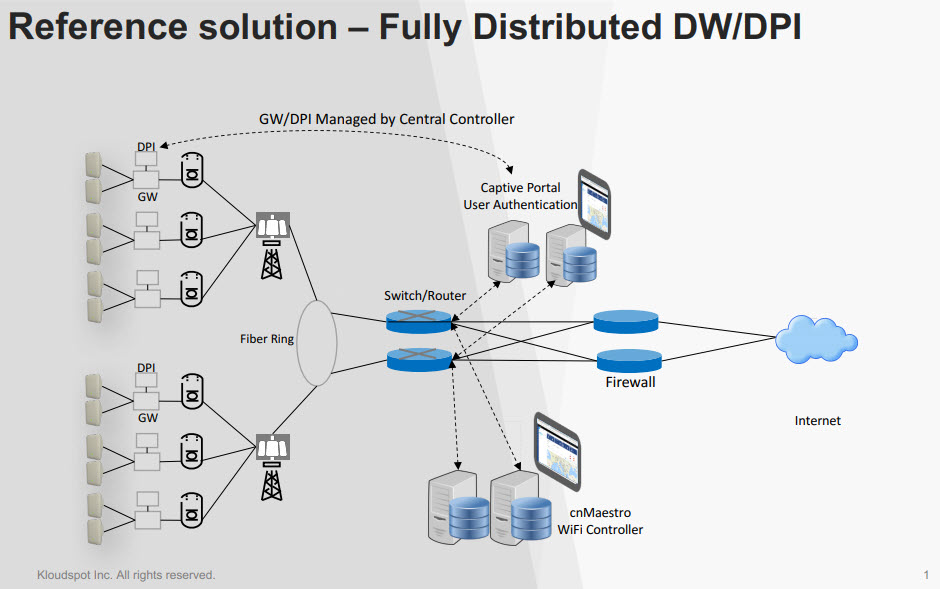
The Kloudspot Management portal enables comprehensive solution for services to
meet smart business demands. It manages network profile, device services,
real-time device information and captive portal analytics.
Login
Login with the User credentials (i.e., Username and Password) to the page that
appears on entering the URL into the web browser provided by Kloudspot.
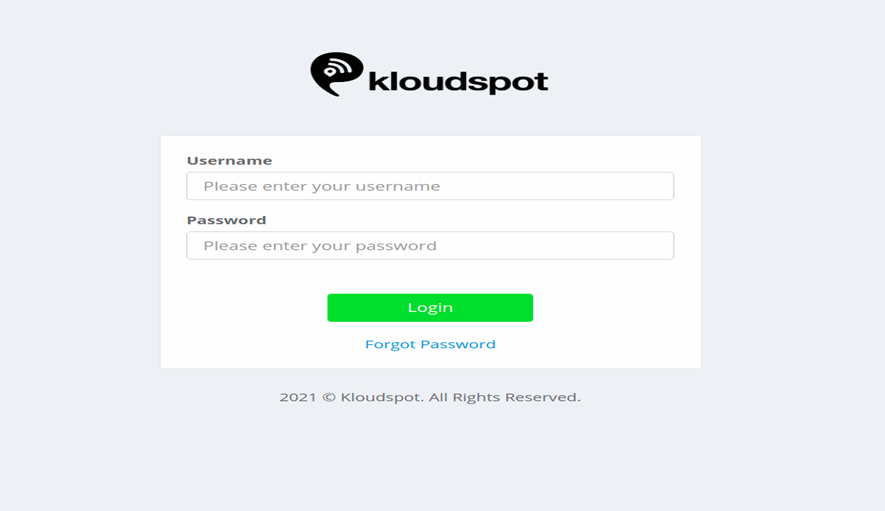
Figure 1- NMS Login Page
Default Home Page
After logging in, you will be welcomed by the Kloudspot Management homepage
that comprises of information as below. The Partner dashboard with dashlets
has the following main areas: Location and Network devices summary, Connected
Clients devices information and Assets Display table.
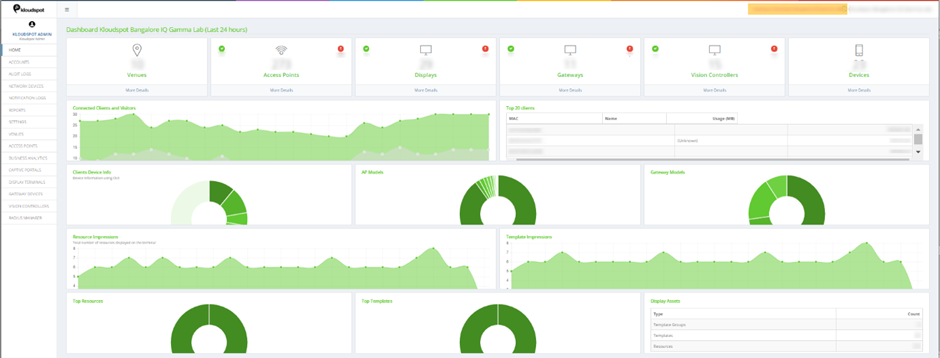 Figure 2-NMS Homepage
- Venues : Provides the number of venues for that location. Clicking More Details takes you to the Venue window.
- Access points : Provides the number of network devices discovered on your network that shows the total number of running and offline. Hover over the cursor to () or () icon to display status information about the devices.
- Clicking More Details takes you to the Access Points window.
- Similarly, click the Displays , the Gateways , the Vision Controllers , and the Devices to view the respective window.
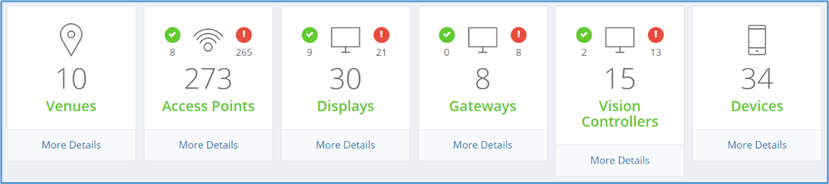 Figure 3-Viewing the devices & venues in the dashboard.
- Connected Clients and Visitors: Provides the Line graph that shows information about Connected Clients, Guest, and Probing. Hover your cursor over the graph to display the client’s score for that time range.
- Top 20 clients: Provides a list of client name, mac address with data usage.
- Clients Device info : Provides a chart that shows device information using an organizationally unique identifier (OUI). Hover your cursor over a chart to display the client’s score.
- AP Models: Provides a chart that shows Access points models. Hover your cursor over a chart to display the APs score.
- Gateway Models: A chart that shows Gateway models. Hover your cursor over a chart to display the Gateways score.
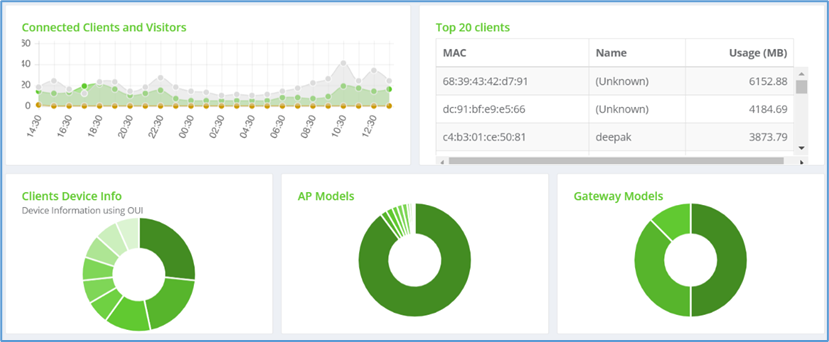 Figure 4-Connected client devices shown in Graph & Chart view
- Resource Impressions : Shows the total number of resources displayed on the terminal. Hover your cursor over the graph to display the resource score for that time range.
- Template Impressions : Provides the total number of template impressions that are displayed on the terminal. Hover your cursor over the graph to display the template score for that time range.
- Top Resources: Provides a chart that shows maximum usage resources. Hover your cursor over a chart to display the score of maximum usage of resources.
- Top Templates: Provides a chart that shows maximum usage of templates. Hover your cursor over a chart to display the score of maximum usage of templates.
- Display Assets: Provides the list of template groups, templates, and resources.
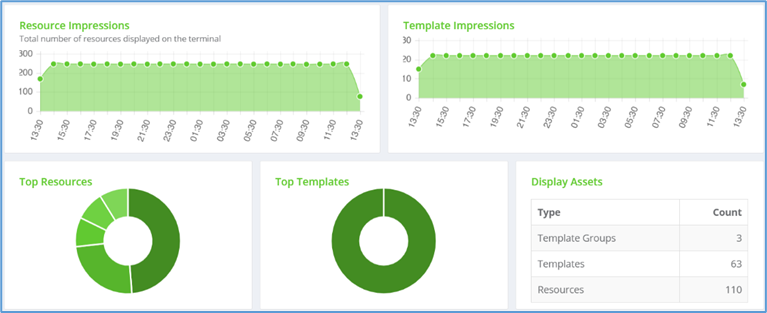 Figure 5-View Assets display in charts and graph.
Adding a Gateway Device
This section walks you through steps to add a Network Device to the Kloudspot
management portal, in this case it is a Gateway.
Steps
- Click on the Network Devices from the left-hand side menu that appears on the home page.
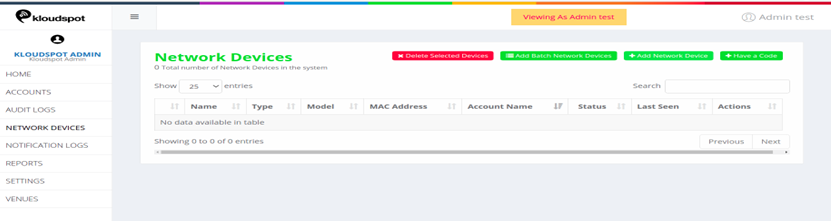 Figure 6-network device homepage
-
Click on the + Add Network Device tab to add a gateway device. The
following window appears as show below.
-
Click on the Device type tab and select Gateway from the drop-down
menu as shown in below.
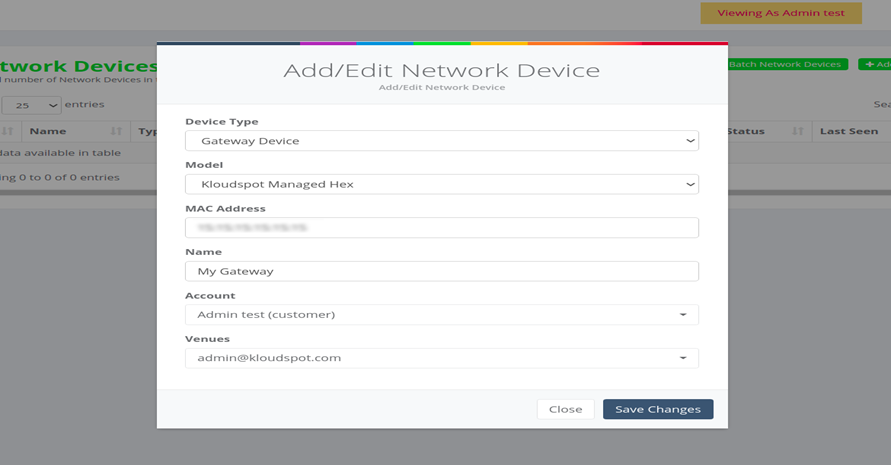 Figure 7-Add a network device
Fig 7: Add network device window for Device type.
-
Next Click on the Model tab and select the Model type for the gateway
specified by Kloudspot as per partners’ requirement.
-
Click on the MAC Address tab and enter MAC Address for the respective
Gateway that needs to be configured. The MAC address is available at the back
of the device itself.
-
Enter the desired name for the Gateway device in Name tab.
-
The Account tab already has the Account name of the Partner/Customer.
-
Click on Venues to add venue for the Gateway device which is
configured on the Device already.
-
Click on Save Changes to save the latest information to add a new
network device.
Network Configurations
Once the gateway device is added to the Network Management system, we need to
configure the device to perform desired operations.
Following are the procedural steps to configure a Gateway device.
Steps
- Click on the ‘Gateway Devices’ tap on the left-hand side of the homepage.
- The Gateway device recently added will appear on the list as shown in the figure below. The ‘last seen’ information for the device will be ‘Never’ as this is a newly added device.
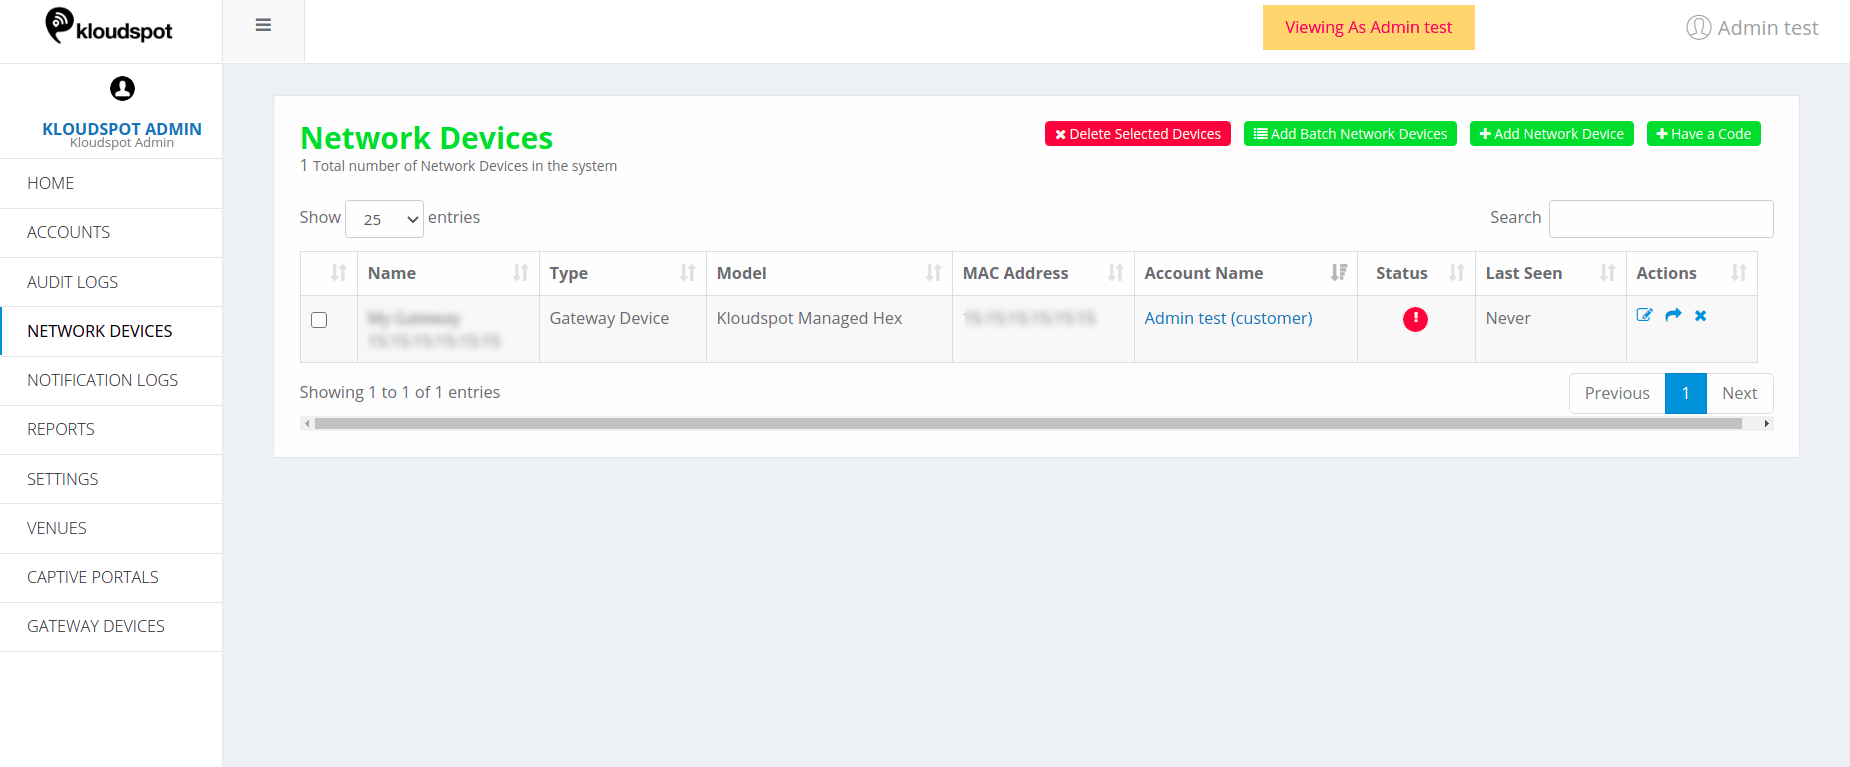 Figure 8-list of added network devices
- On the left-hand panel under the ‘Gateway Devices’ you will find the
‘Configurations’ option. Click on ‘Configurations’ and you will get a page as
shown in figure below.
Create New Configuration
- On the  GATEWAY DEVICES > CONFIGURATIONS. The Gateway Configuration
window appears as shown in figure below.
GATEWAY DEVICES > CONFIGURATIONS. The Gateway Configuration
window appears as shown in figure below.
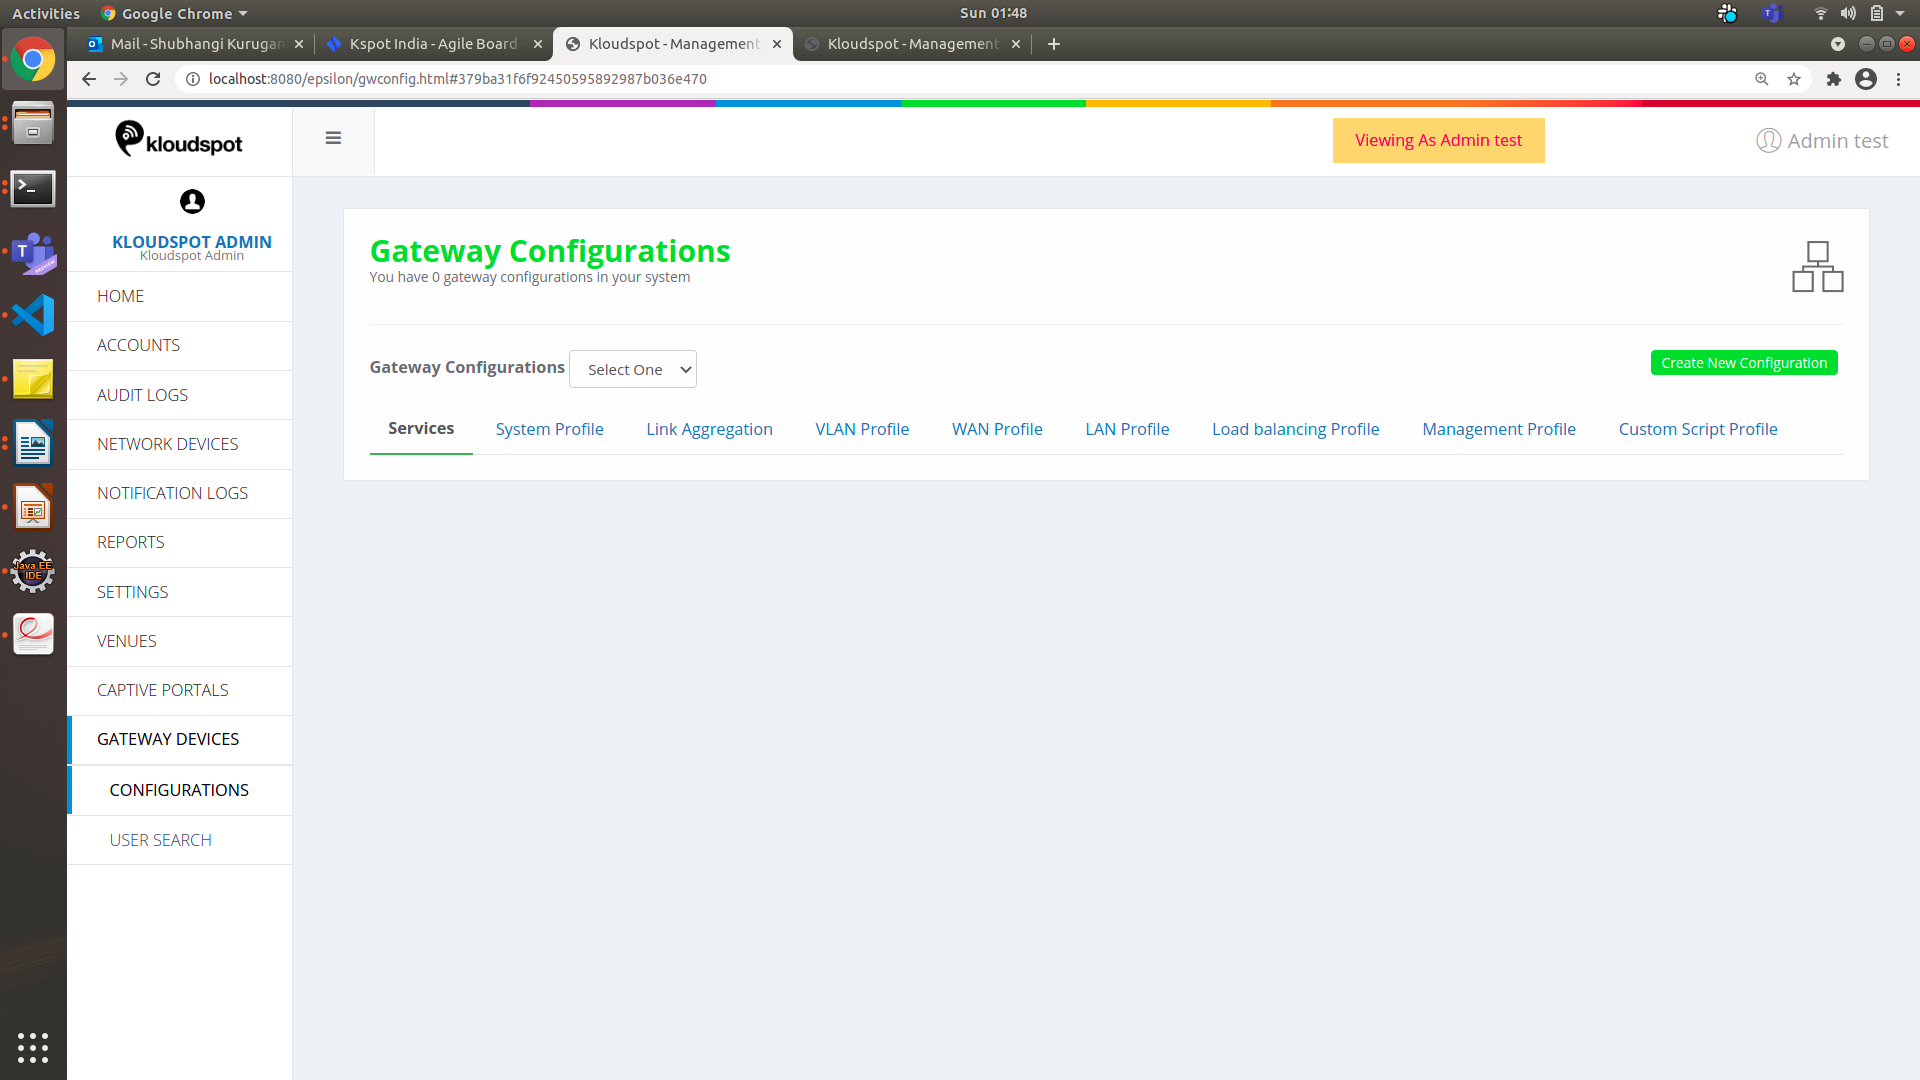 Figure 9-Configuration page
- Click on ‘Create new Configuration’ and fill in the following information.
- ‘ Name ’ will the name you want to give to the configuration.
- ‘Gateway Model’ will be the model of the device that you have just added. This can be found in the ‘ Network Devices ’ list with the Gateway device information as shown in figure 3.
- Select the country where the system is been deployed.
- ‘ Operating Mode ’ has two types Standalone and High Availability.
- Standalone: This configuration has a Single device
- High Availability: This Configuration has two devices i.e., Active and Passive. So, when Primary (Active) device goes down, all the network traffic is diverted to the Secondary (Passive) device. In this case we just select the ‘Standalone’ operating mode.
- Click on ‘ Save ’ to save the configuration.
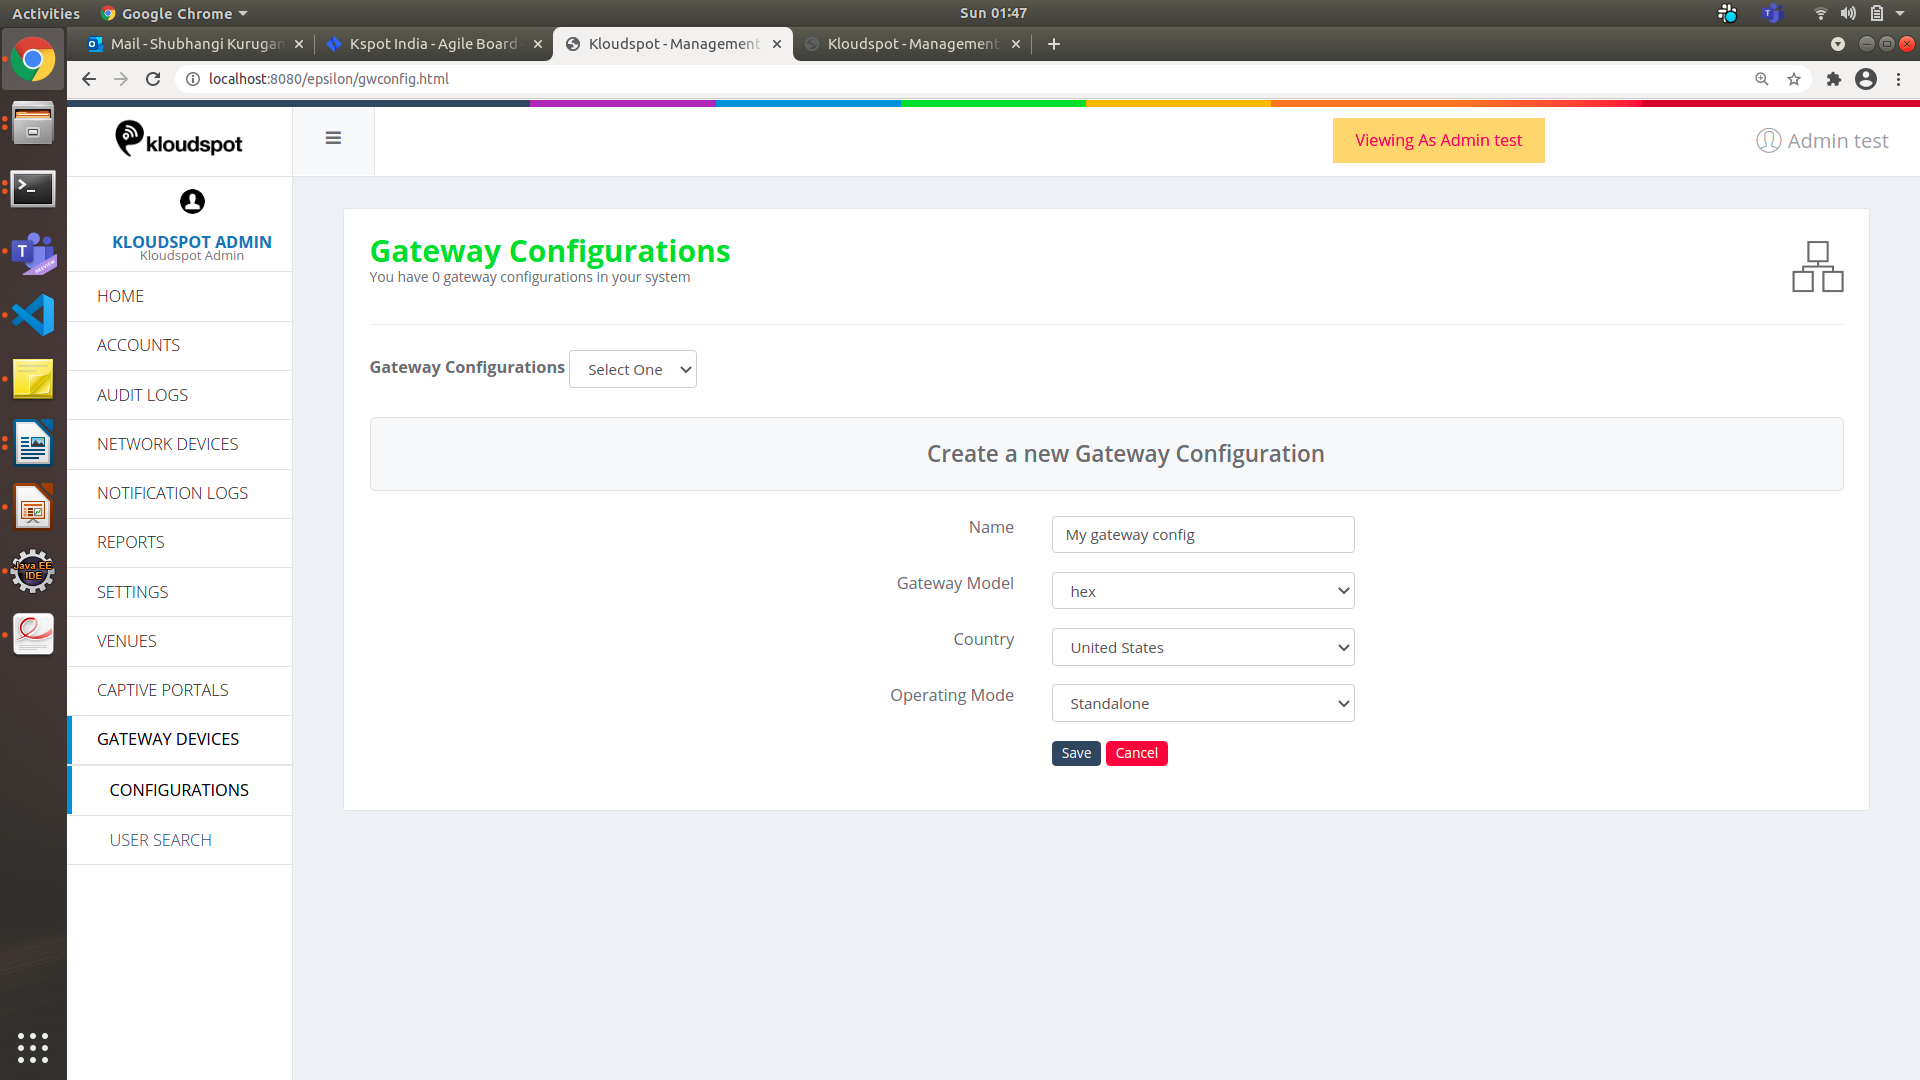 Figure 10-Add new Gateway Configuration Page
Gateway Configuration
The Gateway Configuration page is a multi-tab page with the following options:
- Services Tab
- System Profile Tab
- Link Aggregation Tab
- VLAN Profile Tab
- WAN Profile Tab
- LAN Profile Tab
- Load balancing Profile Tab
- Management Profile Tab
- Assigned Gateways(0) Tab
Gateway configuration for standalone operating mode
Services Tab
- Click on this pencil icon to change/edit the features as required.
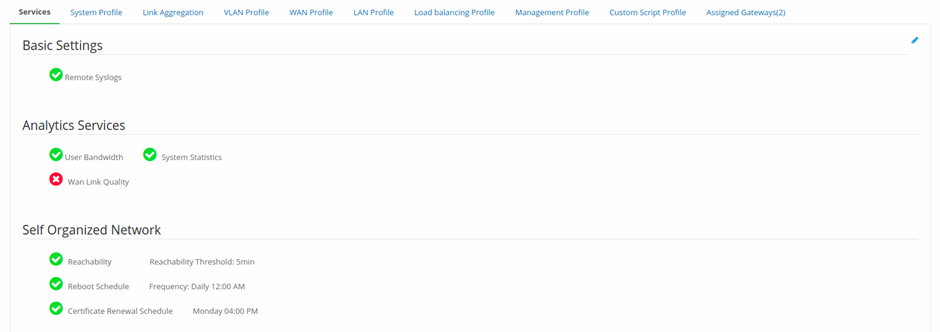
Figure 11-Gateway Configurations page
2. Remote Syslogs Support: Allows to save logs in remote system.
3. User Bandwidth: To see the bandwidth usage per user/per connection.
4. System Statistics: If checked, the system performance can be seen.
5. Wan Link Quality: If checked, the link quality and the statistics of
jitter, packet loss & latency can be seen for WAN profiles.
6. Reachability: If checked and if the device is not active for certain
amount of time, an alert will be generated.
7. Reachability Threshold: Choose the time. An alert will be sent when
the device is not active for this much time (default is 10 min).
8. Reboot Schedule: User can schedule a device reboot, daily or weekly.
9. Frequency: Choose the day and time when the device reboot is
required.
10. Certificate Renewal Schedule: Check this to renew the ssl
certificate for hotspot on the day and time provided in the fields next to it.
System Profile
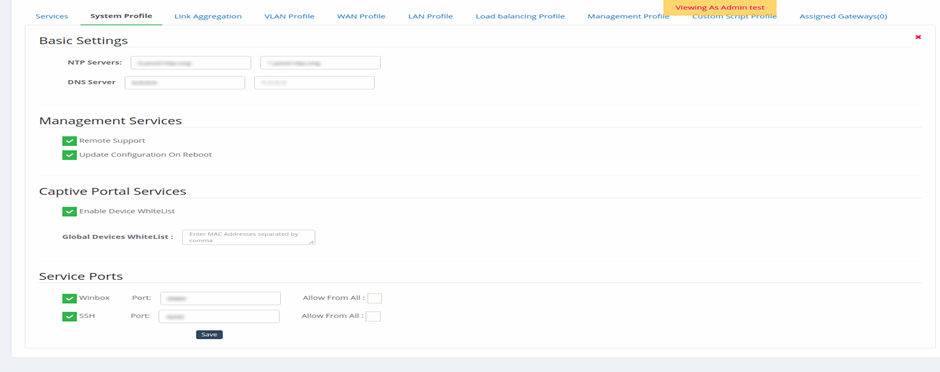 Figure 12-systems profile page
The configuration system profile tab contains settings for the NTP servers and
the DNS server and checkboxes of Management services, Captive portal services,
and activate service ports for troubleshooting.
- To edit the system profile tab, click the Edit () icon on the right side of the Basic Settings pane.
- In the Basic settings section, enter the IP address:
- An IP address of the NTP server to enter in the NTP Servers textbox. This helps the device synchronizing accurate time with the NTP servers.
- In the DNS server text box, enter the IP address of the DNS server for resolving hostnames.
- In the Management section, enable the following checkboxes:
- Check the Remote Support option that allows users to remotely access and troubleshoot the device.
- Check the Update Configuration On Reboot option to upgrade the software image automatically and reboot the device.
- In the Captive Portal Services section, do the following:
- Enable Device WhiteList: Check this if any whitelisting of devices is required when connected from the captive portal.
- Global Devices Whitelist: Provide the MAC address of those devices as a comma separated values.
- In the Service Ports section, do the following:
- Check the Winbox option and the corresponding Allow From All check box that allows you to remotely access and to troubleshoot the device. Mention the port on which the GUI can have access.
- Check the SSH option and the corresponding Allow From All check box that allows you to remotely connect SSH on WAN and to troubleshoot the device. Mention the port on which the SSH can run.
- Click Save.
Link Aggregation
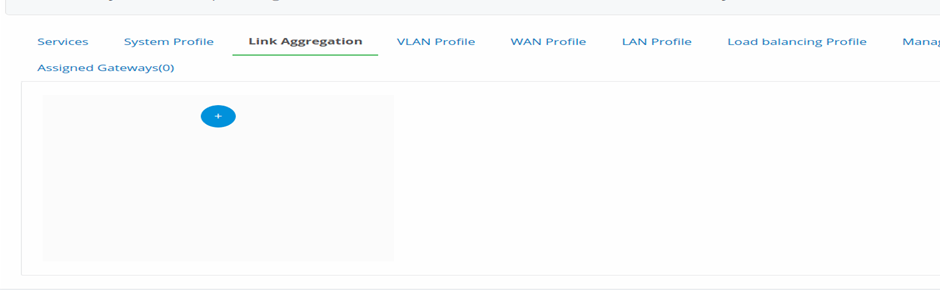 Figure 13-Link Aggregation page
- Click on to create a new profile.
- A New default profile is created. Hover on to the new profile, click on pencil icon to edit the profile. Click on to add a new profile.
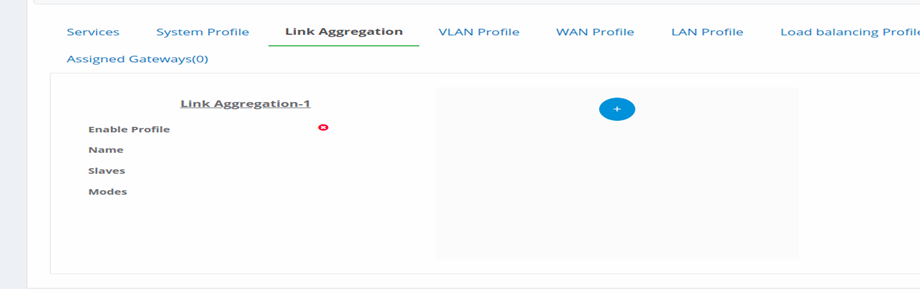 Figure 14-Add link aggregation profile
- Enable Profile: Click on this to enable the profile.
- Name: Give a name to the profile.
- Slaves: Select two or more interfaces that needs to be combined.
- Mode: Choose the mode from the available list of modes.
- For balance-alb, balance-tlb, active-backup Mode , user can choose the primary interface from the list of selected interfaces.
- Click on Save.
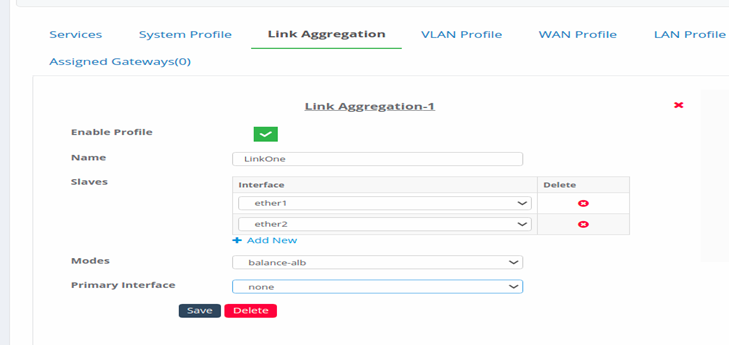 Figure 15-Configure Link Aggregation
VLAN Profile
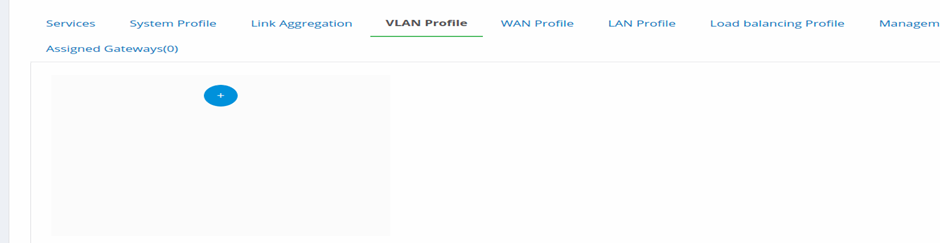 Figure 16-VLAN Profile page
- Click on to create a new VLAN profile.
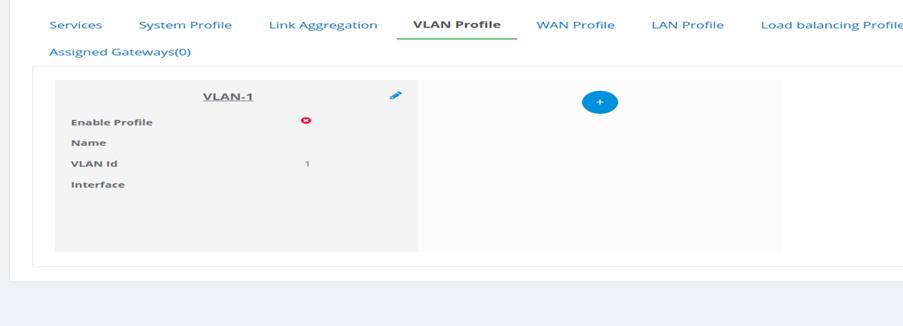 Figure 17-Add new VLAN Profile
- A New default profile is created. Hover on to the new profile, click on
pencil icon to edit the profile. Click on to add a new profile.
3. Enable Profile: Click on this to make the profile enable and available
to use.
-
Name: Give a name to the profile.
-
VLAN Id: Assign a name for the VLAN Id.
-
Interface: Select an Interface for the VLAN.
-
Click on Save to save the configuration.
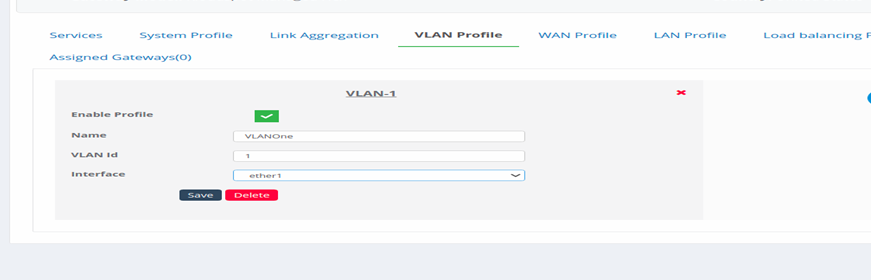 Figure 18-Configure VLAN Profile
WAN Profile
Adding a WAN Profile. Fill in the following information to add a WAN profile
on the network.
- To create WAN, click to add various WAN configurations. It’s shows a window named ‘WAN-1’
- Click Edit () icon to open the add details to the window.
- Select the Enable Profile check box to activate the WAN setup.
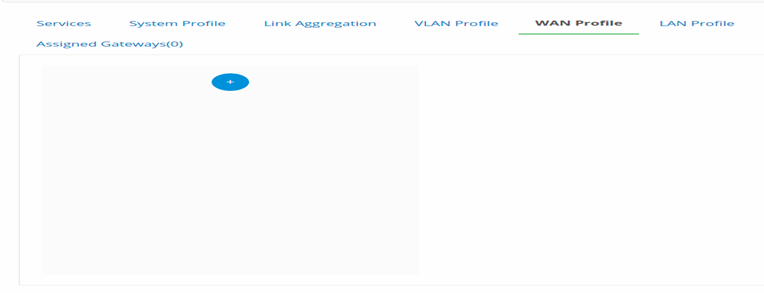 Figure 19-Add WAN Profile
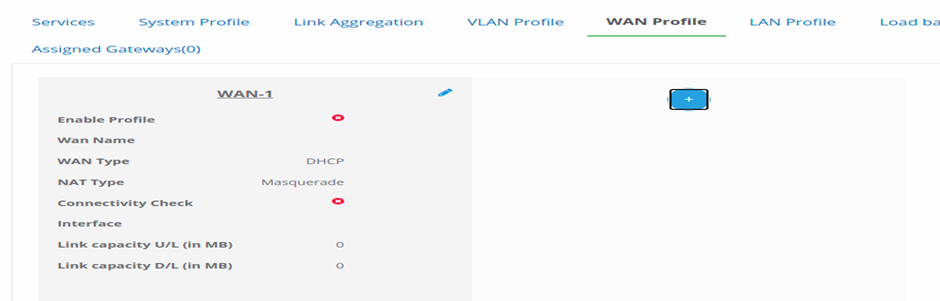 Figure 20-Configure WAN Profile
- From the WAN Type drop-down list, choose one of the following options
as per your requirements:
- DHCP: If you select this option, do the following:
- Click on the Connectivity Check check box to verify the WAN connection.
- Enter the IP address in the Monitor IP field.
- PPPoE: If you select this option, do the following:
- Fill in the information which ISP provided: Service Name, Account Name, Username, and Password.
- Static IP: If you select this option, do the following:
- If your WAN connection requires a static IP address, enter in the required fields: Static IP, Netmask, and Gateway.
- LTE: if you select this option, do the following:
- Enter the APN name in the APN field.
-
In the NAT Type drop-down list, select an option: NAT Enable or
Disable.
-
From the Interface drop-down list, choose an ethernet port. An
Interfaces range from 1 to 5.
-
Click Save.
-
To define more WAN profiles, repeat Steps 1 to Step 7.
LAN Profile
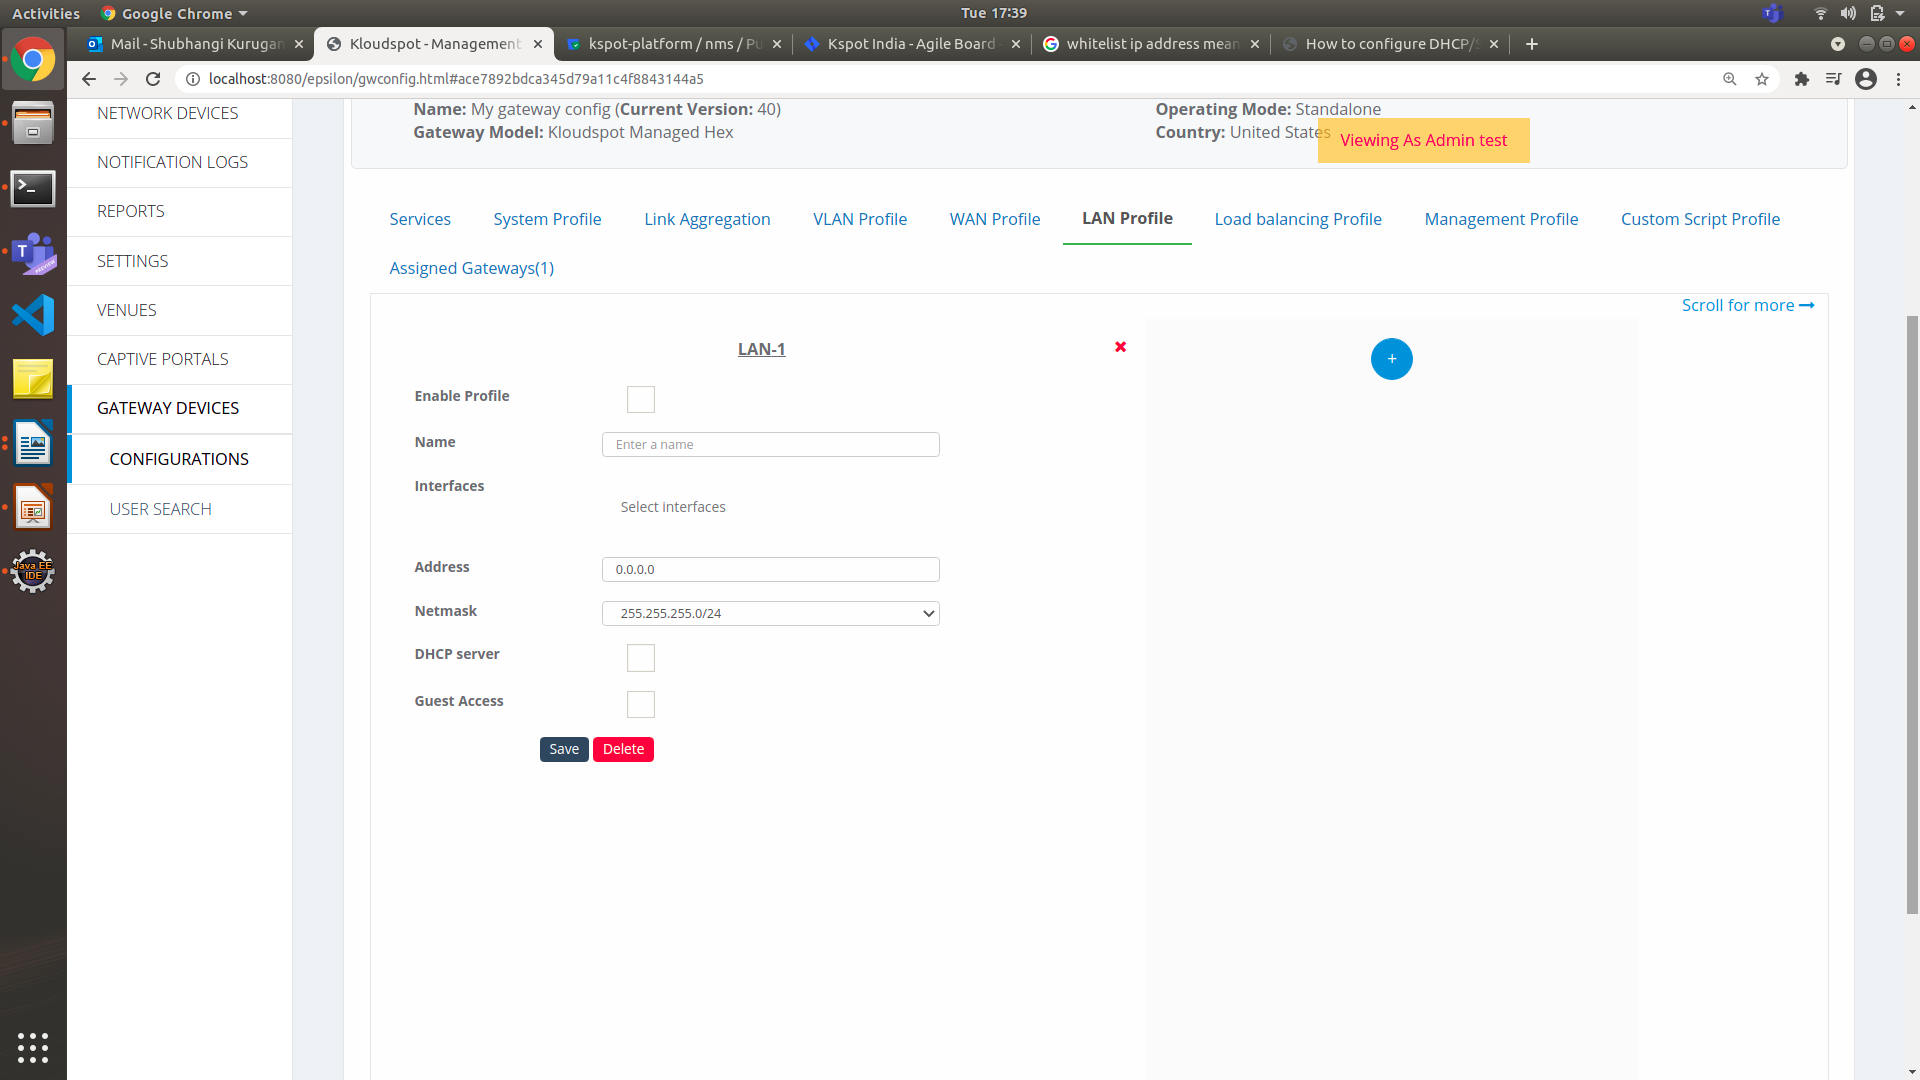 Figure 21-Add LAN Profile
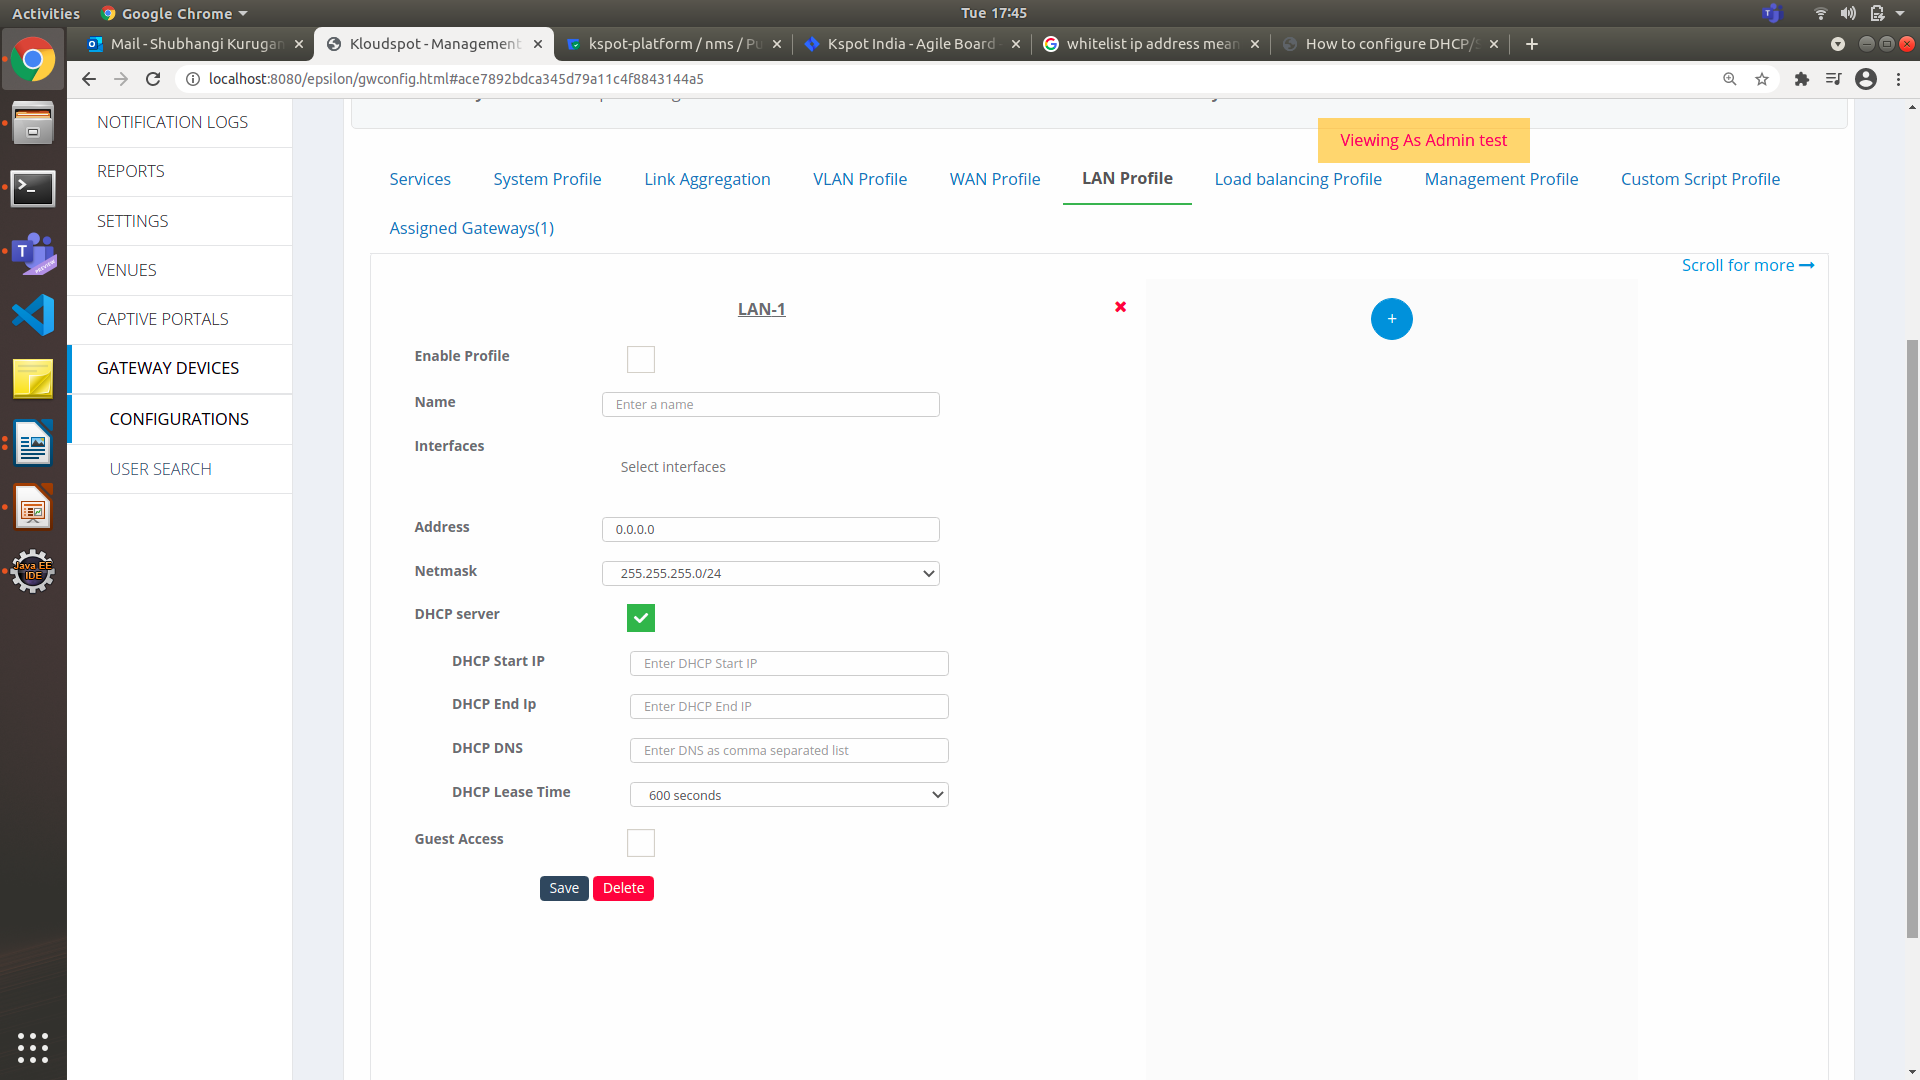 Figure 22-Configure LAN Profile


-
Select the Enable Profile check box to activate the LAN setup.
-
In the Name field, enter a unique name for the LAN network interface.
-
From the Interfaces drop-down list, choose the assigned interfaces (VLAN, Physical Interfaces, or Link Aggregation).
-
In the Address field, enter the gateway IP address.
-
From the Netmask drop-down list, choose a netmask depending on your IP pool.
-
Check the DHCP server check box to update the following options:
-
In the DHCP Start IP field, enter the start of the IP address range that the DHCP server will use.
-
In the DHCP End IP field, enter the end of the IP address range that the DHCP server will use.
-
In the DHCP DNS field, enter the DNS IP addresses. If multiple addresses, separate those addresses with comma.
-
In the DHCP Lease Time field, enter the valid time for which the DHCP server leases IP addresses to the devices.
- Guest Access: The Guest Access module configures the custom landing page URL for the Guest portals.
- To activate the external guest portal, check the Guest Access check
box as shown in the Fig. 13. It enables following options as shown in figure
below.
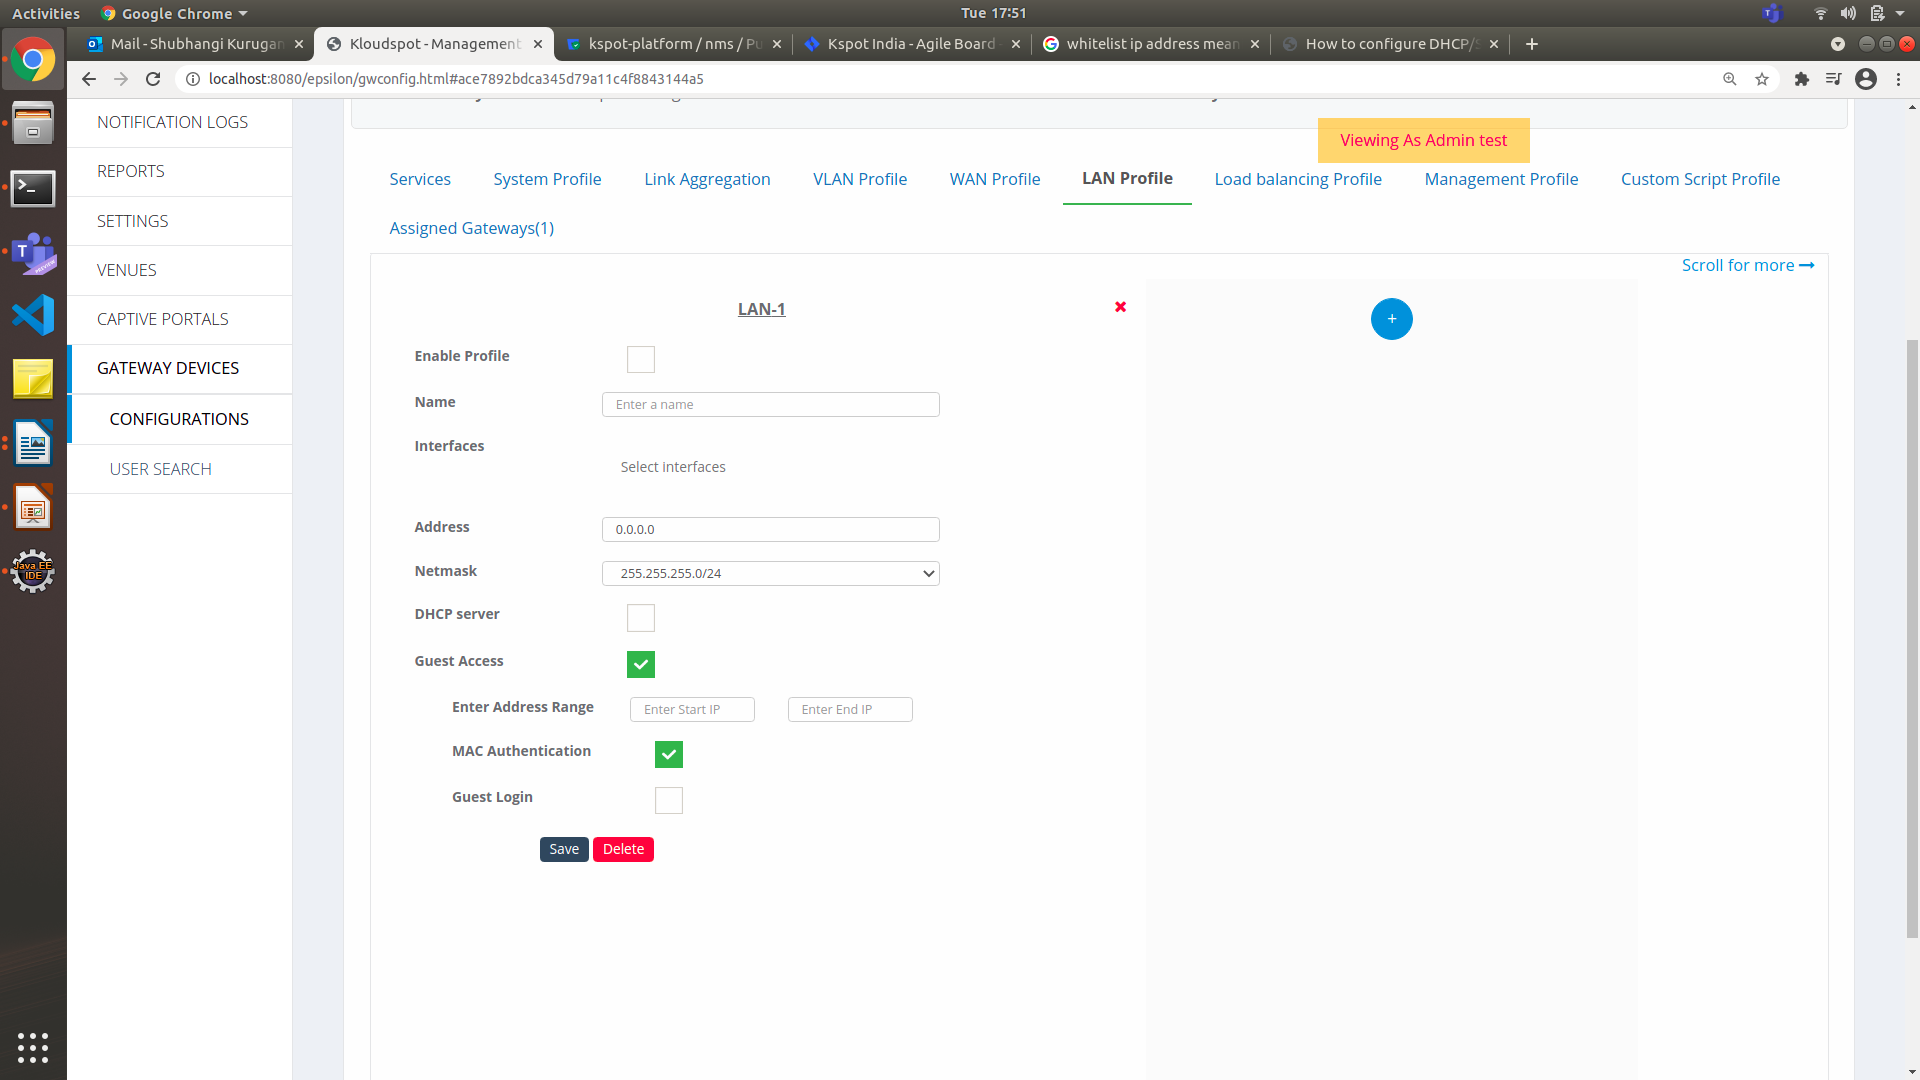 Figure 23-Guest Access Page
-
Check the MAC Authentication check box to verify the MAC address.
-
Guest Login : Kloudspot supports internal and external guest portals.
- Check the Guest Login check box to configure guest access.
- From the Guest Template drop-down list, select the assigned guest template.
- Check the External Guest Portal check box to integrate the guest portal.
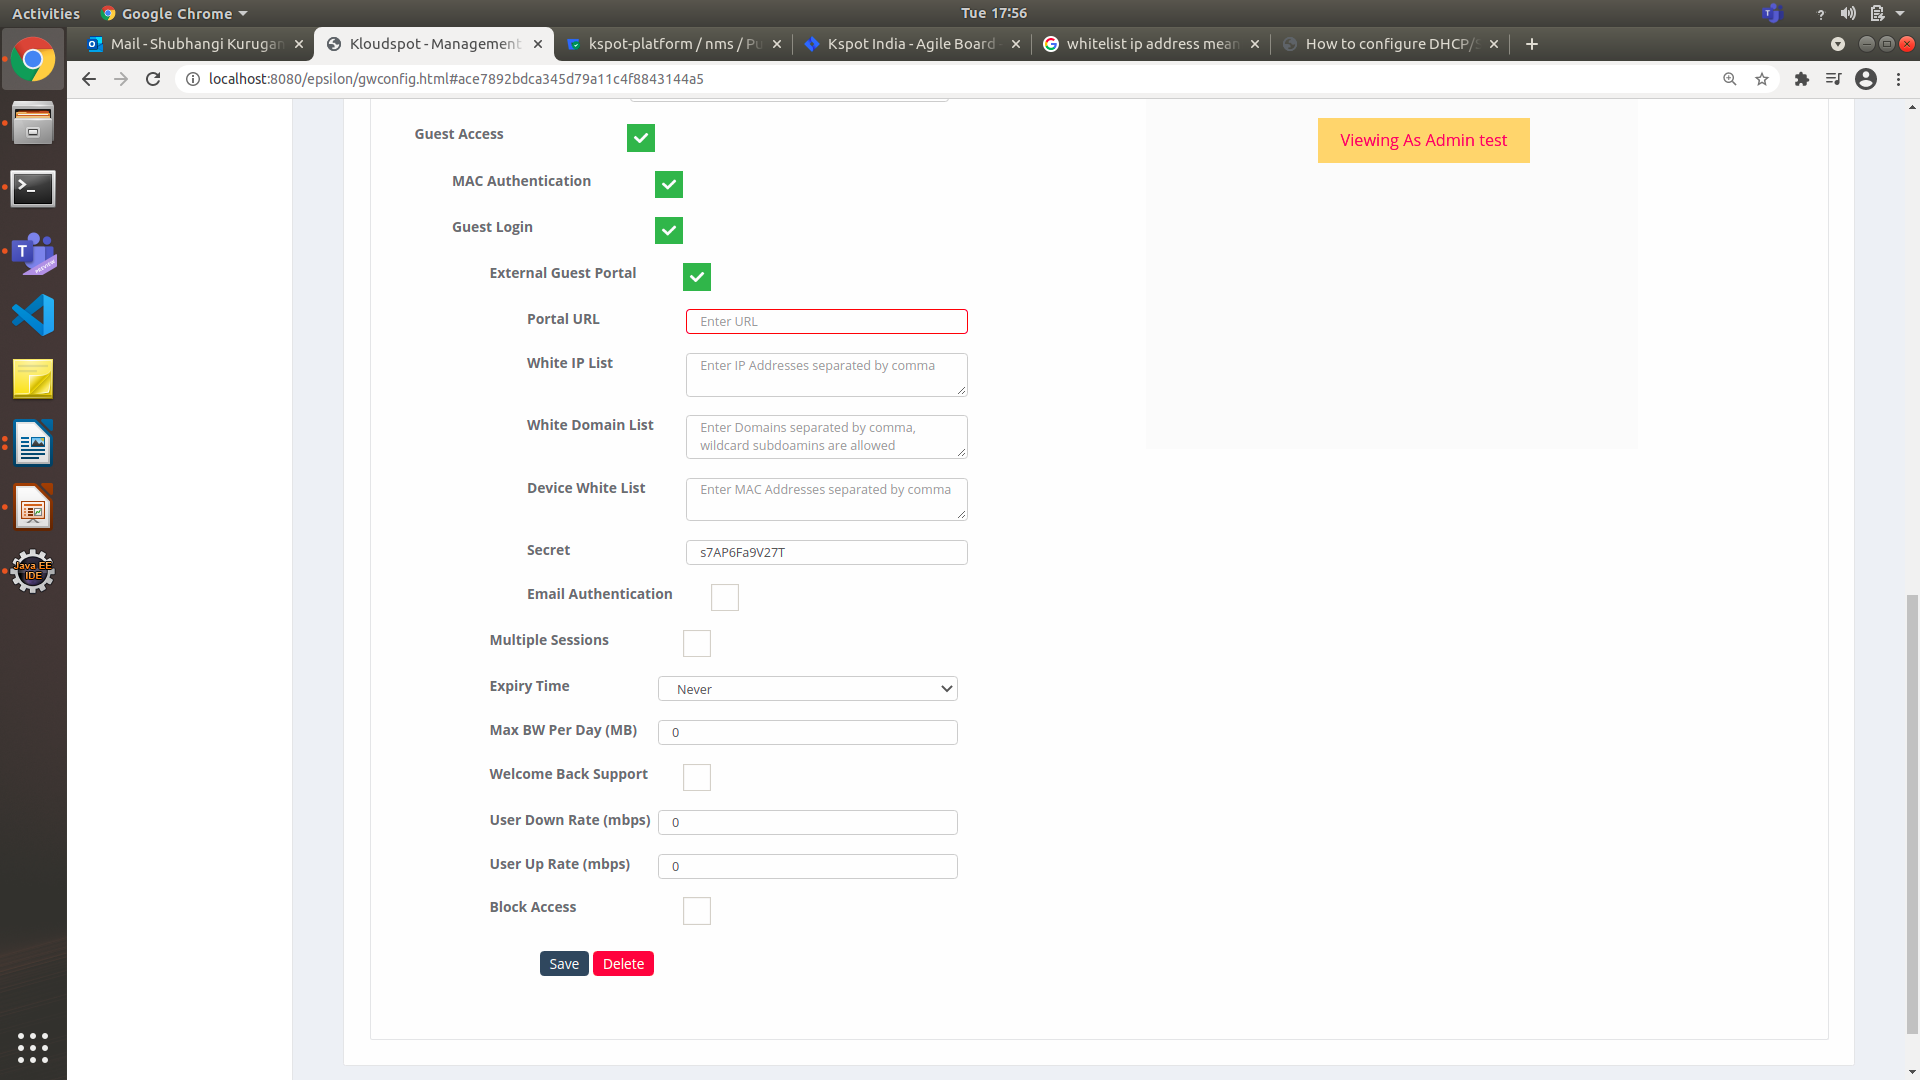 Figure 24-Guest Access Page
- Enter or paste the Portal URL that links to the Guest Portals web page as follows.

CAPTIVE PORTALS > GUEST PORTALS. The Kloud Portals page appears.
In the White IP List field, enter the IP addresses that allow you to create lists of trusted IP addresses and domains that permit you to access your domain. If you have multiple IP addresses, you ensure to separate addresses with comma.
- In the White Domain List field, enter the domain name separated by comma or wildcard subdomains.
- In the Device White List field, enter the MAC Addresses separated by a comma.
- In the Secret field, enter the shared key for authentications.
- Guest Access: The Guest Access module configure Email to authenticate and authorize a link to the Guest portals.
- Check the Email Authentication check box to verify by way of the email address.
- In the Access Time (in Minutes) field, specify the access time for a session.
- Enter or paste the Email Template URL that links to the email page as follows.
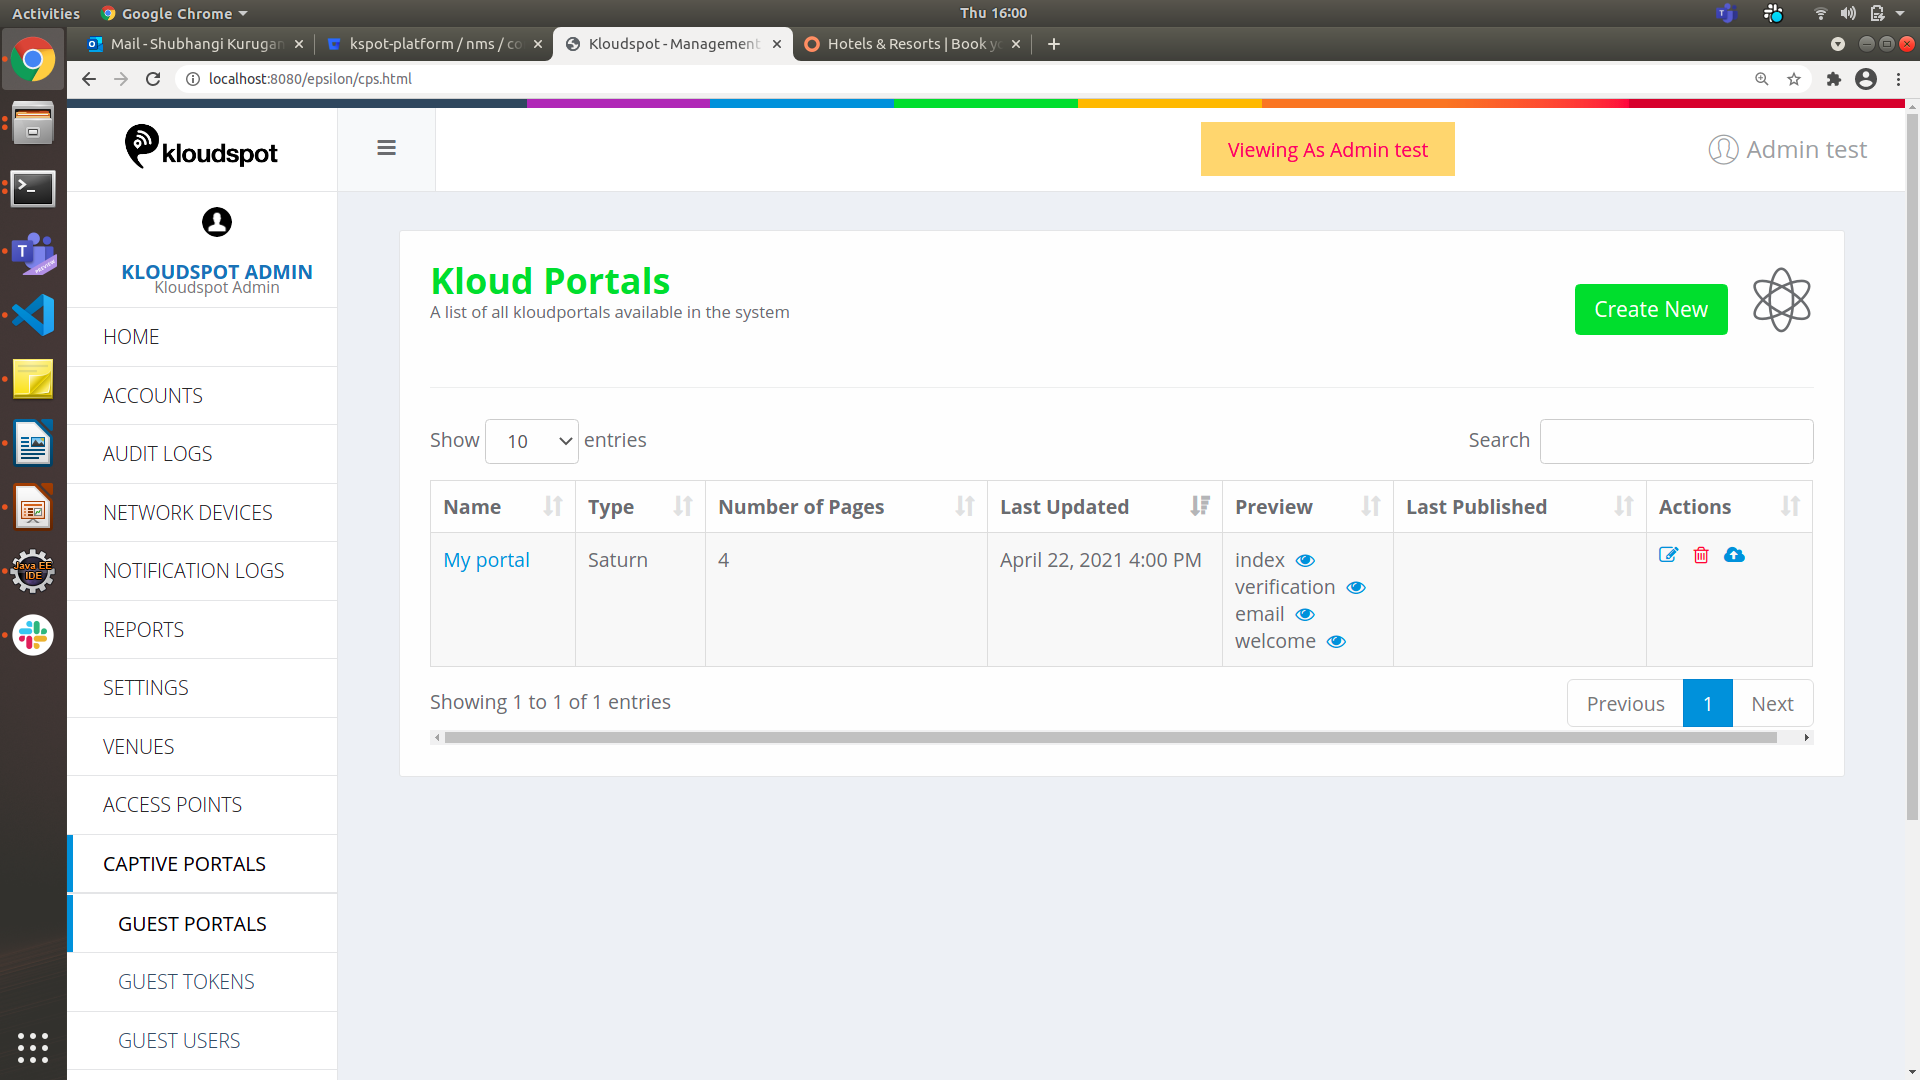 Figure 25-Kloud Portal page
-
From the Kloud Portals page appears.
-
In the Preview row, click your appropriate email browser, and copy the URL from the web browser’s address bar.
-
In the Email Subject field, enter the line informative for the email verification.
-
Enter or paste the Post Activate URL that links redirects to the welcome page after a successful login as follows.
-
From the Kloud Portals page appears.
-
In the Preview row, click your appropriate welcome or welcome-new browser, and copy the URL from the web browser’s address bar.
-
Check the Email Link Authentication check box to authenticate email
configuration.
-
Multiple sessions : A customer is assigned an IP address and a session ID to connect multiple devices for the usage of the network.
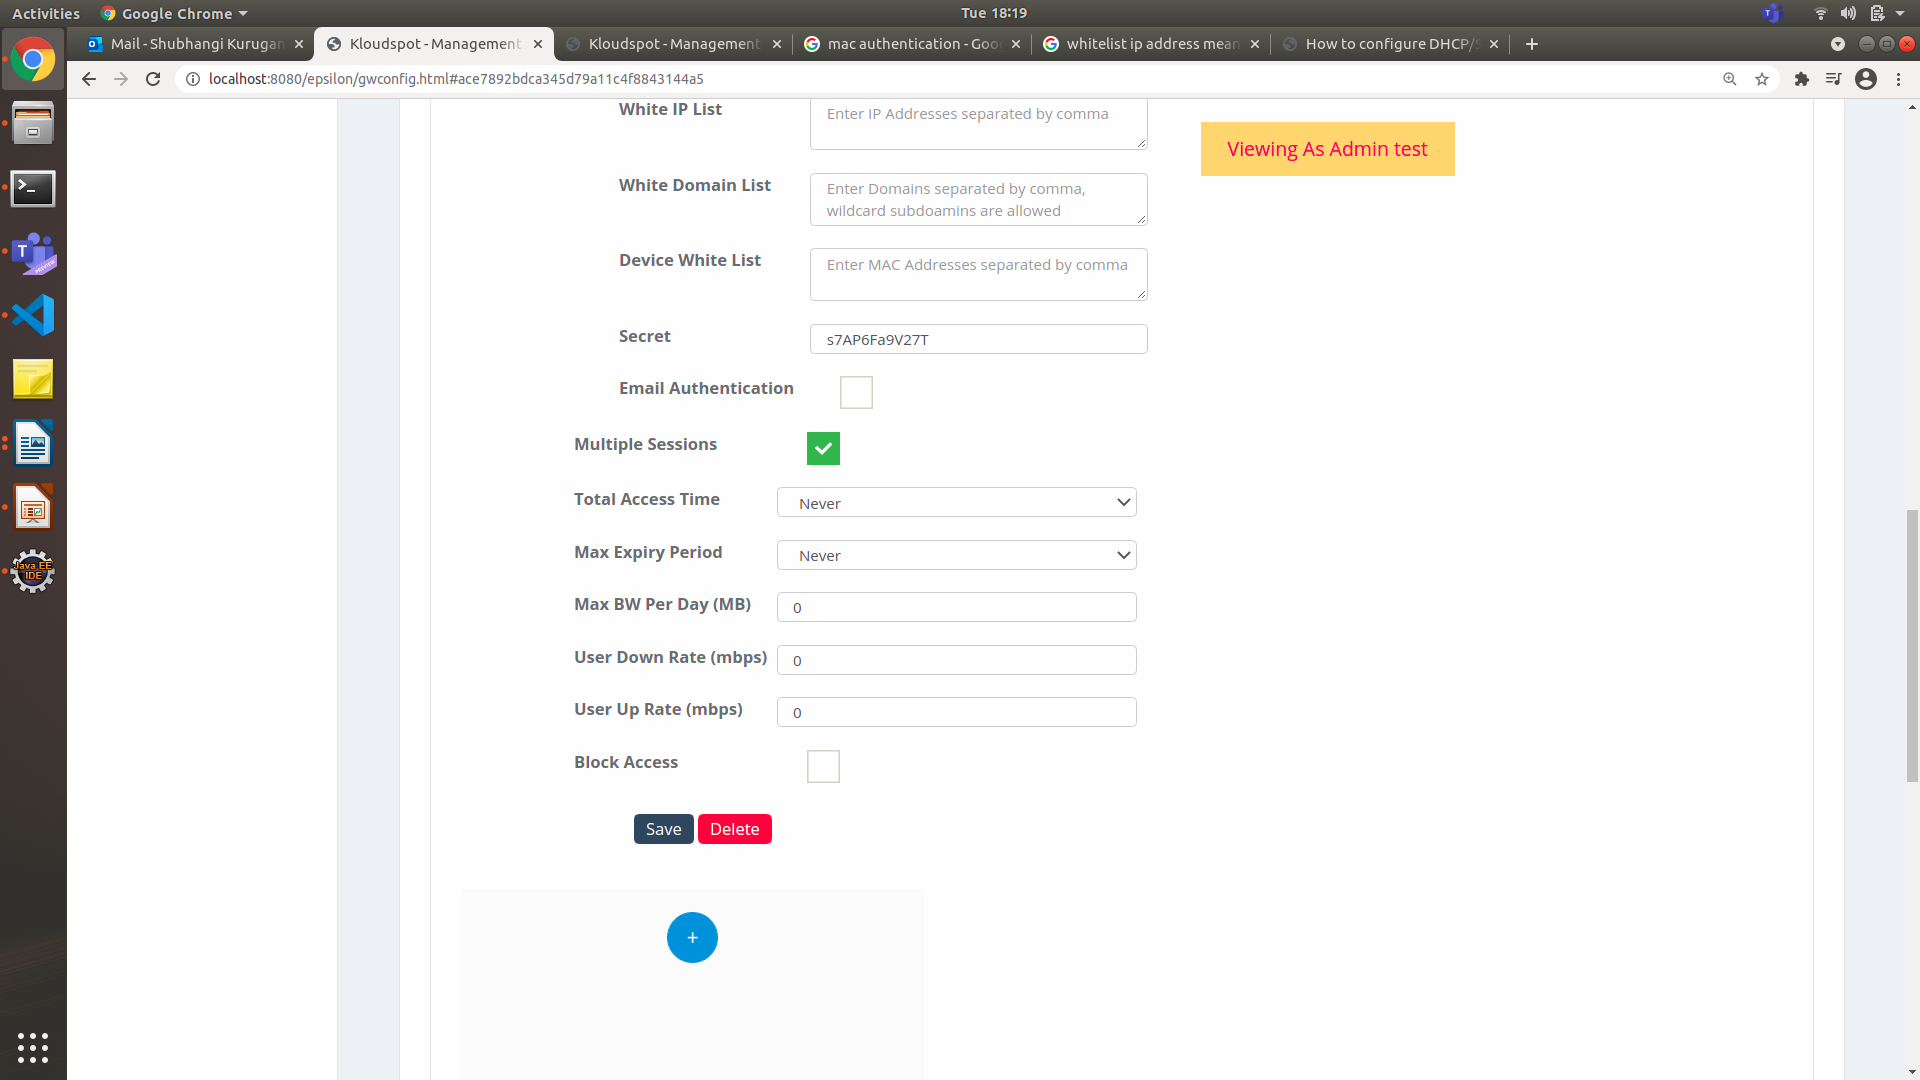 Figure 26-Guest Access cont.
- Check the Multiple Sessions check box to configure the network
session.
- From the Total Access Time drop-down list, choose the time or days for the customer.
- From the Max Expiry Period drop-down list, choose the days. This parameter specifies the expiry timer and will log off customer devices automatically.
- In the Max BW Per Day (MB) , use the up-arrow key or down to scroll the bandwidth ranges. This parameter specifies the bandwidth when the customer access the internet.
- In the User Down Rate (mbps) , use the up-arrow key or down to set the internet speed.
- In the User Up Rate (mbps) , use the up-arrow key or down to set the internet speed.
- Check the Block Access check box.
- If uncheck the Multiple Sessions check box. This assigns a session to
connect a device for the limited usage of the network.
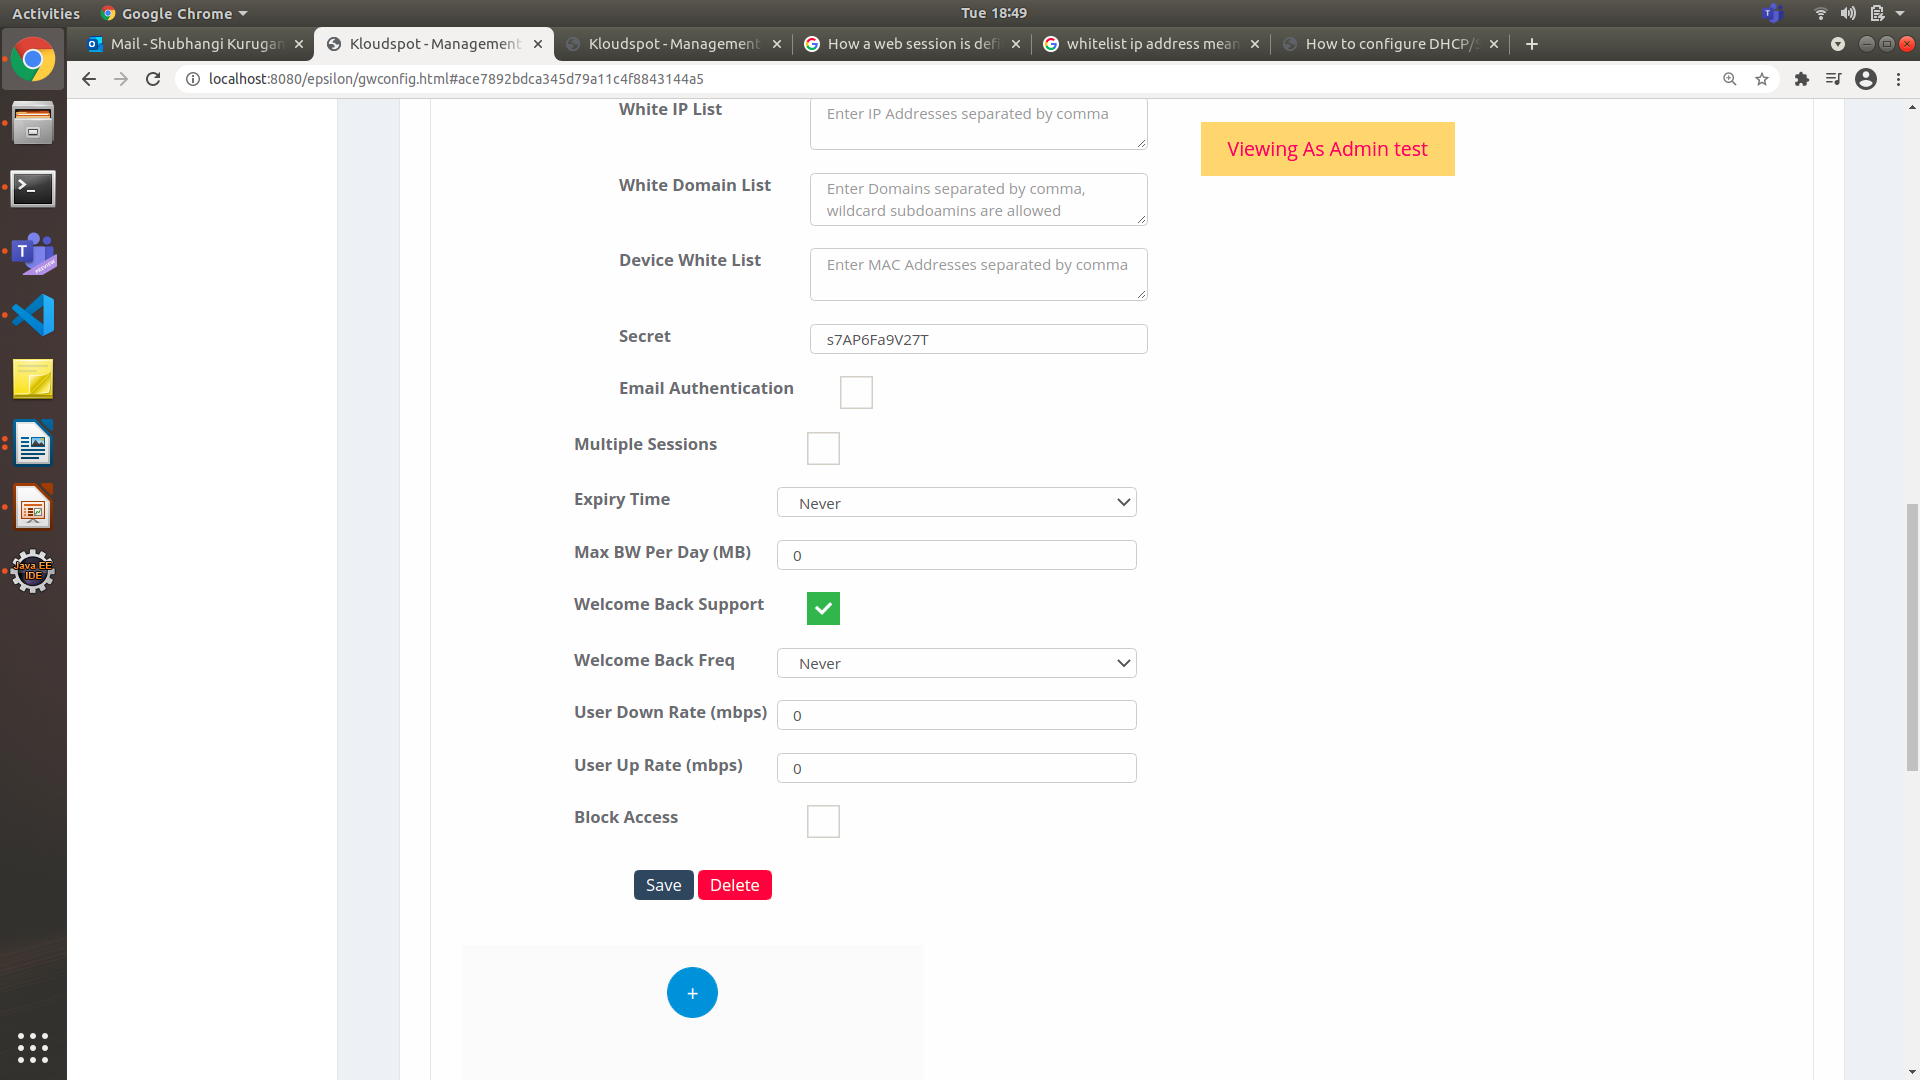 Figure 27-Guest Access cont.
- From the Expiry Time drop-down list, choose the time or days. This parameter specifies the expiry timer and will log off customer devices automatically.
- Click the Welcome Back Support check box to re-connect the session again for the customer.
- From the Welcome Back Freq drop-down list, choose an option: time, days, or a year.
- Click Save.
Load Balancing Profile
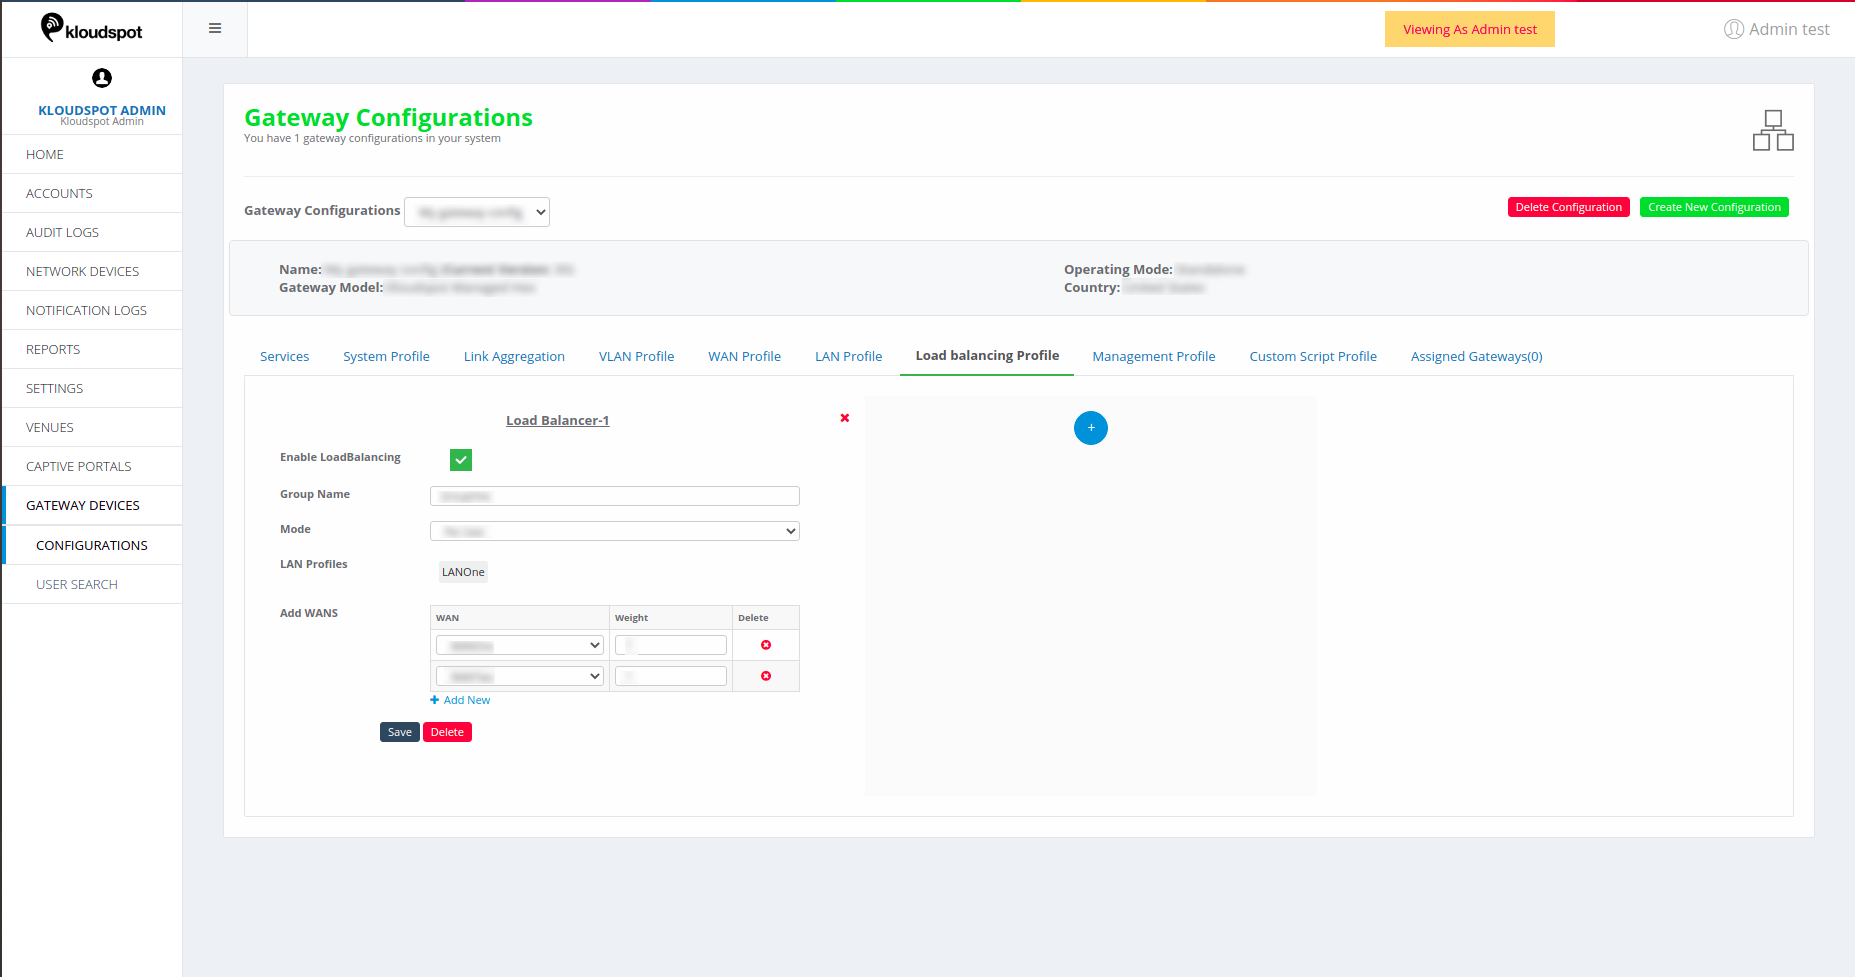 Figure 28-Load balancing page
- Enable LoadBalancing: Click on this to make profile enable.
- Group Name: Give a name to the profile.
- Mode: Choose a required mode. (Load balancing is done based on connecting users or connected gateway device)
- LAN Profiles: Select the number of LAN profiles.
- Add WANs: Choose desired WAN profiles. Assign weights to set the load to each WAN as required (make sure WAN profiles are configured enabled in the WAN Profile section) .
- Click on +Add New to add more WAN profiles. Click on ** 5. Click on Save.
Management Profile
Management profile serves different purpose in Standalone Operating Mode and
High-Availability Configuration Mode.
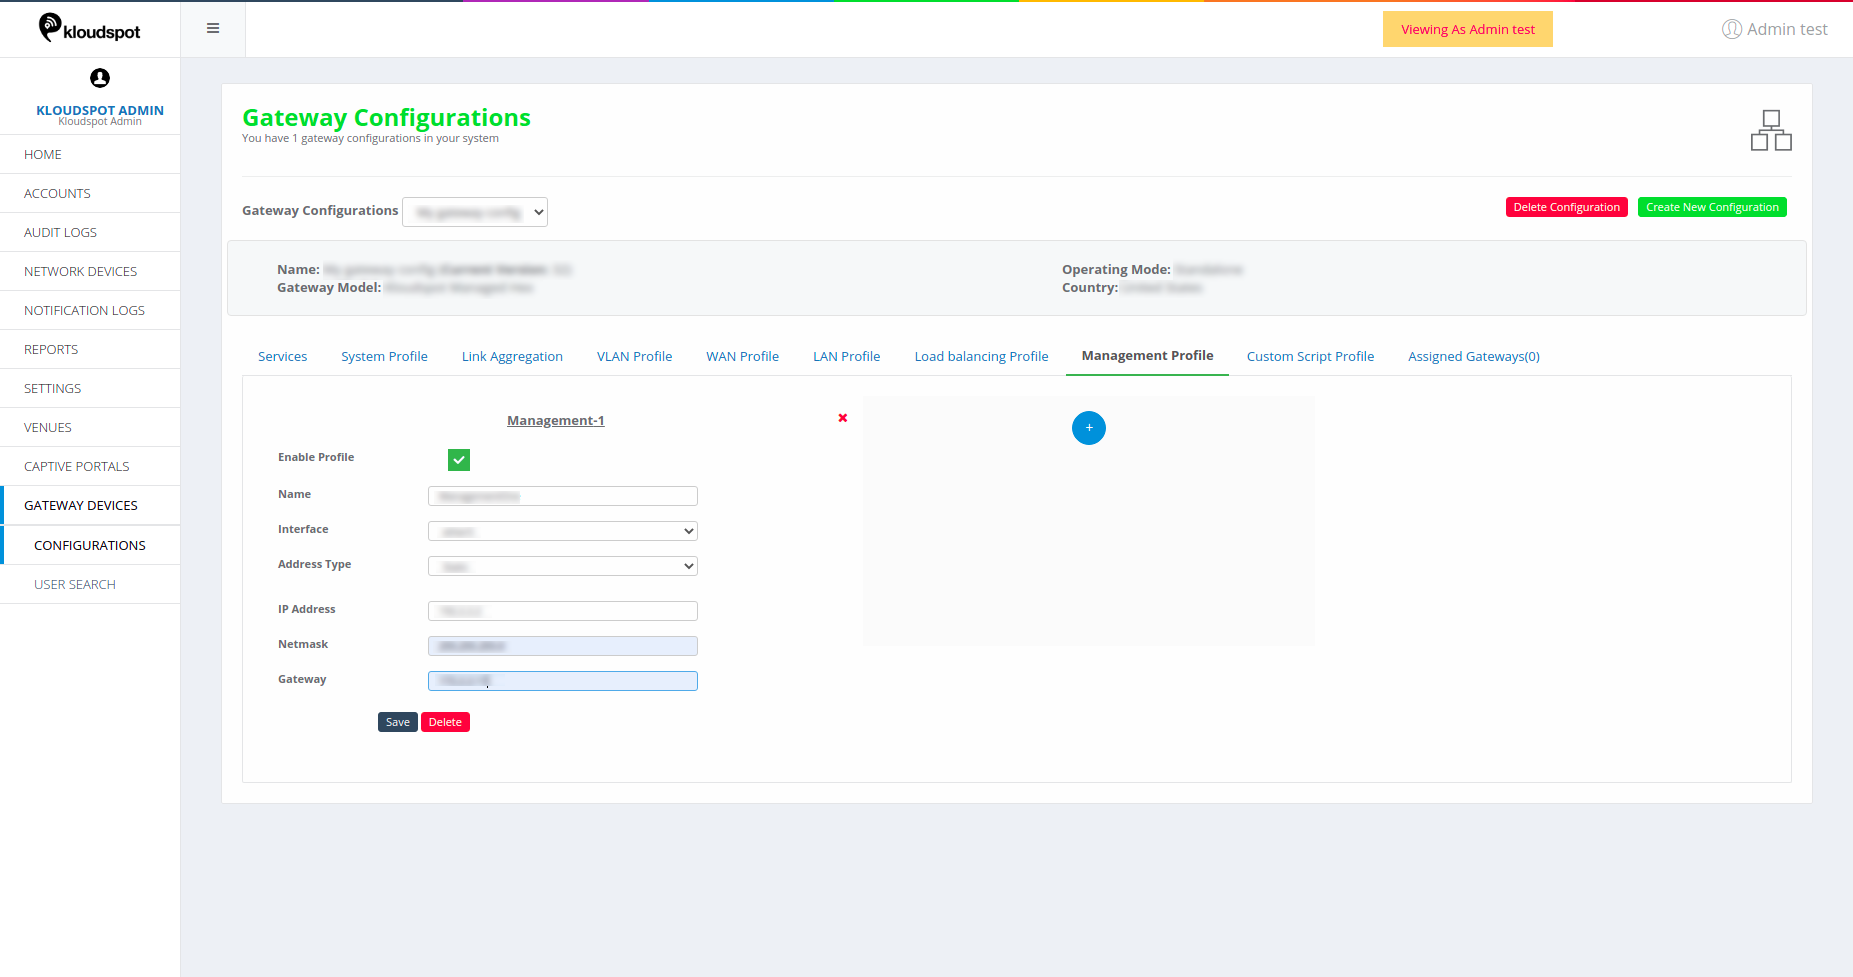 Figure 29-Management Profile page
- Enable Profile: Click on this to make enable the profile.
- Name: Give a name to the profile.
- Interface: Choose a desired interface for this profile from the drop-down list.
- Address Type: Choose an address type whether Static or Dynamic. If Static, then specify the IP address, Netmask and Gateway.
- Click on Save to save the profile added.
Assigned Gateway
Once all the profiles are configured, assign gateway devices that run on this
configuration.
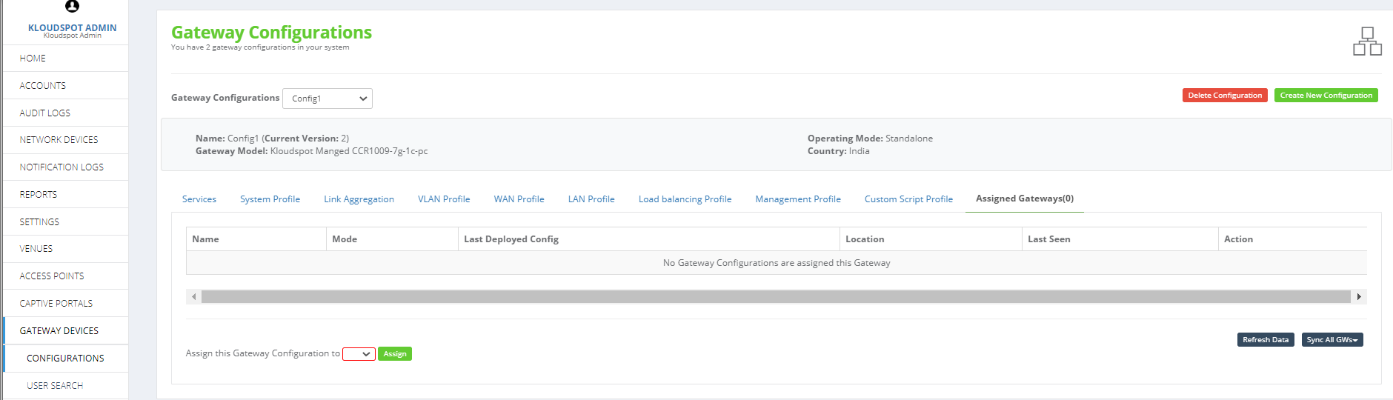 Figure 30-Assigned Gateway page
-
Click on the Assigned Gateways tab from the Gateway Configurations page.

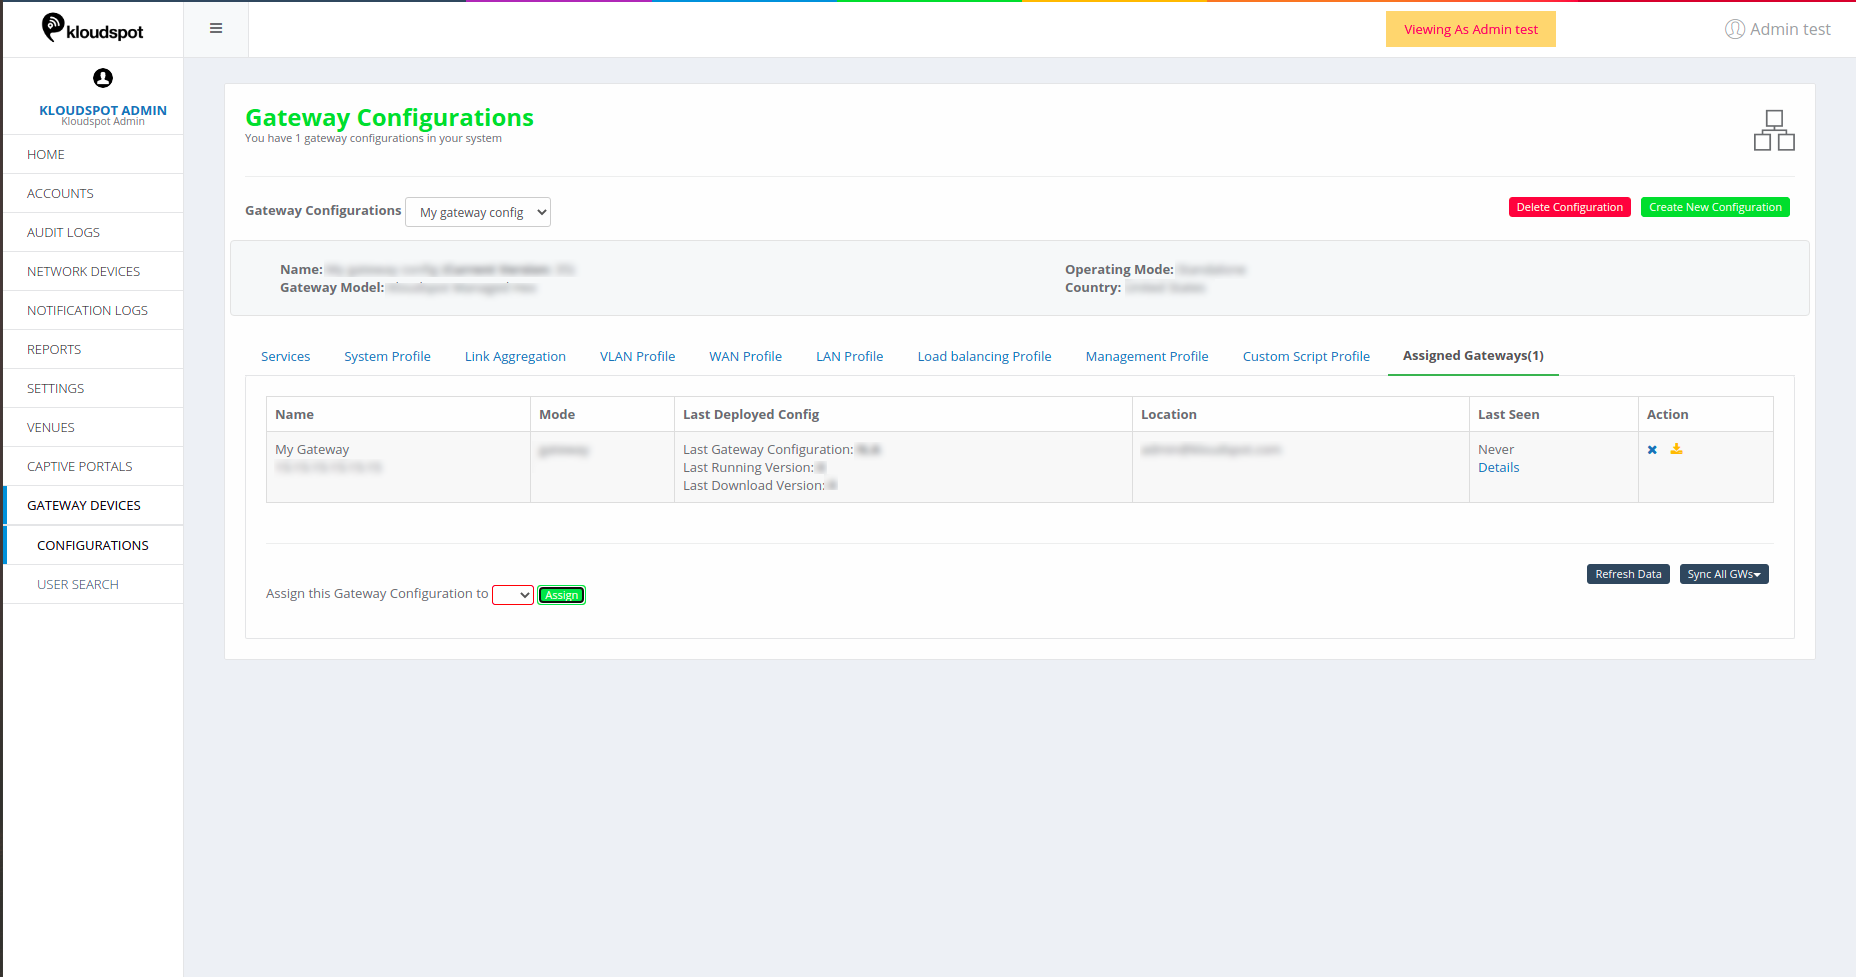 Figure 31-Detailed of assigned gateway
-
Click on  selected gateway device.
-
Name: Name of the assigned gateway.
-
Mode: Shows Gateway as mode.
-
Last Deployed Config
- Last Gateway Configuration: This shows the last deployed configuration once it is synced with the gateway devices.
- Last Running Version: This shows the configuration version which the device is running on.
- Last Downloaded Version: This shows the configuration version last downloaded by the device.
- Last seen: Click on Details, it opens a popup with runtime
and Firmware information.

 with the same configuration.
Gateway Configuration for High Availability Mode
Only Management Profile and Assigned gateways section changes.
Management profile for High-Availability configuration Mode
HA Configuration provides Master and Slave features. It supports two WAN
Modes.
-
Use same WAN Profile
-
Use different WAN Profile
HA Configuration with same WAN profile.
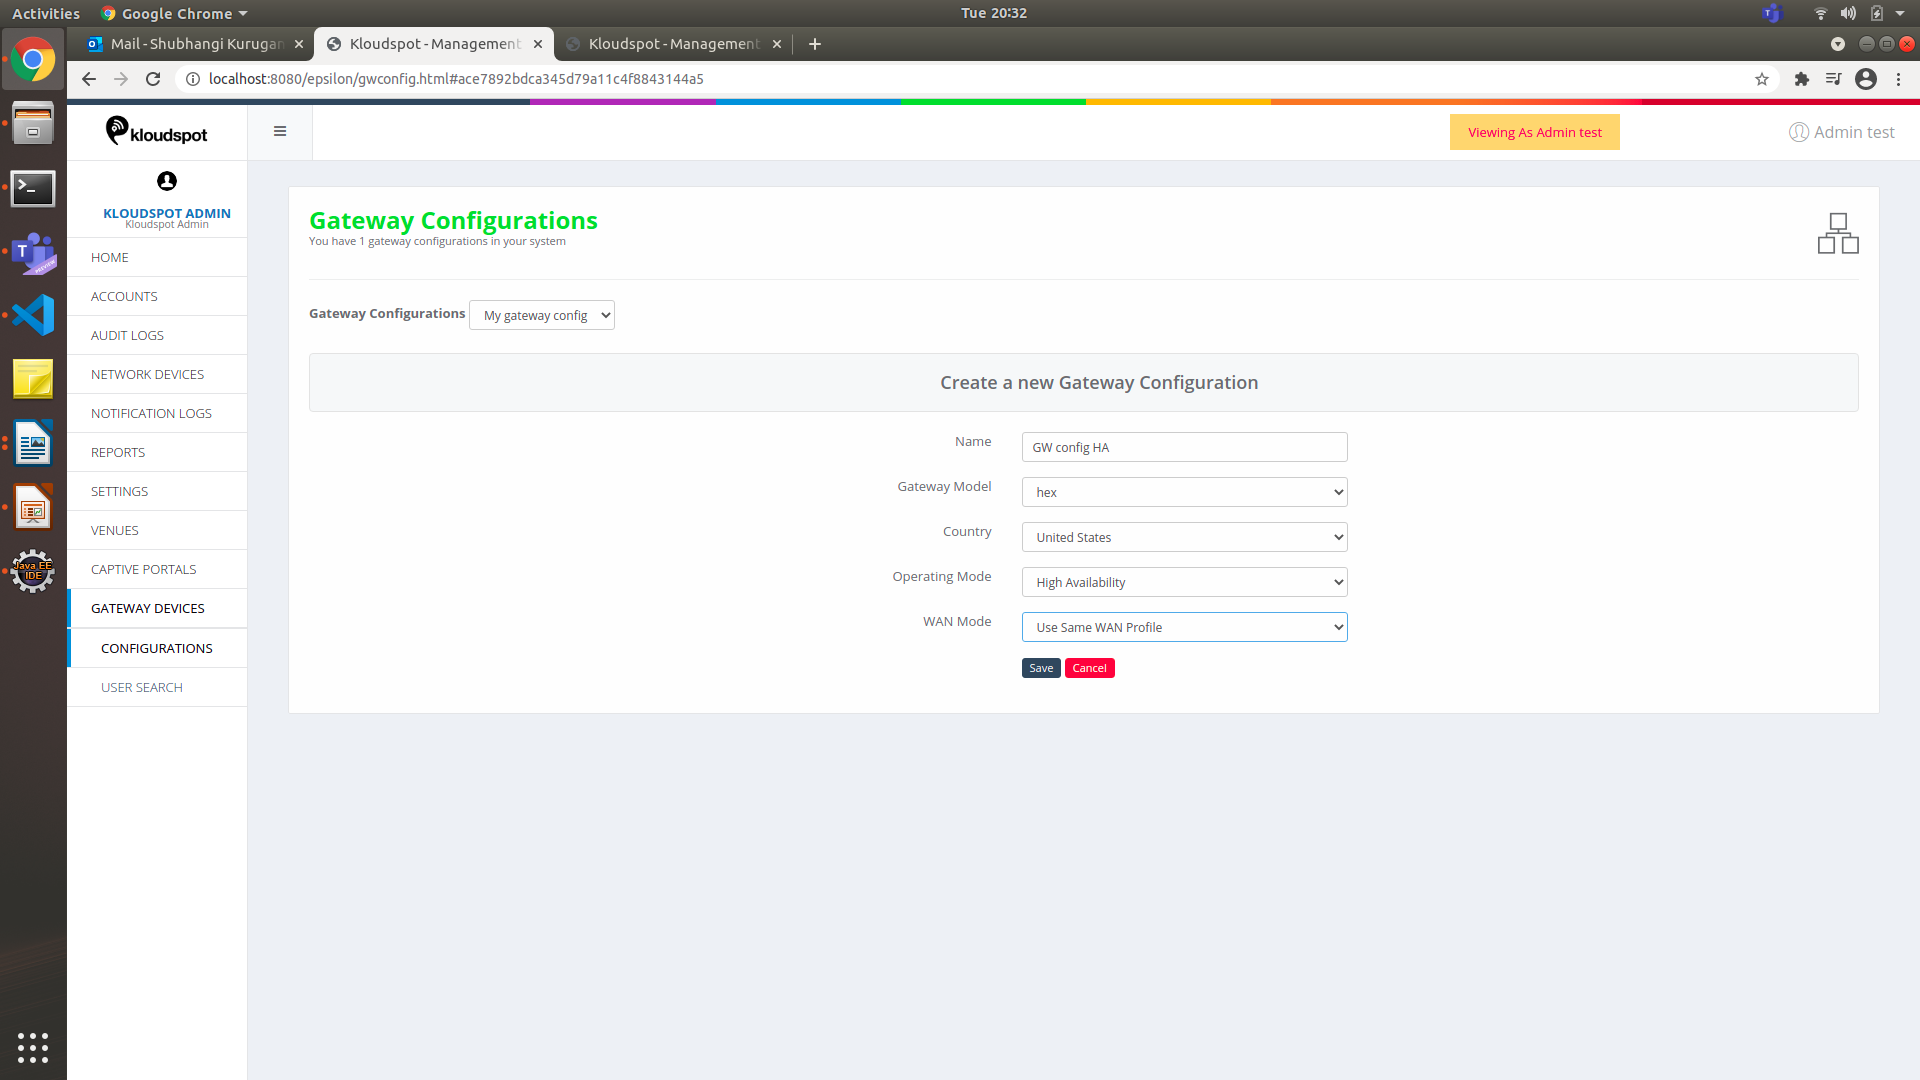 Figure 32-Add a gateway device for HA mode
- Choose operating mode as High Availability.
- Choose WAN mode as Use same WAN Profile.
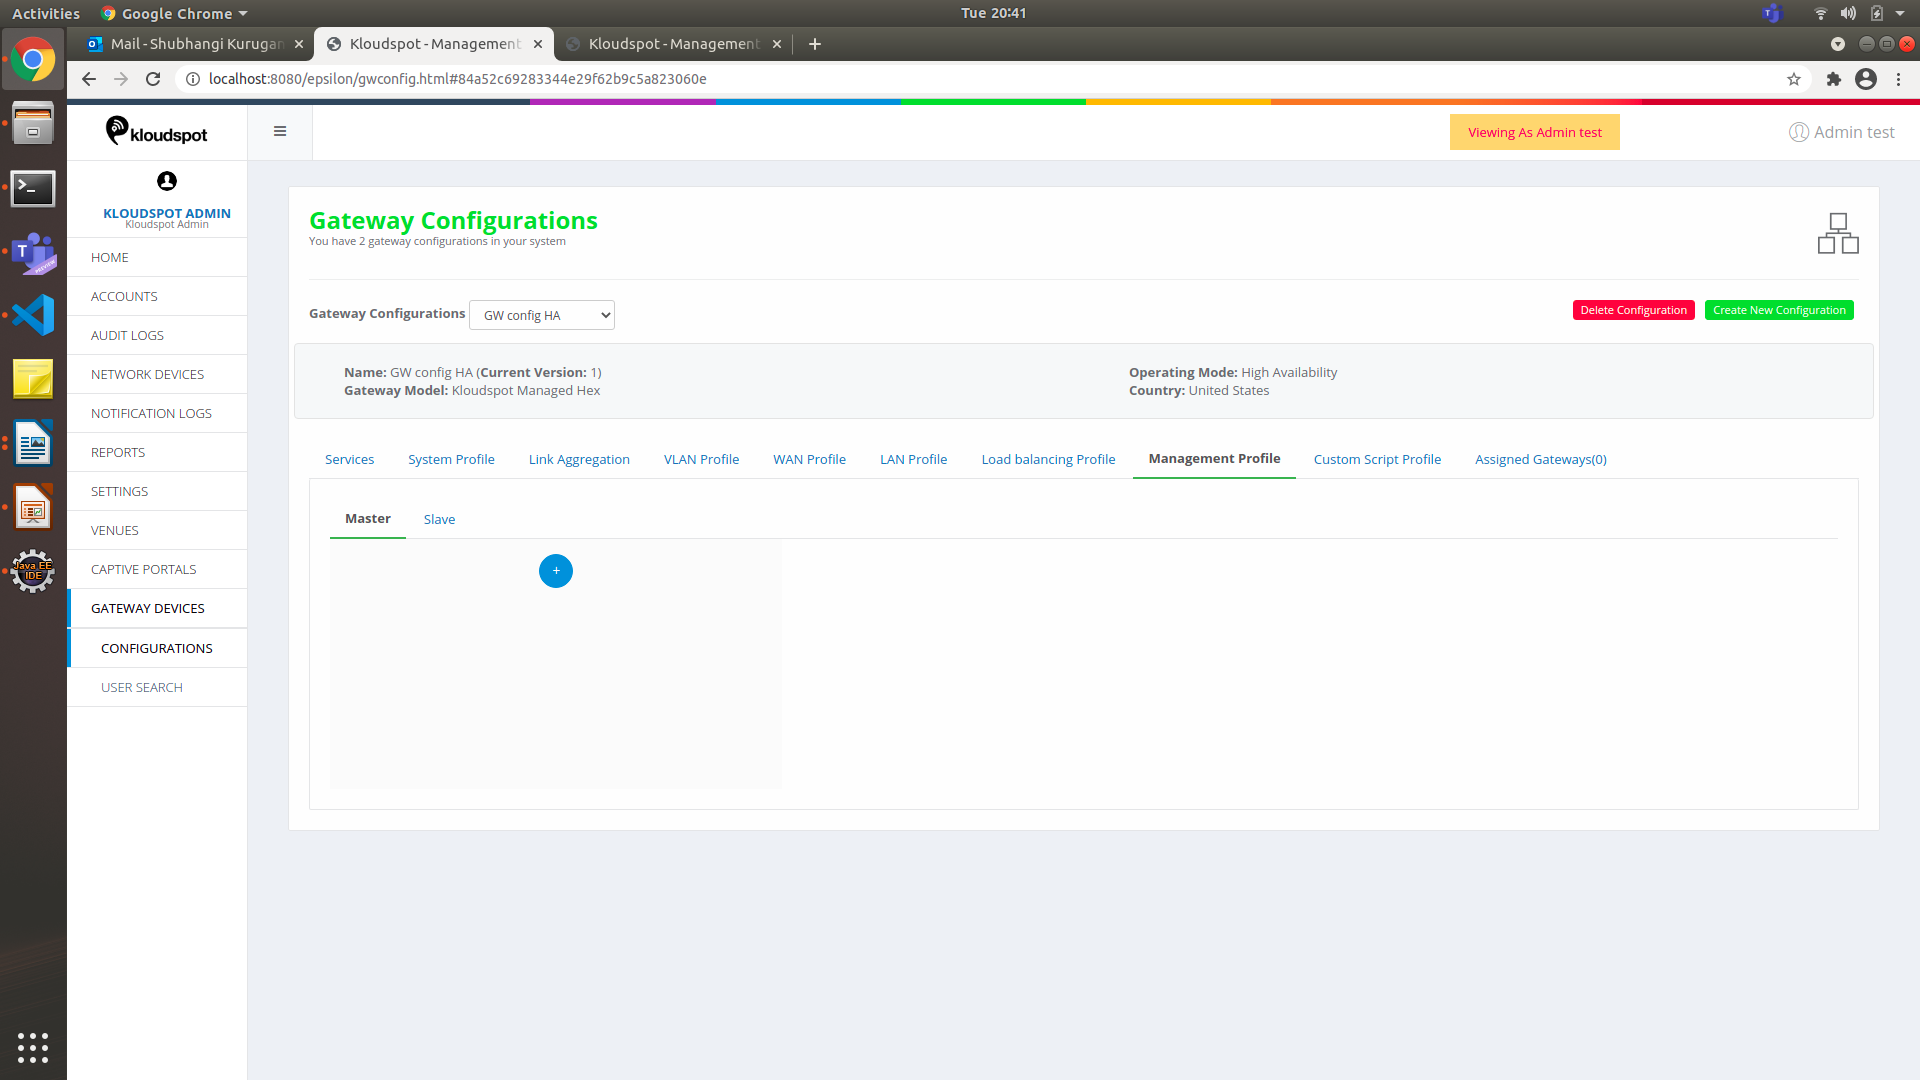 3. By default, Master Tab will be open. Click on
 information same as that in the Standalone Profile.
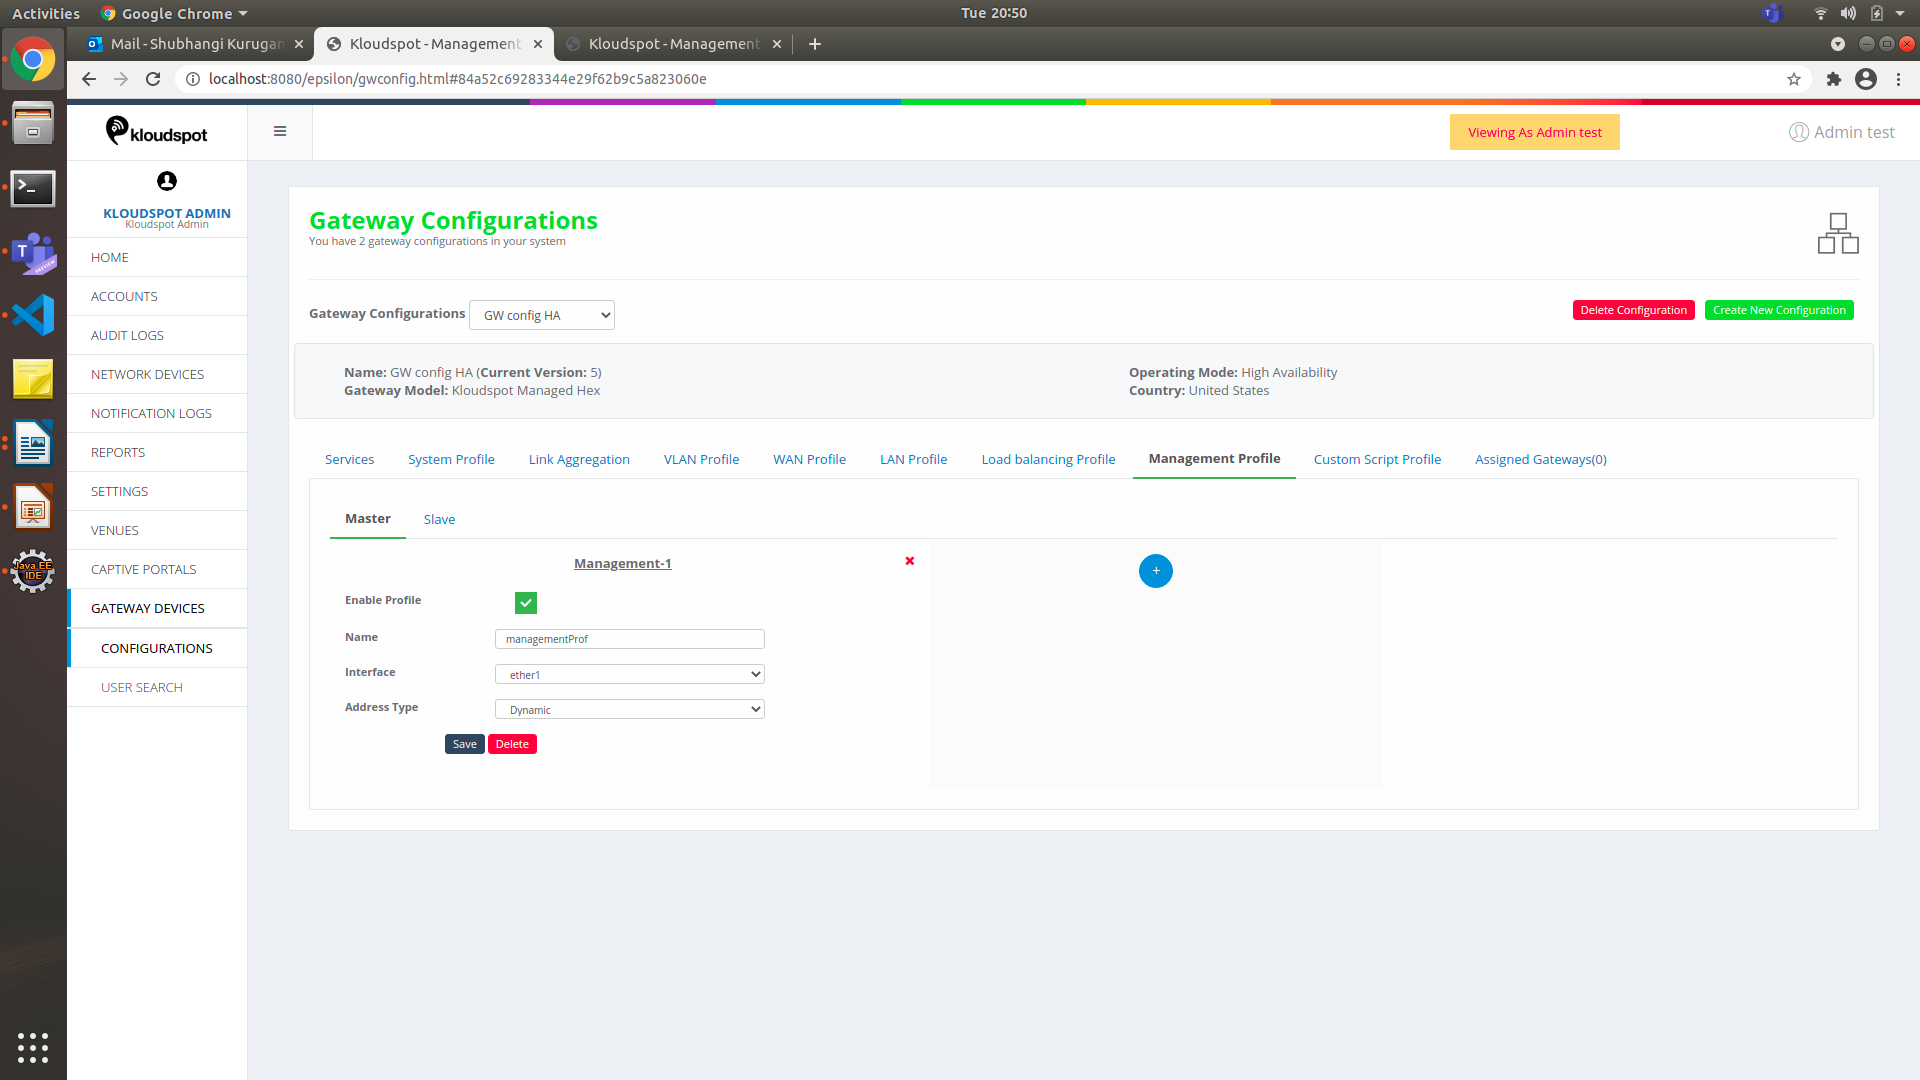 Figure 33-Master profile for Management profile in HA mode
 Choose the Interface from the drop-down list. This interface must be the
interface created in Master Profile i.e., ether1.
Choose the Interface from the drop-down list. This interface must be the
interface created in Master Profile i.e., ether1.
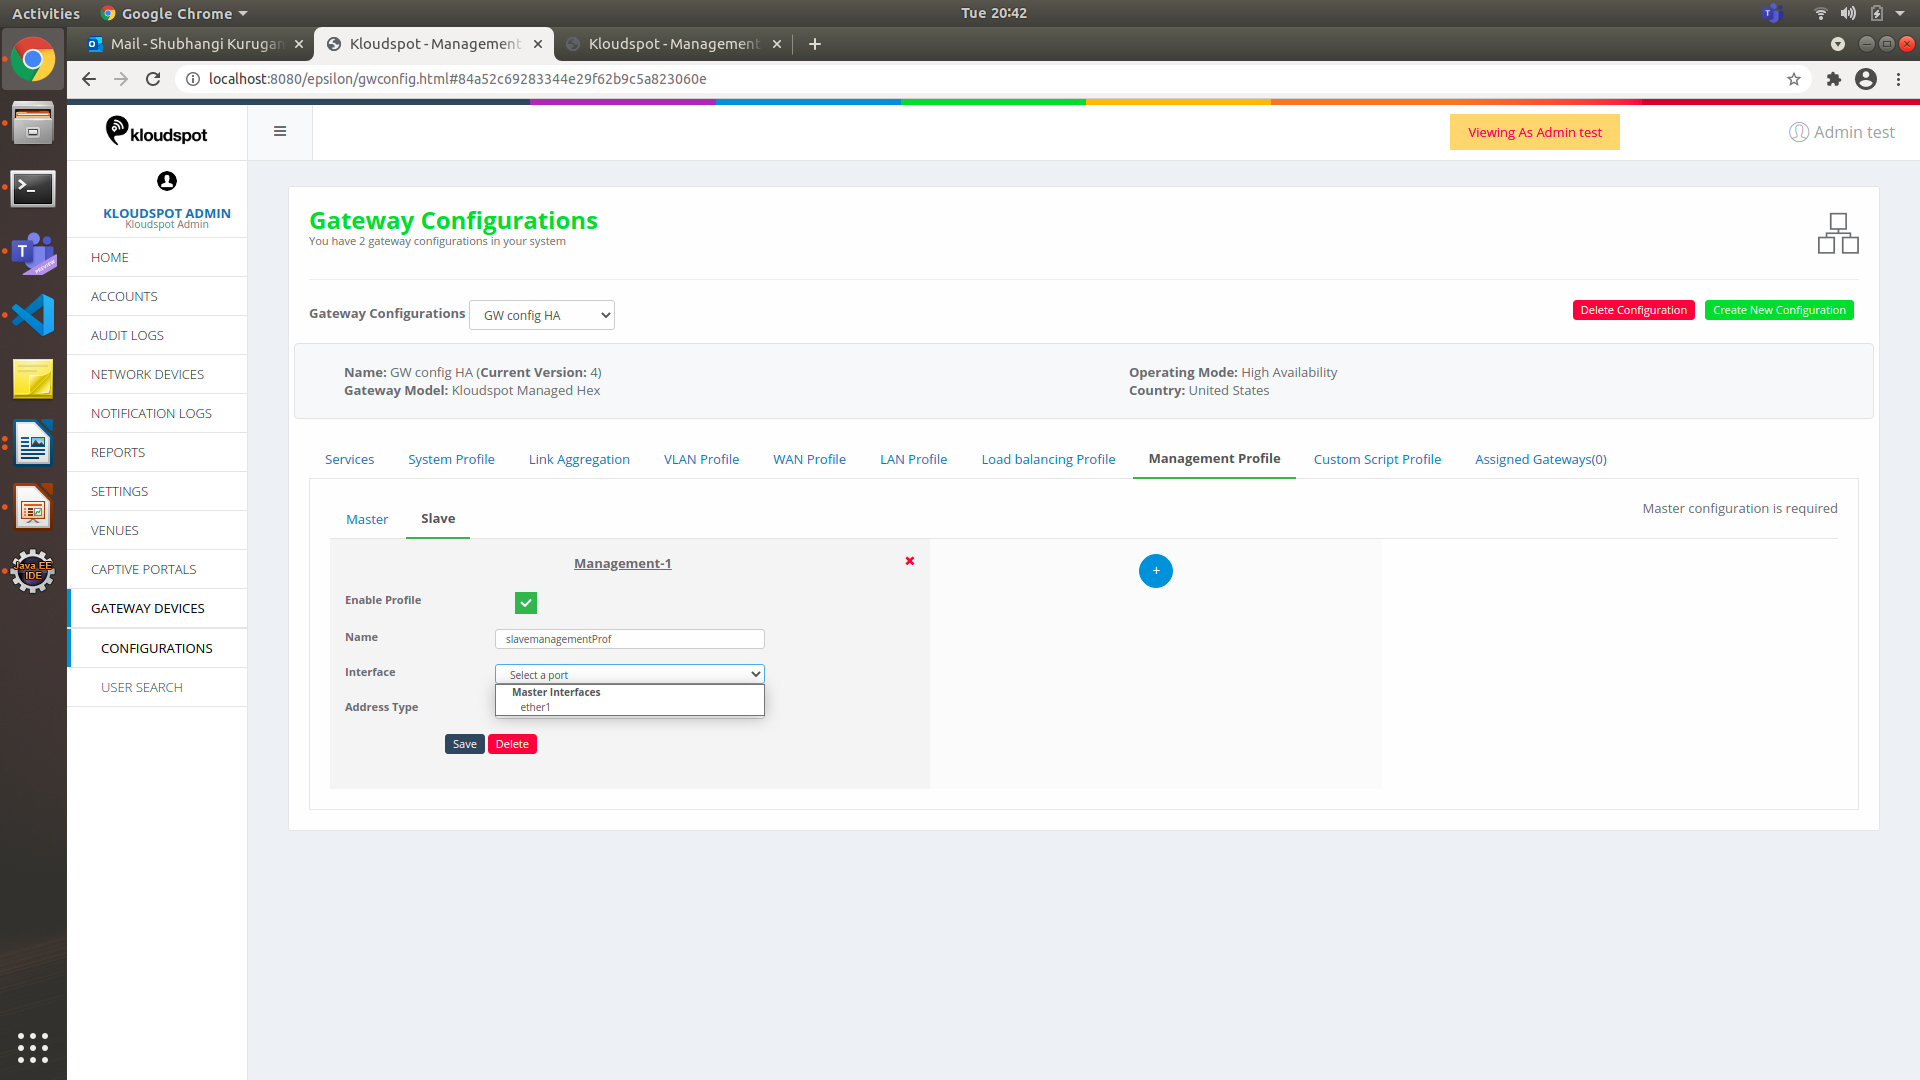 Figure 34-Slave profile for Management profile in HA mode
-
Fill in all the information, same as that in the Standalone Profile.
-
Click on Save.
HA Configuration with different WAN profile.
WAN Profile, Load Balancer Profile, Management Profile and Assigned gateways
section changes. They will have Master and Slave Configurations.
- Create New Gateway Configuration
- Operating Mode : Select as High Availability.
- WAN Mode : Select as Choose Different WAN Profile.
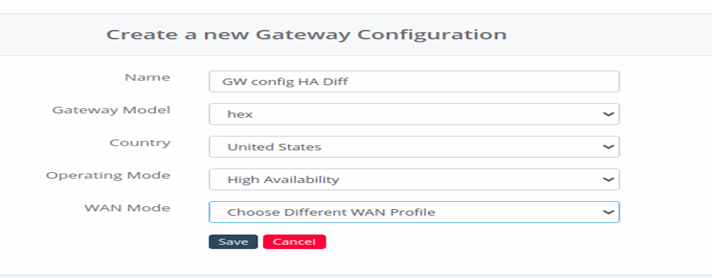 Figure 35- Add new Gateway device for different WAN profile
- Create Master WAN
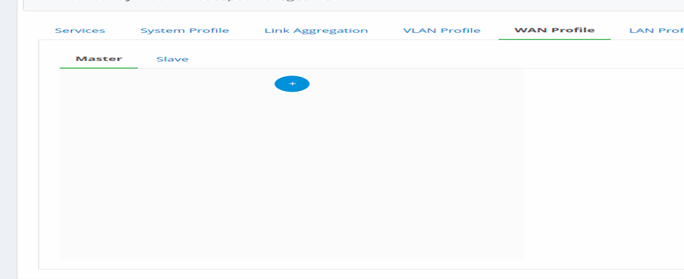 Figure 36-Add Master for Different WAN profile mode
- Click on WAN Profile tab from the Gateway Configurations page.
- Click on Master tab and Click on to create a new master profile.
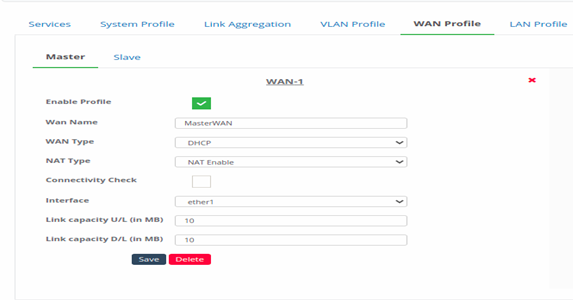 Figure 37-Confiigure master for different WAN profile mode
- Hover on to the profile, click on edit button.
- Enter all the input information. This information will be same as explained in the standalone.
- Click on Save at bottom, to save the master WAN profile.
- Create a Slave WAN
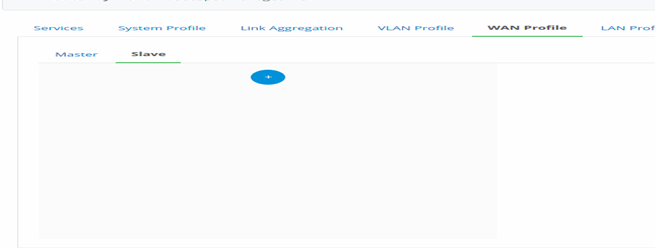 Figure 38-Add slave for different WAN profile mode
- Click on Slave tab and Click on to create a new slave profile.
- Hover on to the profile, click on edit button.
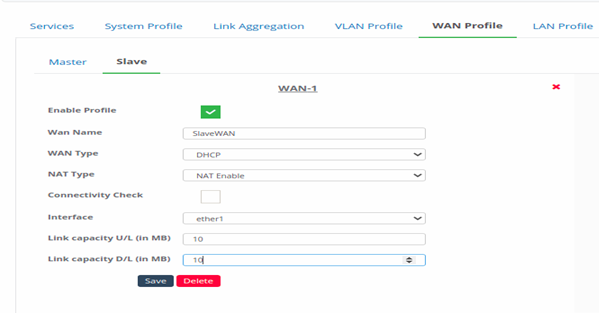 Figure 39- Configure slave for different WAN profile mode
- Enter all the input information. This information will be same as explained in the standalone.
- Slave Interfaces will be same as the master interfaces. (For example: as mentioned above configuration for Master WAN, interface ether1 is assigned as Master, so the slave here can have only ether1 )
- Click on Save to save the slave WAN profile.
- Create Master Load Balancer
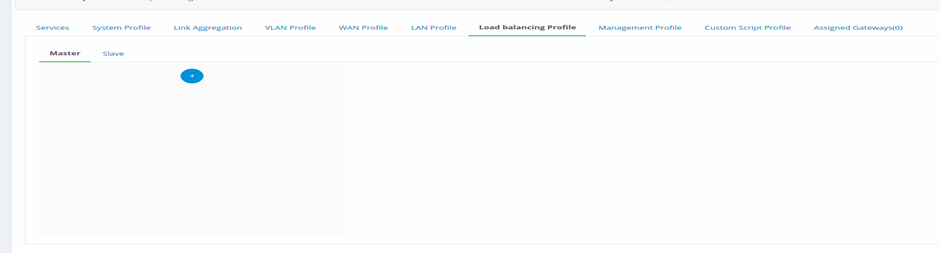 Figure 40- add master for Load Balancing
- Click on Load Balancing Profile tab from the Gateway Configurations page.
- Click on to create a new Master Profile.
- By default, master tab will be open. Click on Master tab to configure master profile.
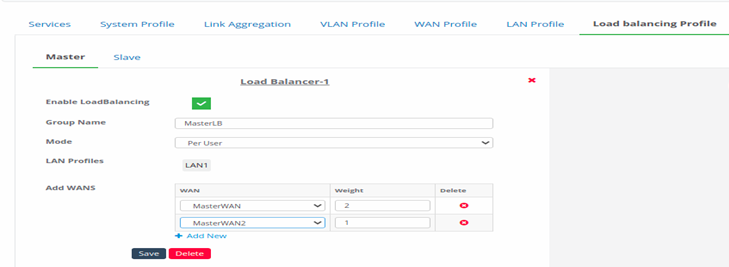 Figure 41-Configure master for load balancing
- Hover on to the profile, click on edit button.
- Enter all the input information. This information remains the same as explained in standalone.
- Master Load Balancing Profile will have Master WANs to set the load balance.
- Click on Save to save the master Load Balancer profile.
- Create Slave Load Balancer
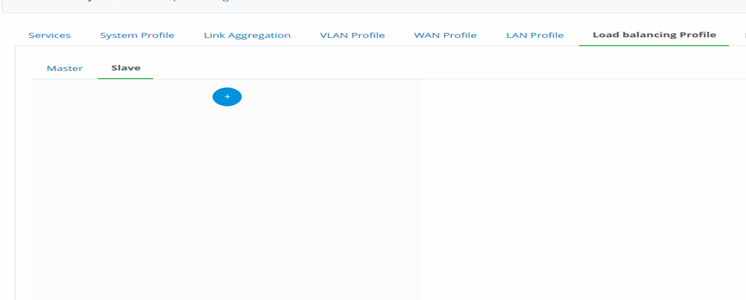 Figure 42-Create Slave for load balancing
- Click on Slave tab and Click on to create a new Slave Profile.
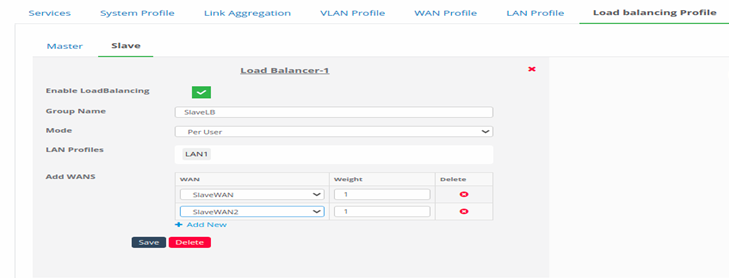 Figure 43-Configure slave for load balancing
- Hover on to the profile, click on edit button.
- Enter all the input information. This information remains the same as explained in standalone.
- Slave Load Balancing Profile will have Slave WANs to set the load balance.
- Click on Save to save the slave Load Balancer profile.
- Create Master Management Profile & 8. Create Slave Management Profile
- This is same as configuring the Management profile in HA configuration with same WAN Mode.
- However, follow the same steps to configure the Management Profile for HA configuration with different WAN Mode.
- Assigned Gateways
- This is same as mentioned in the HA configuration for same wan mode. Please follow the same steps
Assigned Gateways
A user can choose a gateway to assign to the configuration along with the
mode. If the mode is MASTER, the configuration done for master profiles will
be applied. If the mode is SLAVE, the configuration done for master profiles
will be applied.
For both the modes, the profiles that are same without master and slave
feature like Services, systems, link aggregation, vlan will remain same.

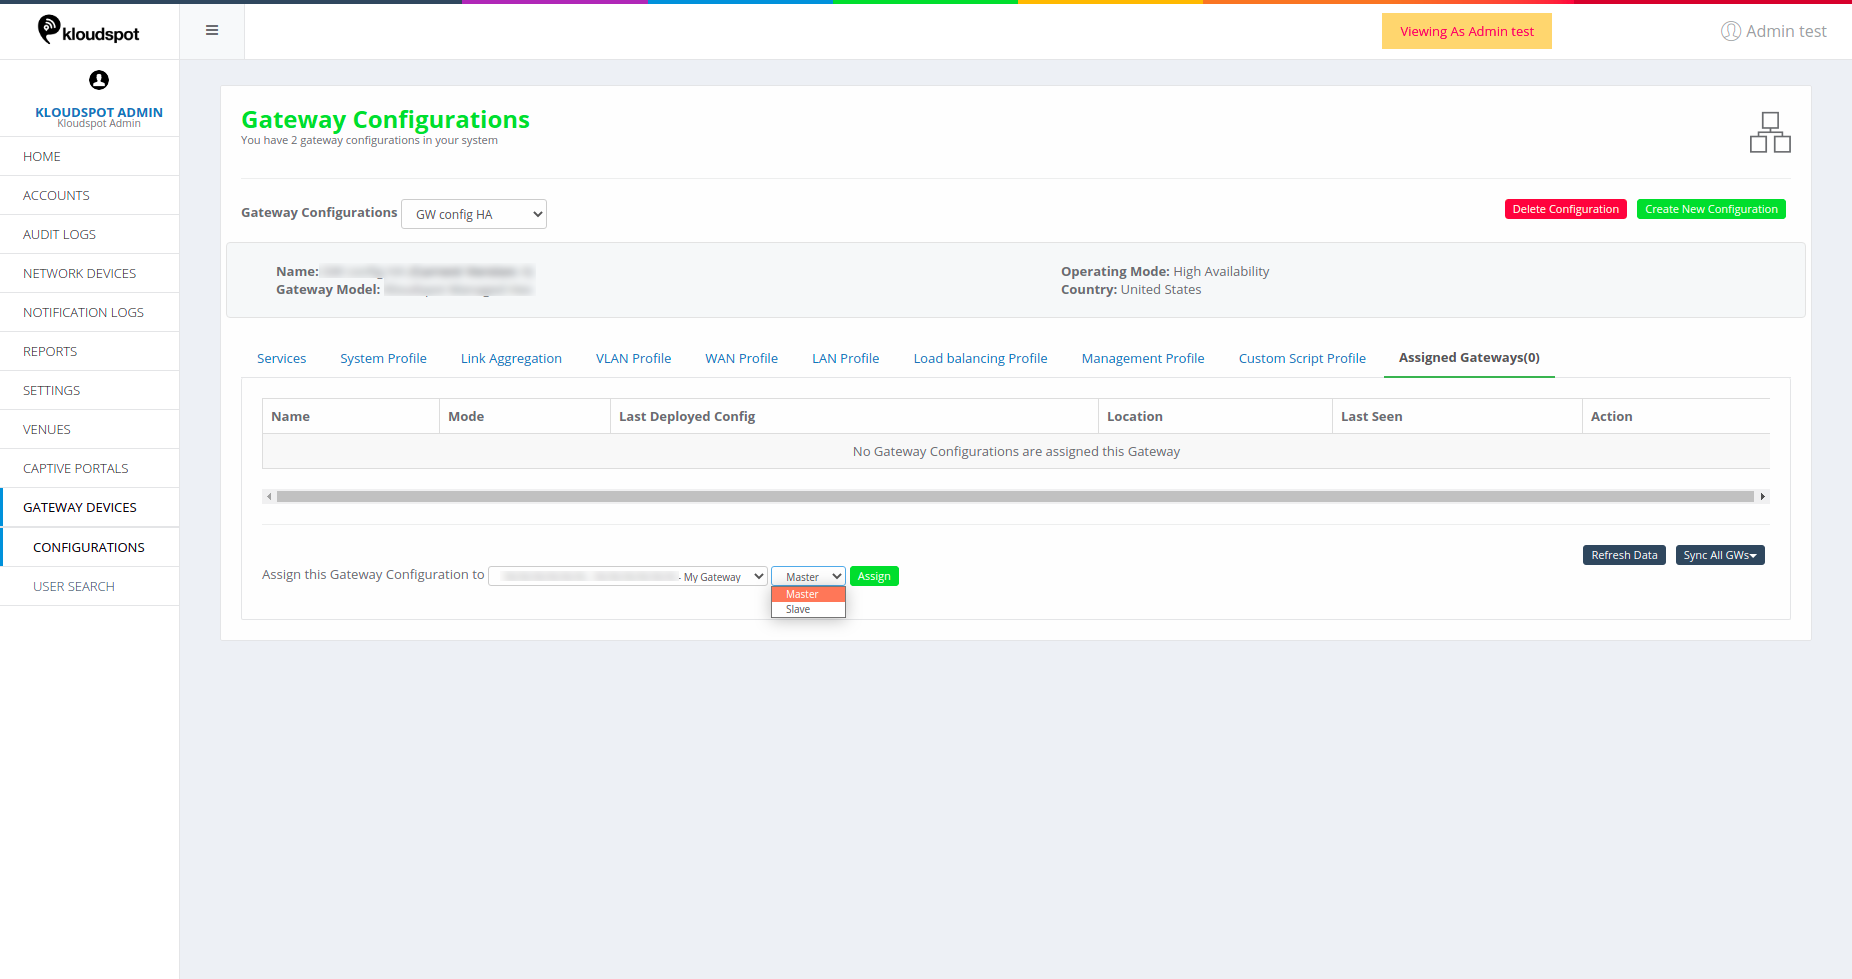 Figure 44-Assigned gateways for HA mode
- Name: Name of the Master device assigned to the configuration.
- Mode: Mode of the device Master or Slave
- Master: Acts as primary device applying the Master configurations.
- Slave: Acts as a Secondary device applying the Slave configurations.
This section shows the detailed information of a gateway device.
Click on GATEWAY DEVICES from the left-hand side menu of the homepage.
From the shown list click on the desired gateway device to see its
information. This consists of following options.
- Summary
- Devices
- Realtime Info
- Tools
Summary
Click on the Summary on left side menu on the homepage. Following details
show up for a gateway device.
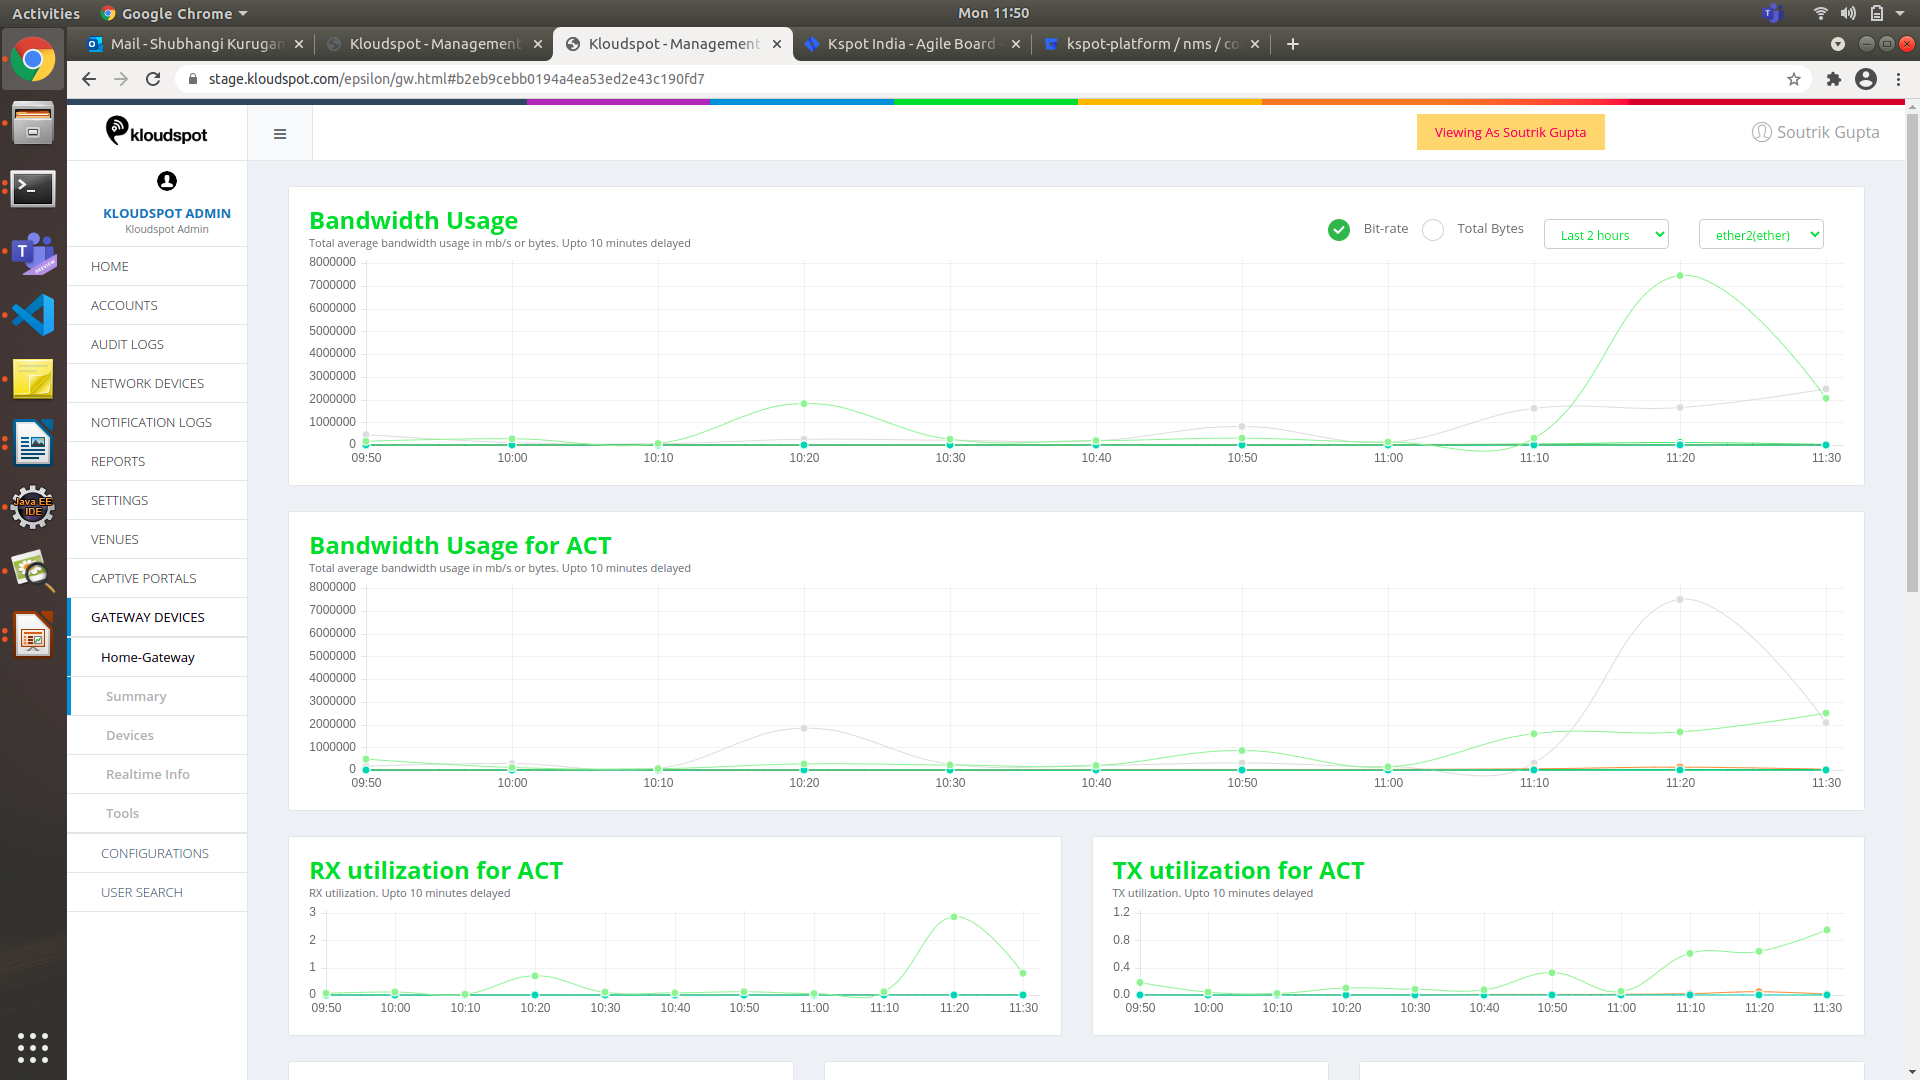 Figure 45- Summary of Gateway device
- Bandwidth Usage: Total bandwidth utilization can be monitored here. It also shows other data as the bitrate and total bytes. It also shows the statistics for specific time interval and according to the interface.
- Bandwidth Usage of ACT: Analysis of bandwidth utilization of each WAN link.
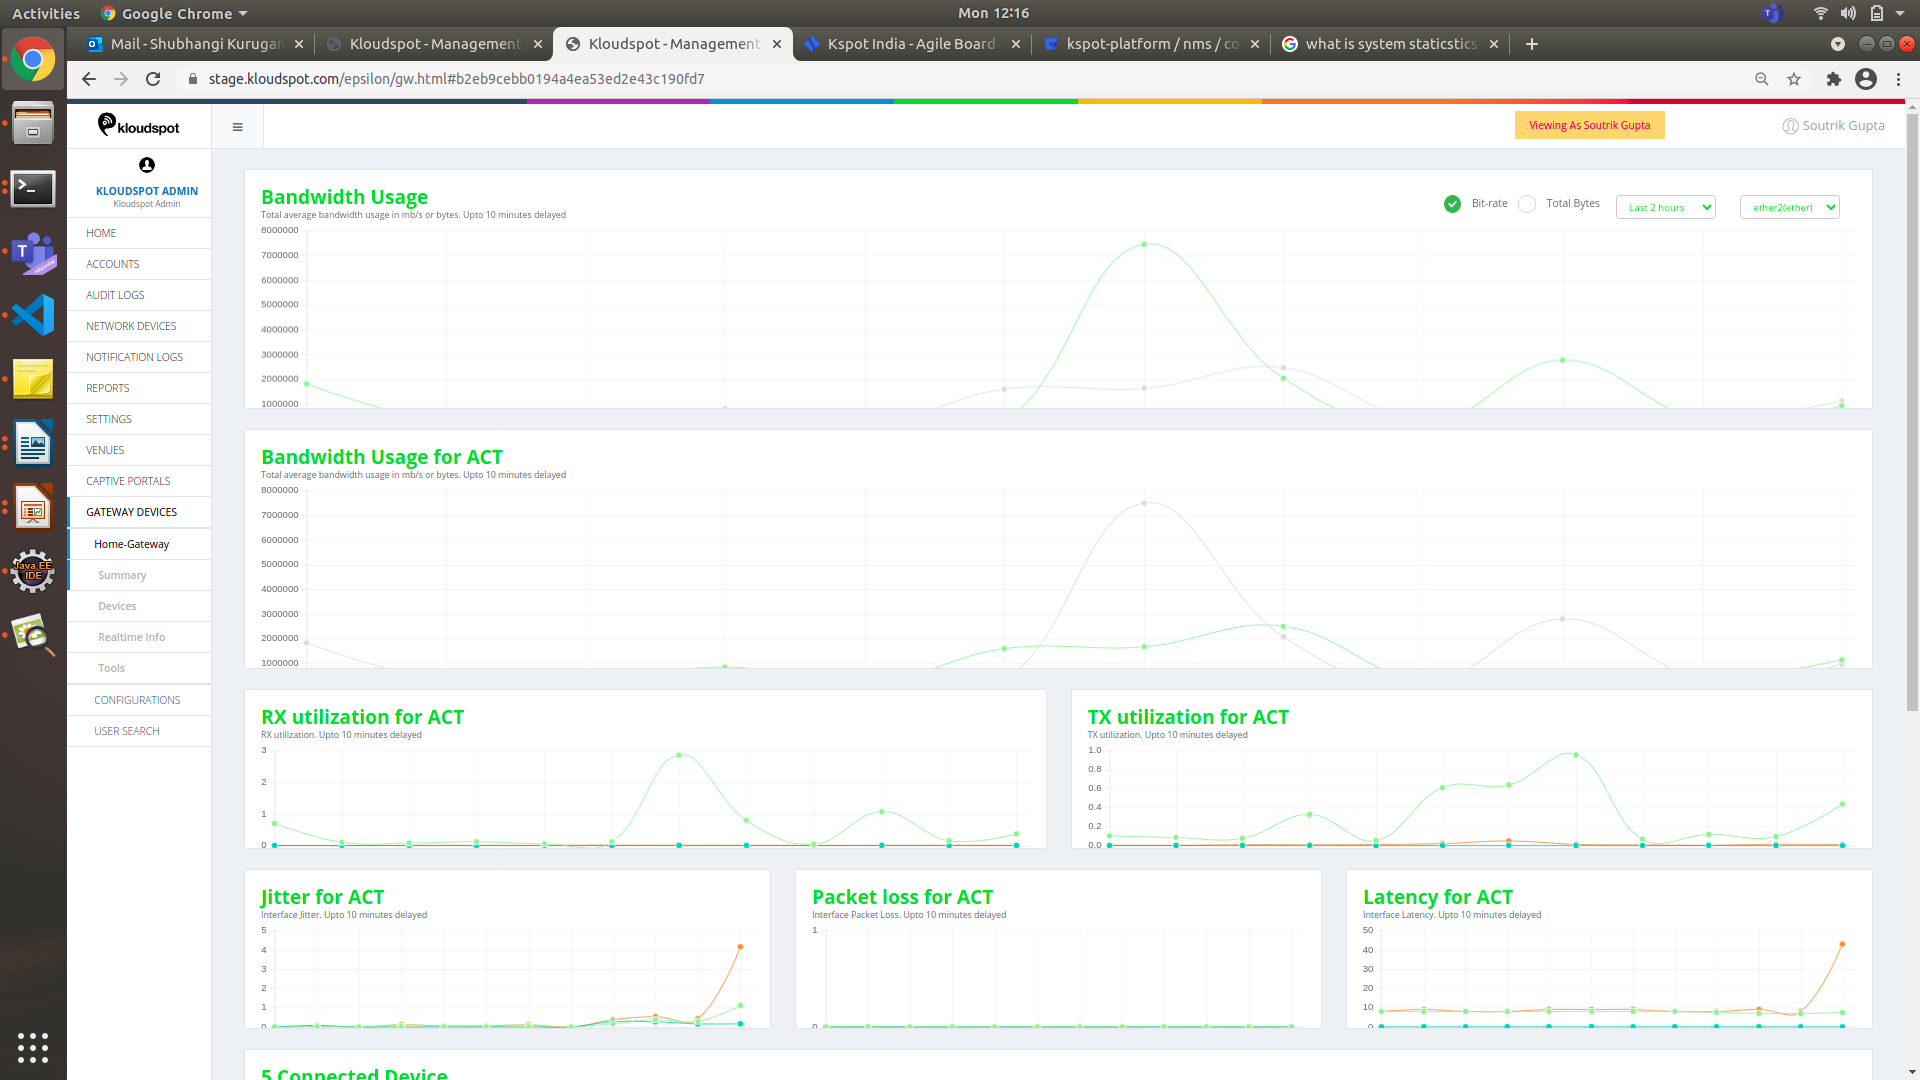 3. Jitter for ACT: This is the information on the time delay in sending the data packet over the network via a WAN link.
-
Packet loss for ACT: Information of whether any packets lost during the data transfer over a wan link.
-
Latency for ACT: This is the information on time taken for a packet to get to it’s destination.
Devices
Click on the Devices option from the left-hand side of the homepage. This
section gives detailed list of devices connected to the Gateway. The following
page opens which has information such as Mac address, IP Address, Last WLAN
and Last seen for the connected user.
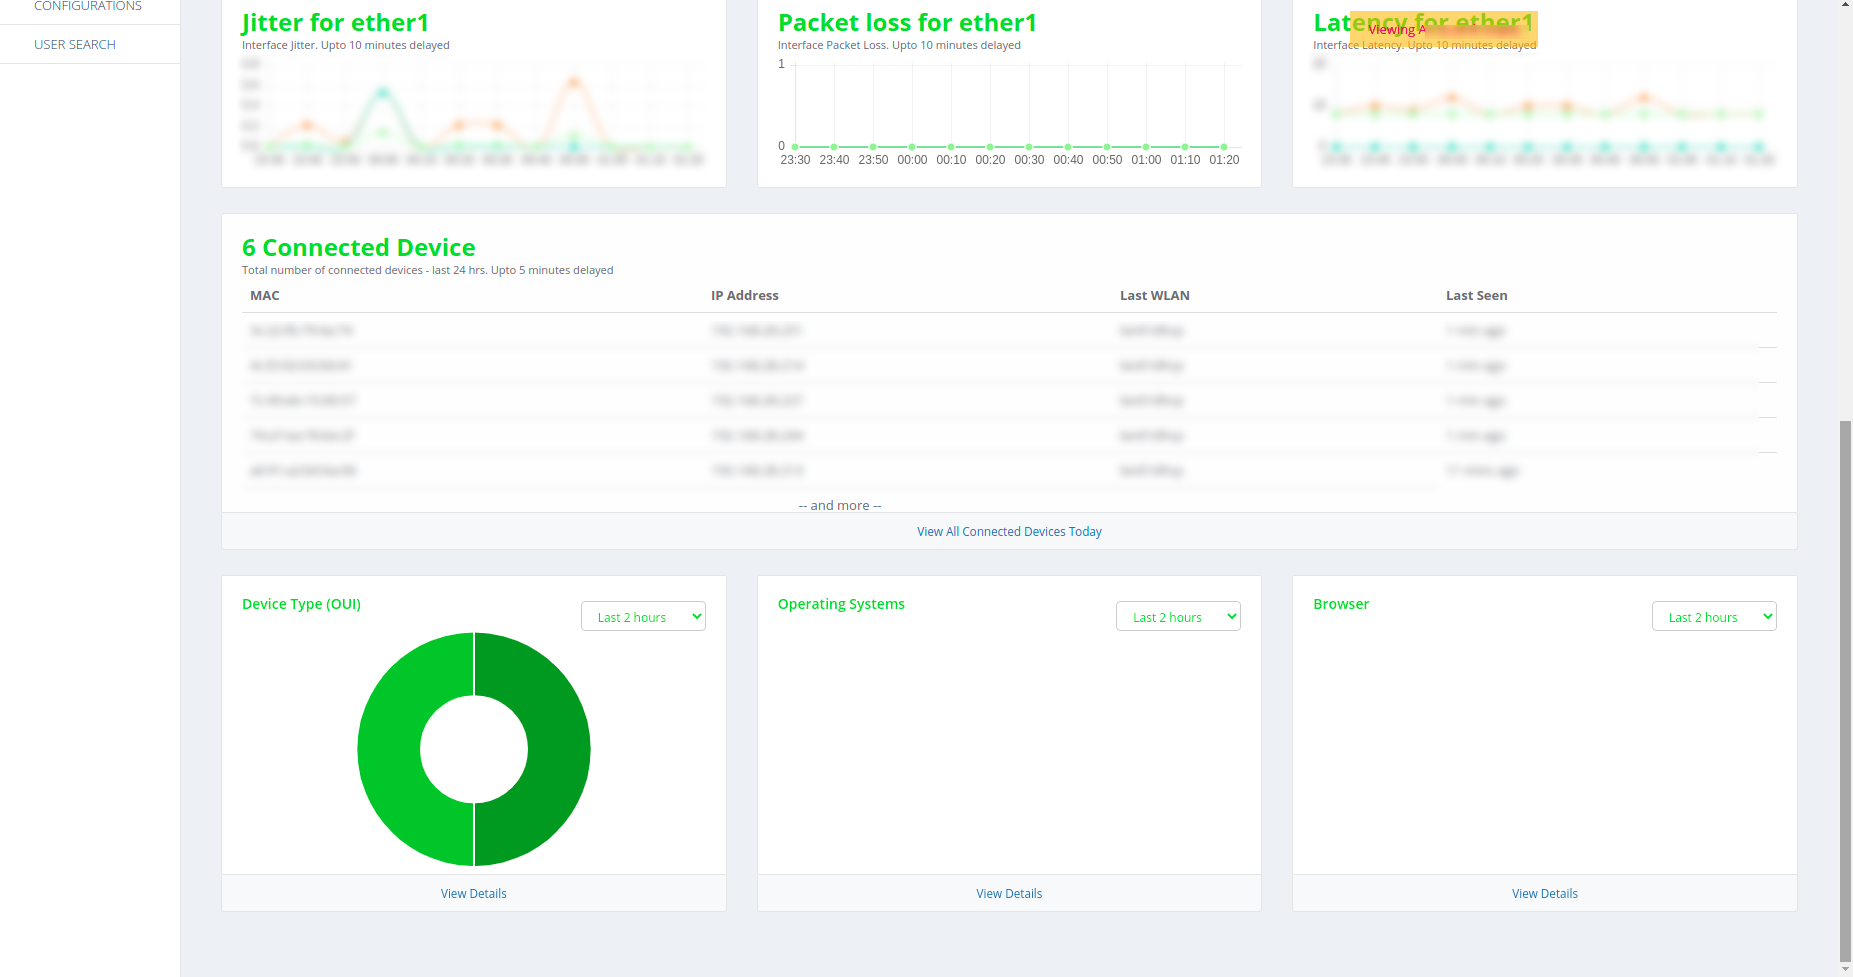 Figure 46-Devices page
Click on View All Connected Devices Today to see for more details. The
following page is displayed.
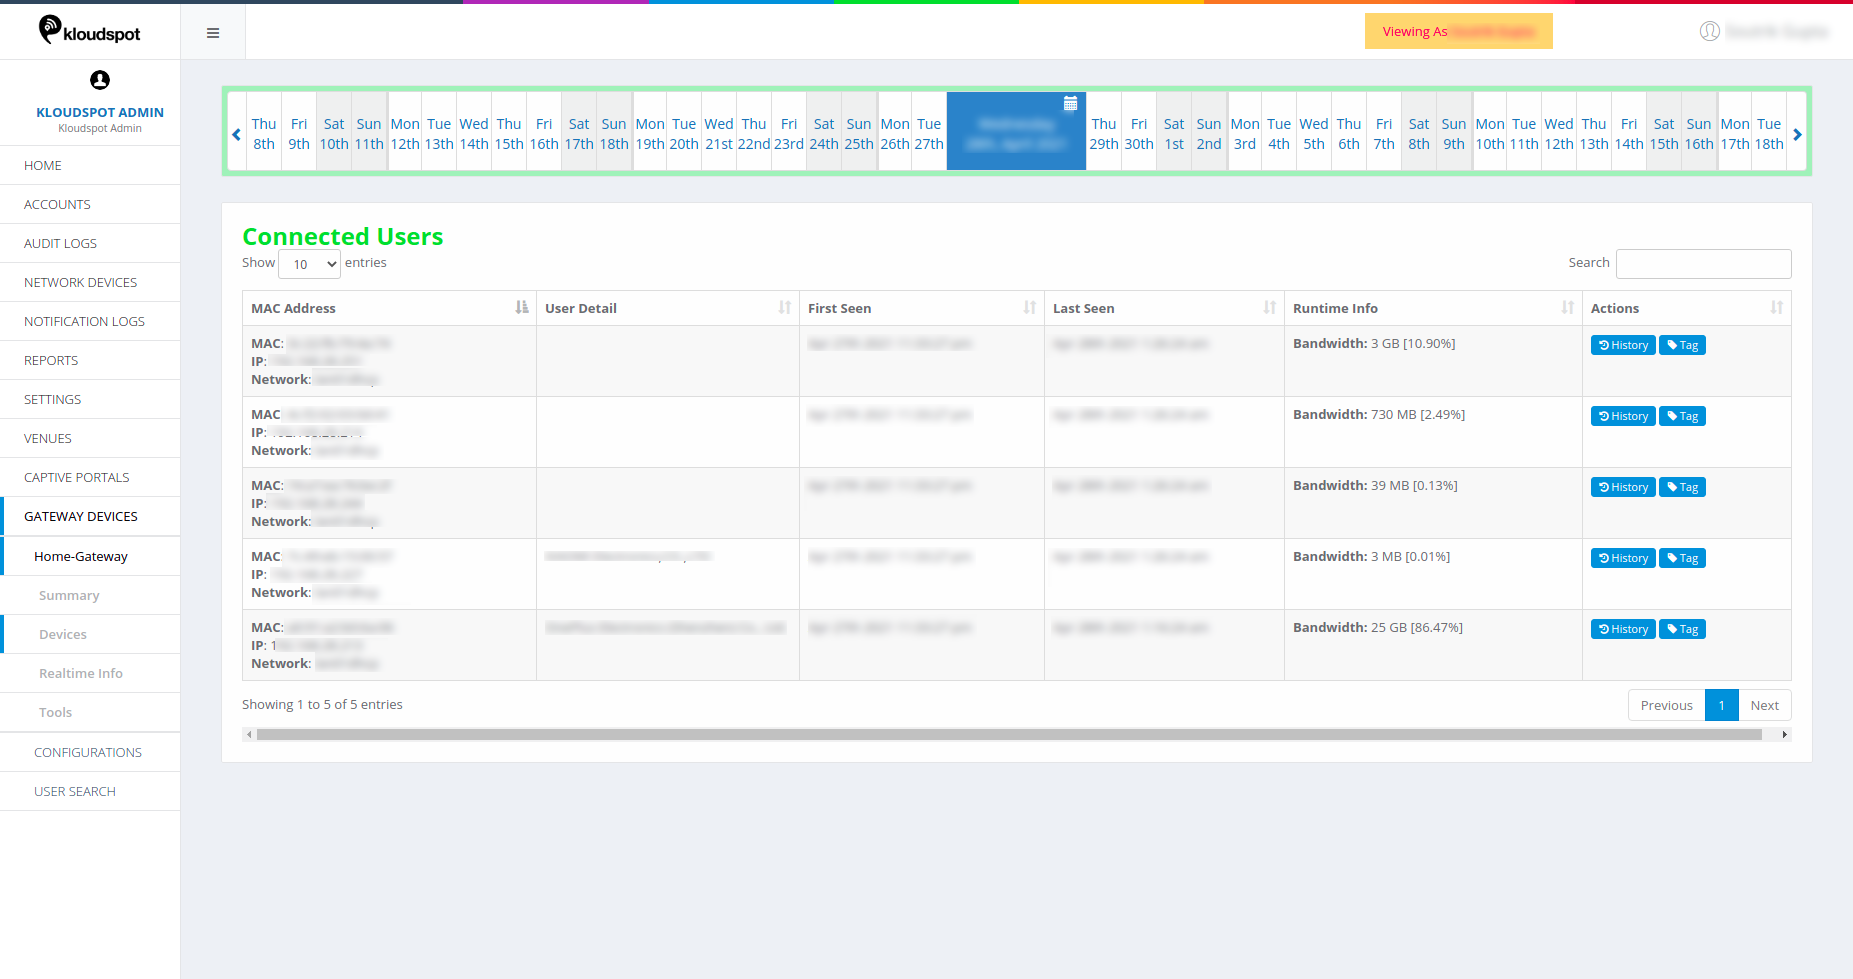 The list contains following information.
-
MAC Address: The MAC address of the device connected to the network.
-
User Detail: Details of the connected user.
-
First seen: Date and time when the user was first seen by the network.
-
Last seen: User last seen by the network.
-
Runtime Info: Shows information such as the bandwidth usage of the connected user.
-
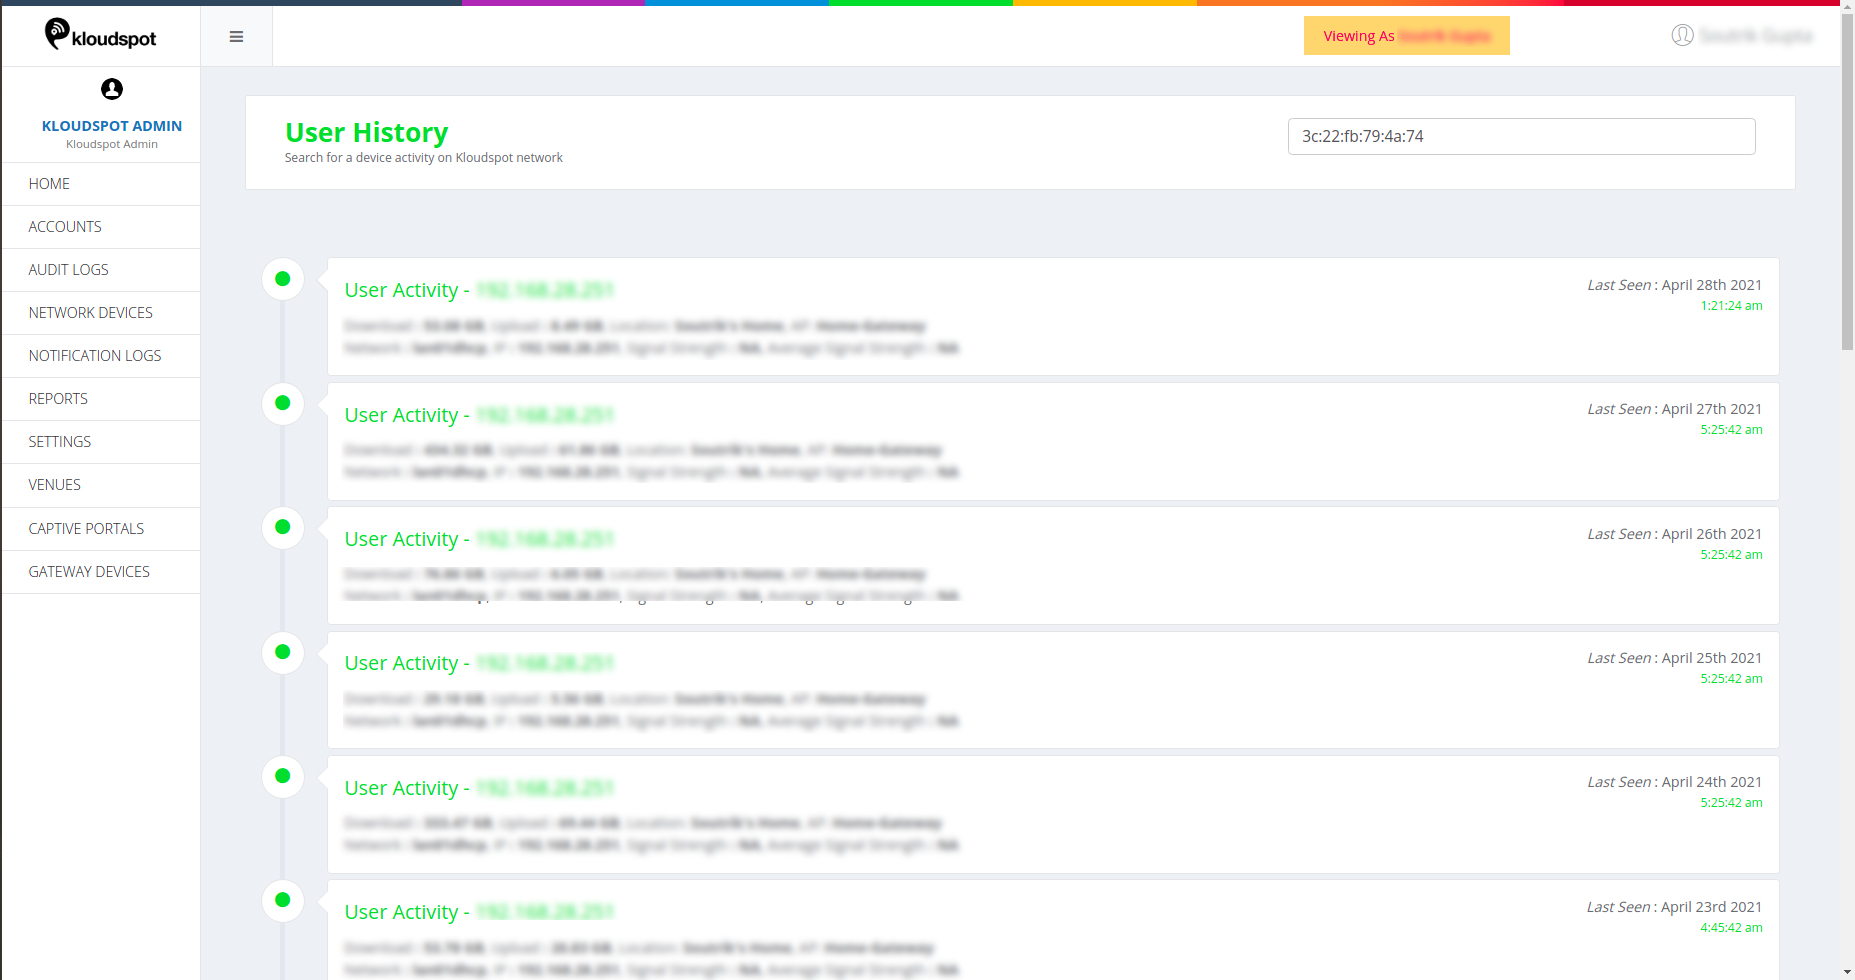
Actions: Actions to be specified for the user connected to the device. Tags can be assigned for easy identification of the user. History shows the detailed information of the user.
- Click on History and a page is displayed as below that shows all the activities of the connected user.
Realtime Info
Click on Realtime Info on the left-hand side of the homepage to see the
real time information of the devices connected to the network.
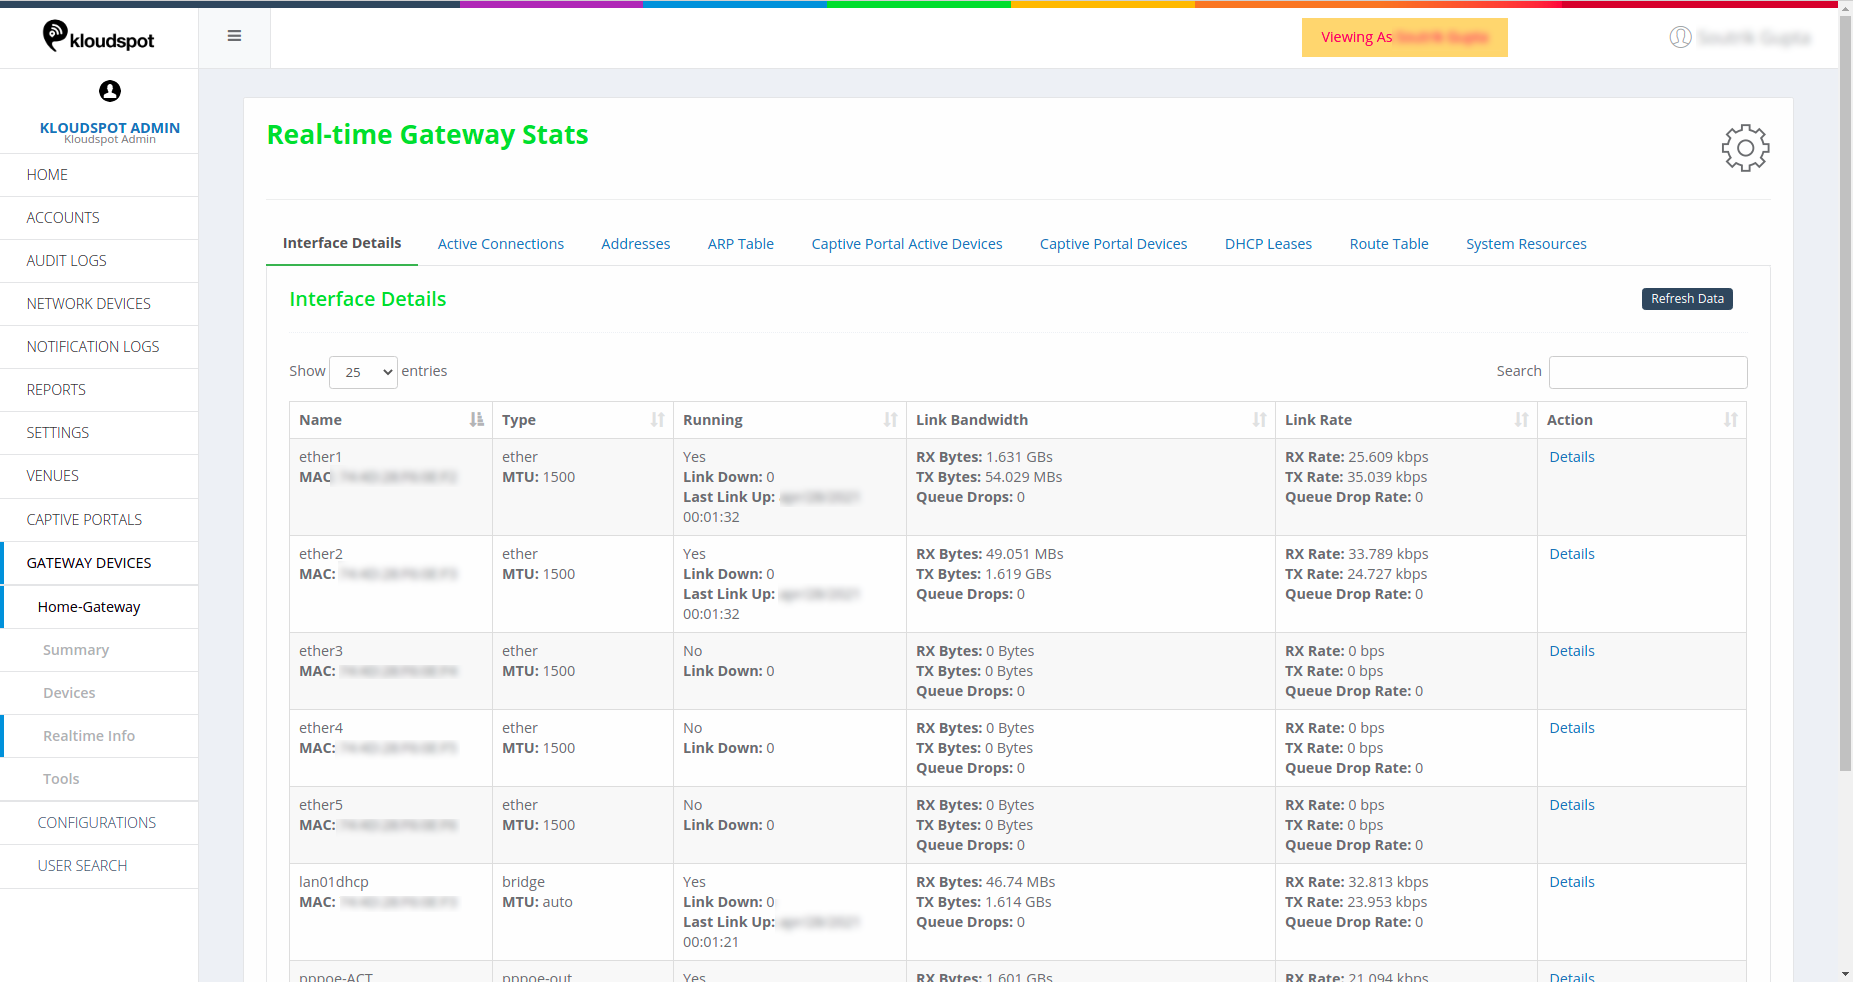 Figure 47-Real time info page
The information displayed is as follows.
Interface Details
- Name: Name of the interface and MAC address of the device connected.
- Type: Type of the interface and MTU (Maximum Transmission Unit).
- Running: Displays Yes if the link is up and running. Link Down shows the time if/when the link was down. Last link up shows the latest time when the link was up and running.
- Link Bandwidth: Information about the data Transmitted/Received in bytes.
- Link Rate: The speed at which the data has been Transmitted/Received.
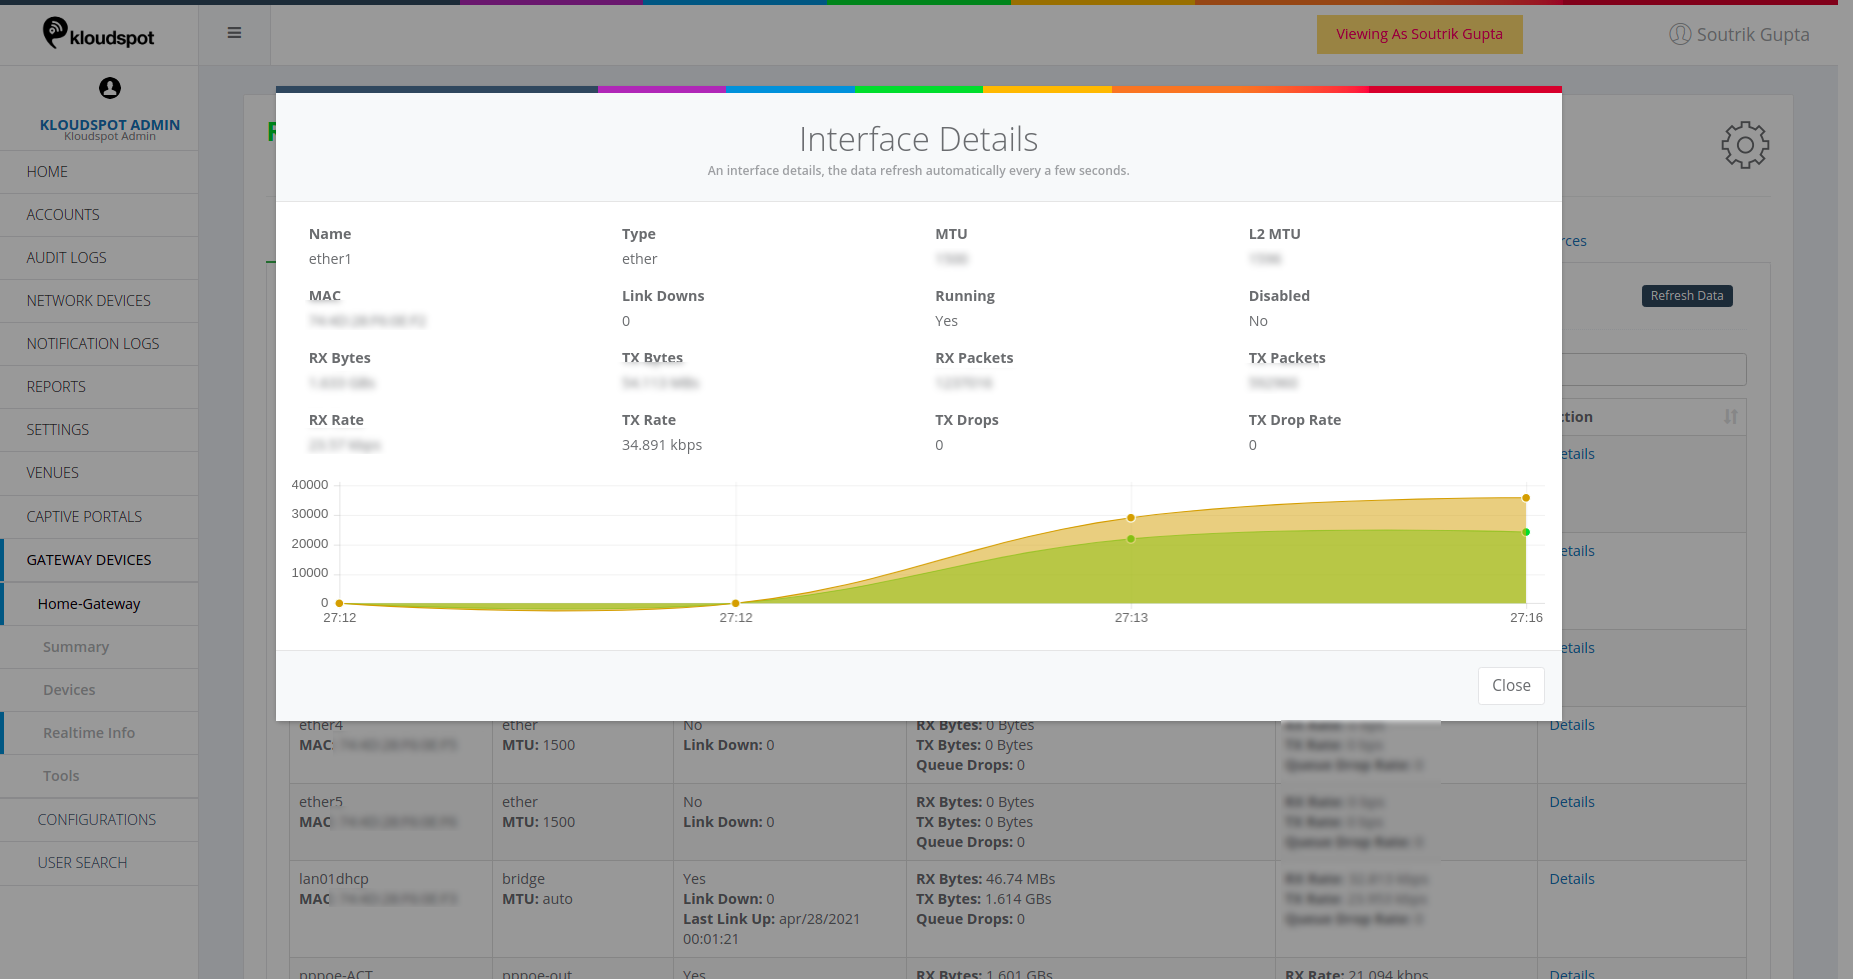
- Actions: Shows a graphical representation of the interface details as shown below.
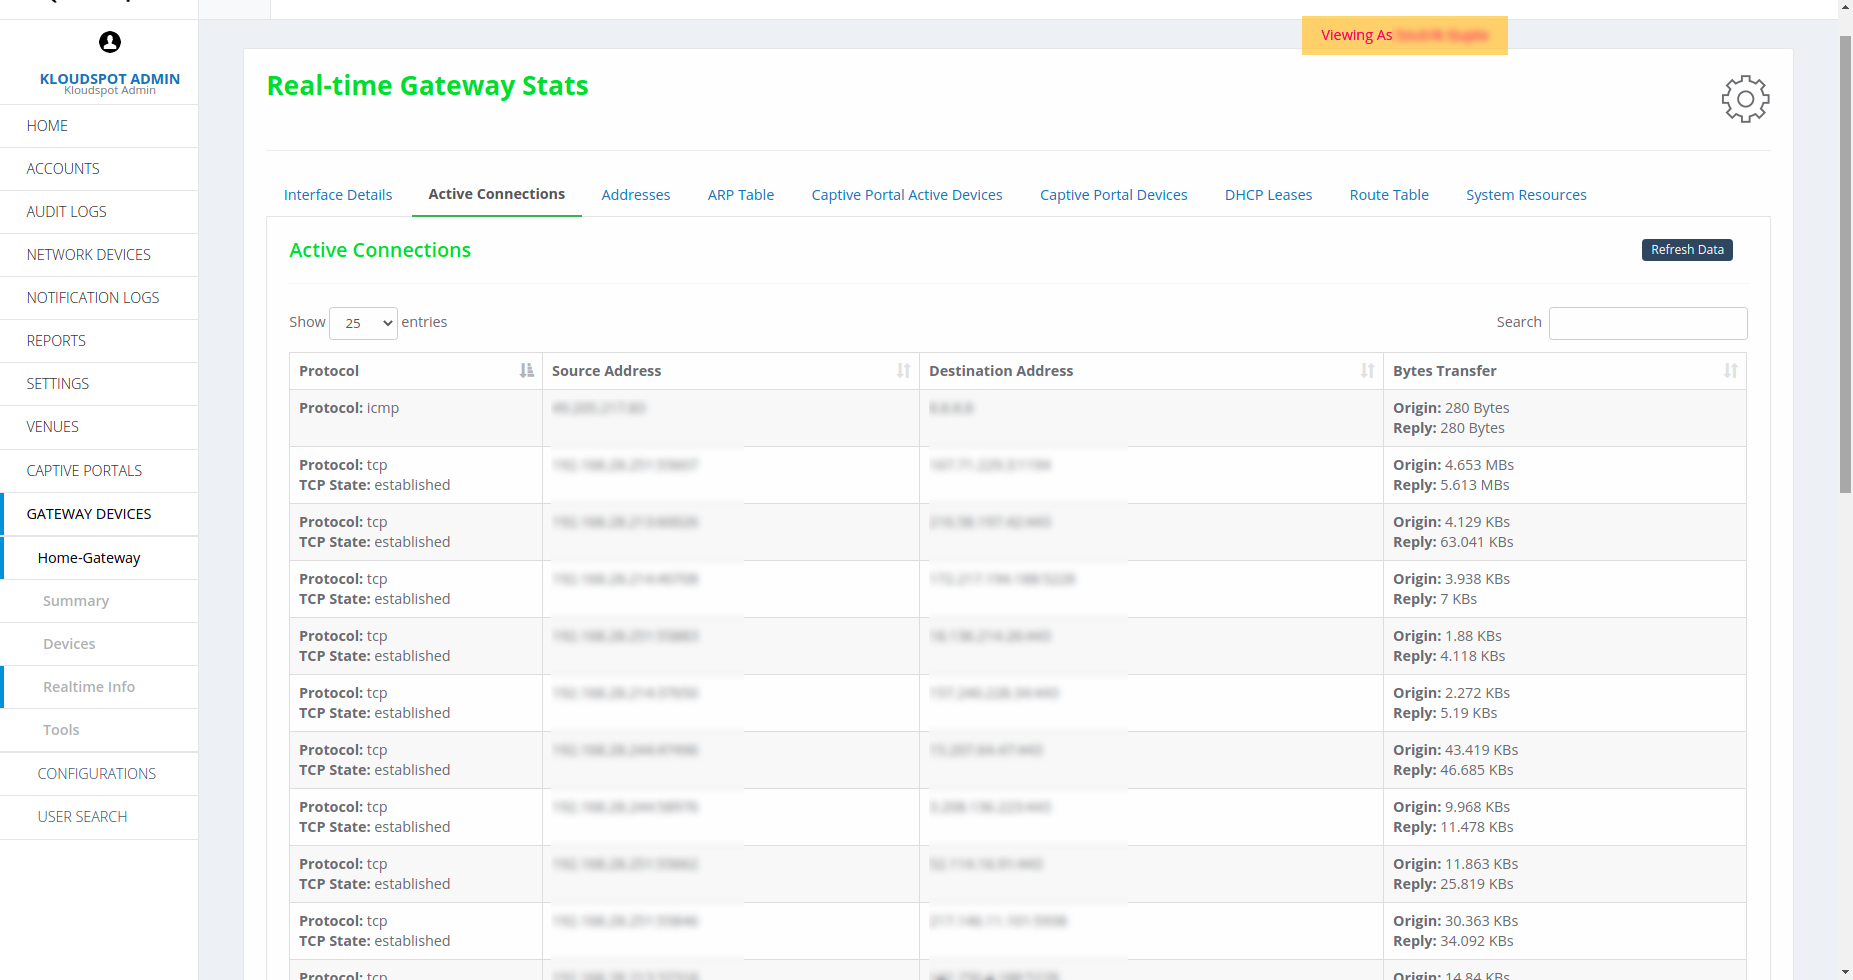
Active Connections
Active connections show the details of the tcp/udp connections. Source
address would be the origin address on the connection and destination address
would be the end address of the connection. Origin shows the bytes requested,
Replay shows the bytes sent.
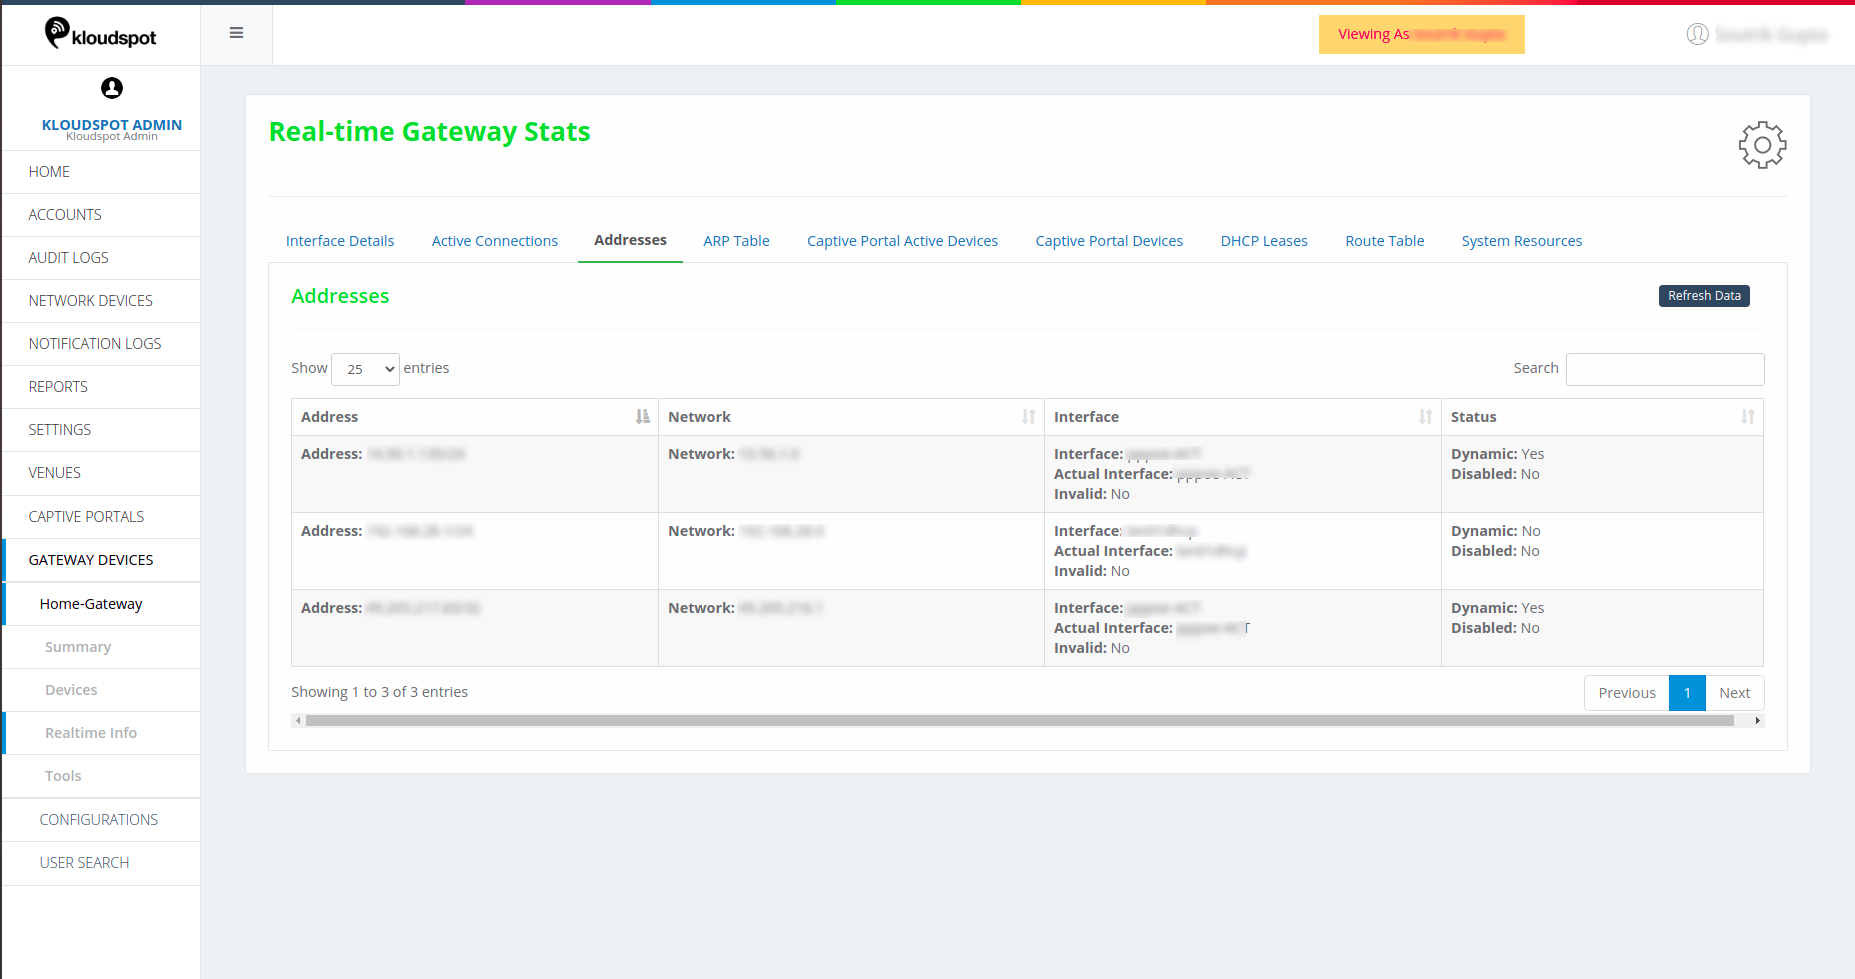
Addresses
Shows all the network associated addresses.
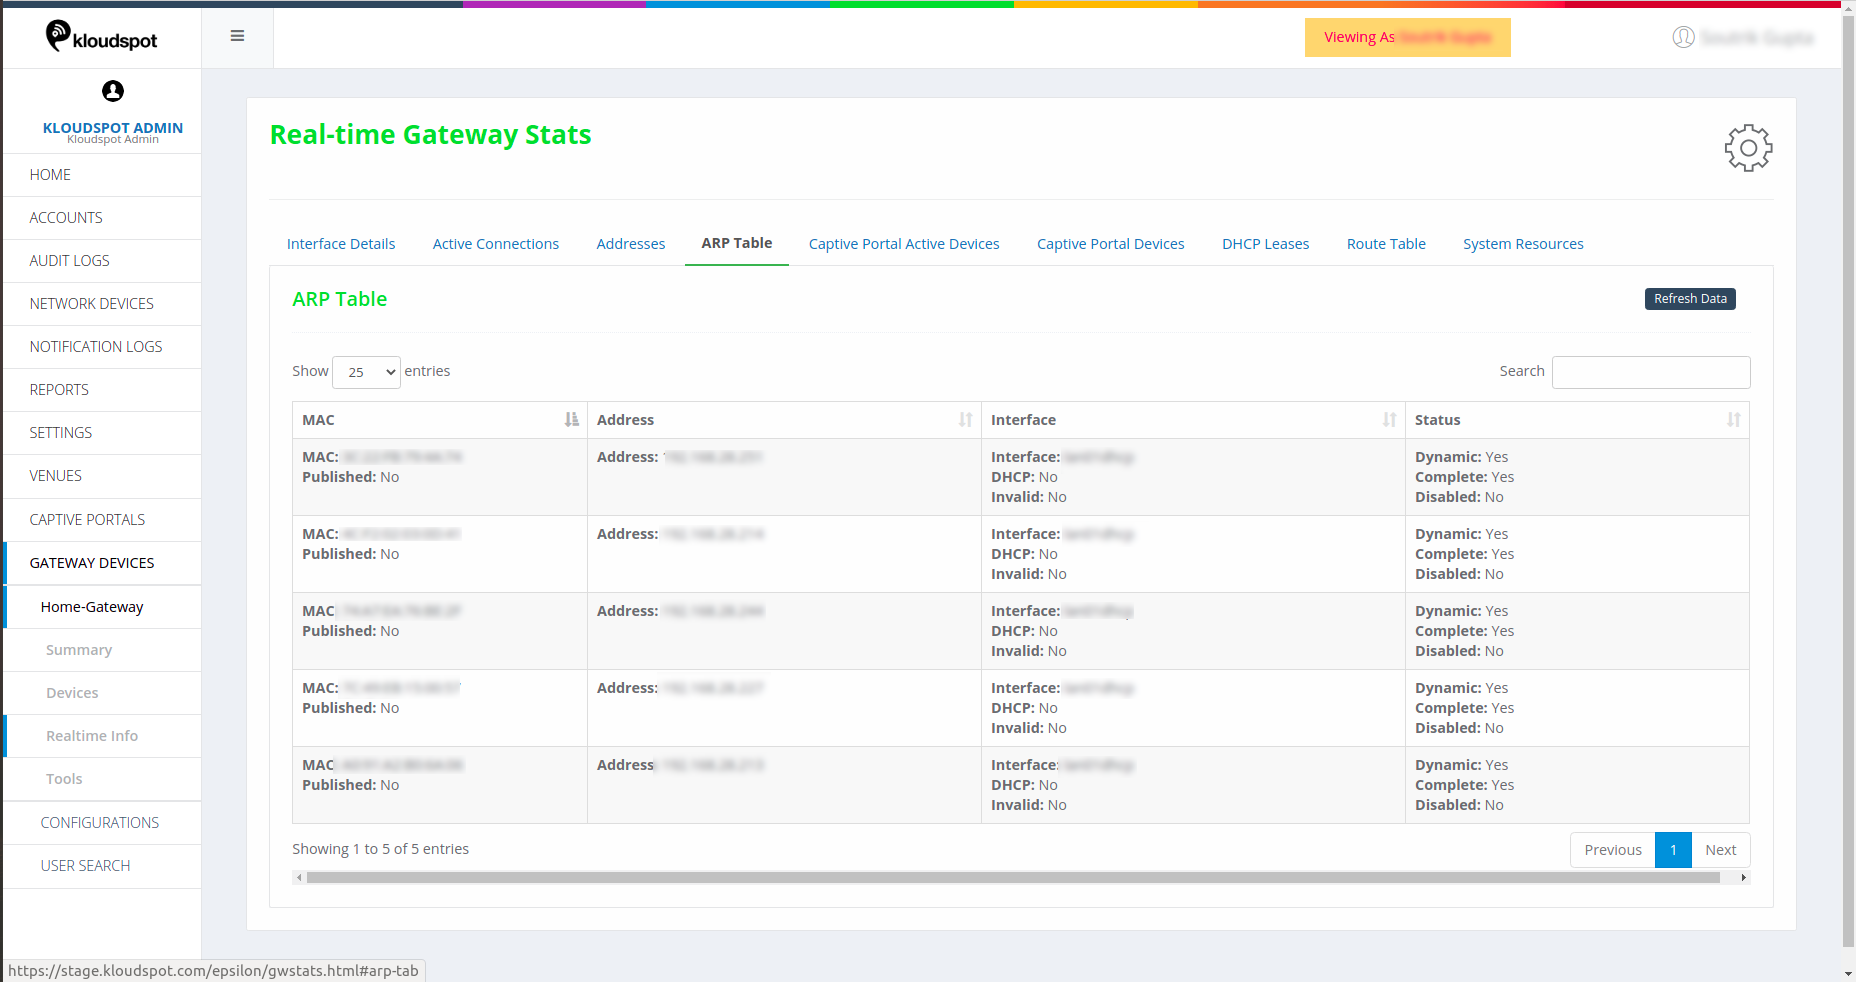
ARP Table
This shows the details of Address resolution protocol (ARP), including the MAC
address associated with the IP address. LAN details and status.
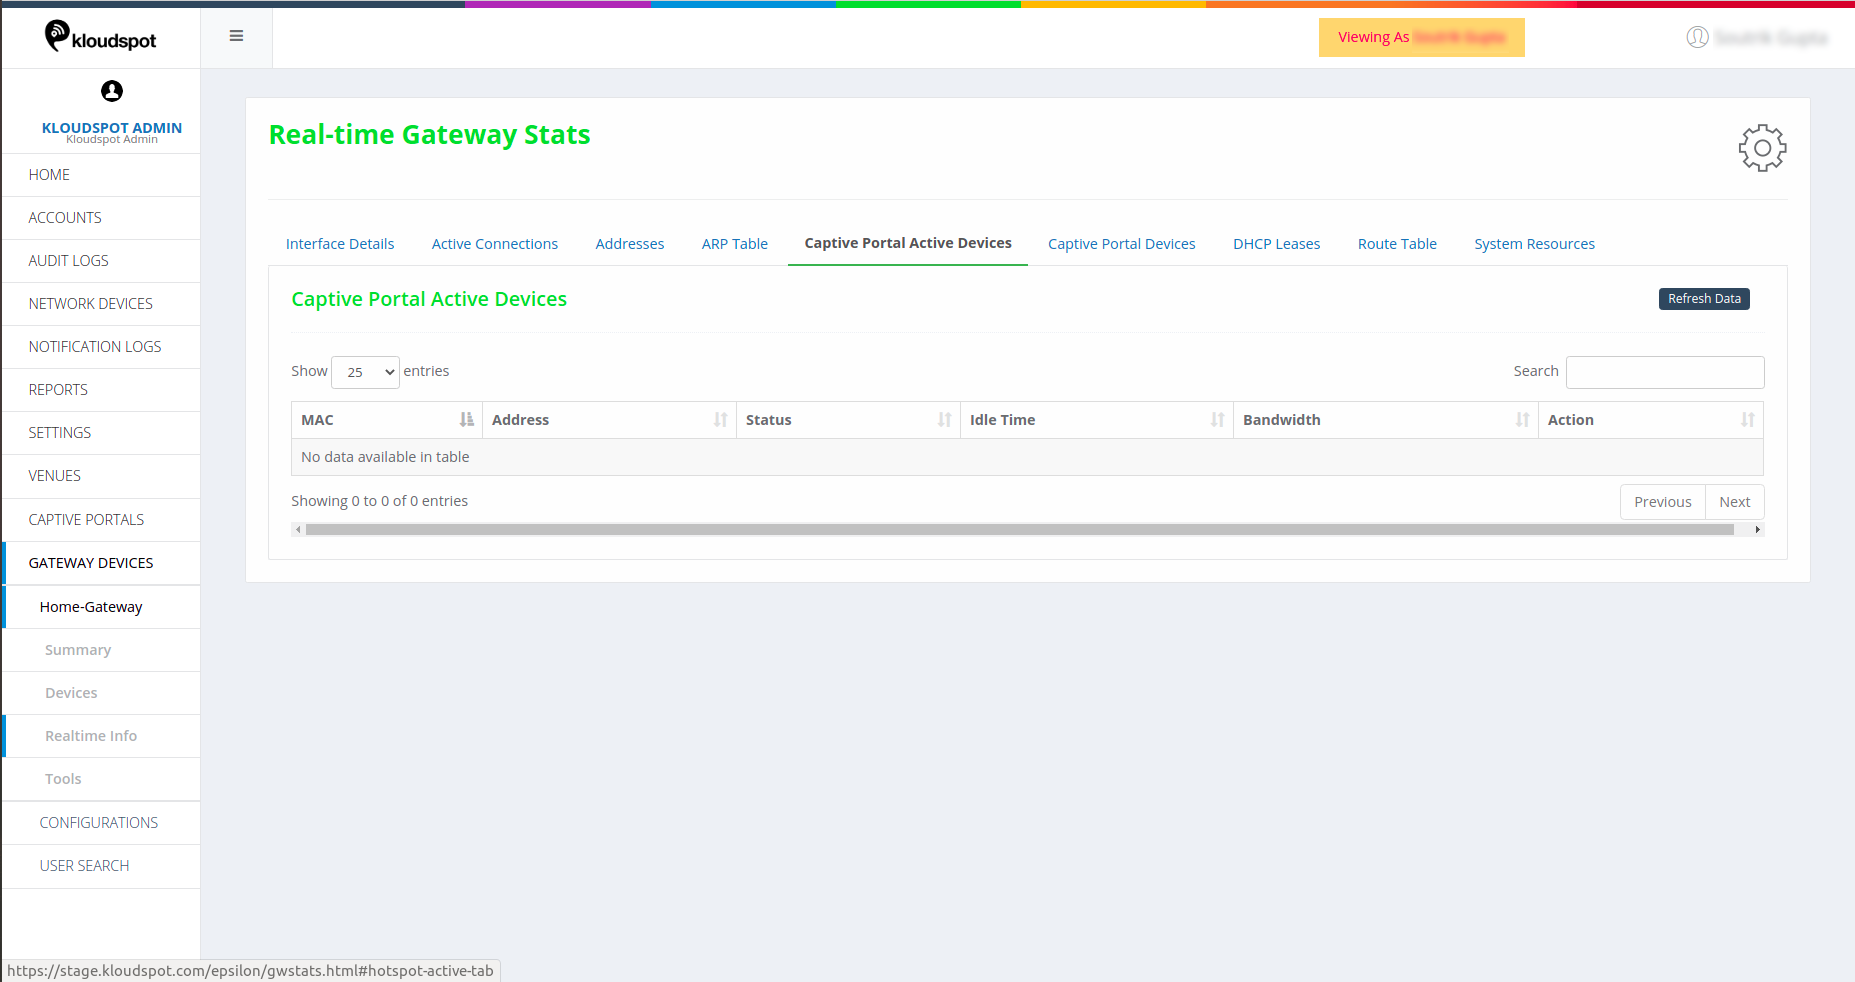
Captive Portal Active Devices
Captive Portal Active Devices shows the details of the devices that are
active and connected via the captive portal.
Captive Portal Devices shows details of all the devices (active and
inactive) that are connected via the captive portal.
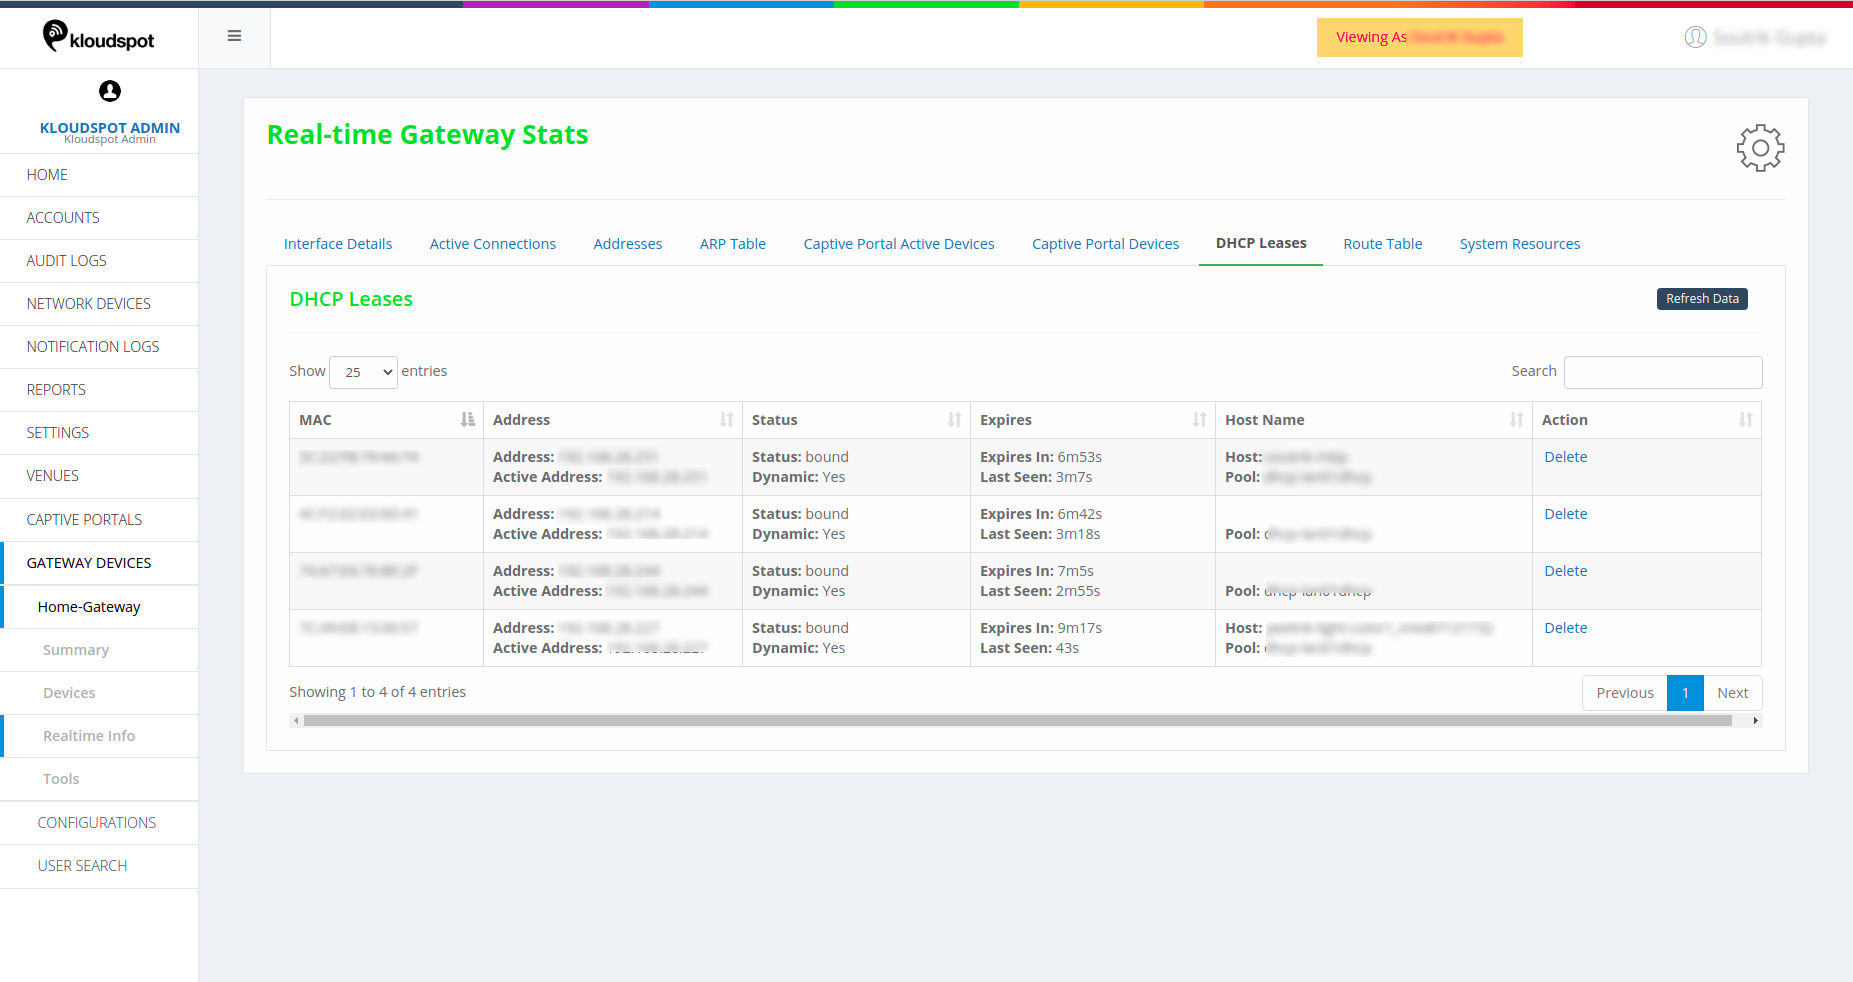
DHCP Leases
DHCP details of the network.
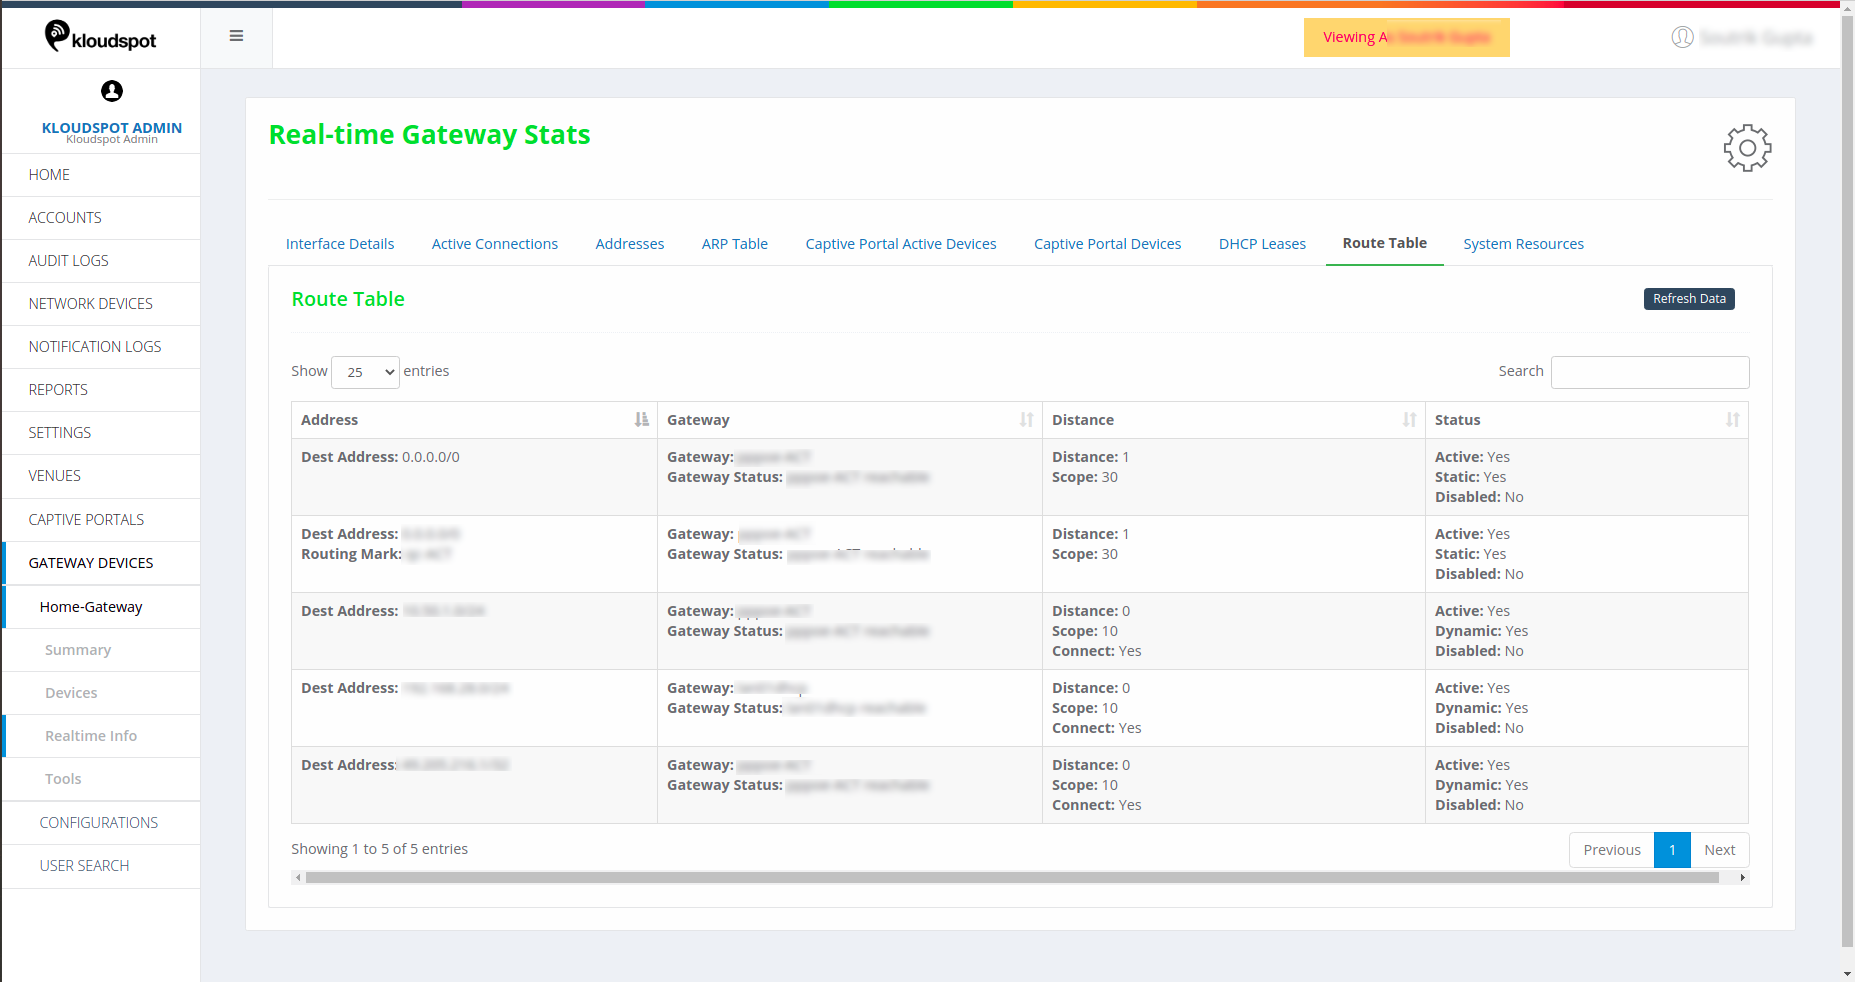
Route Table
Details of the routing table.
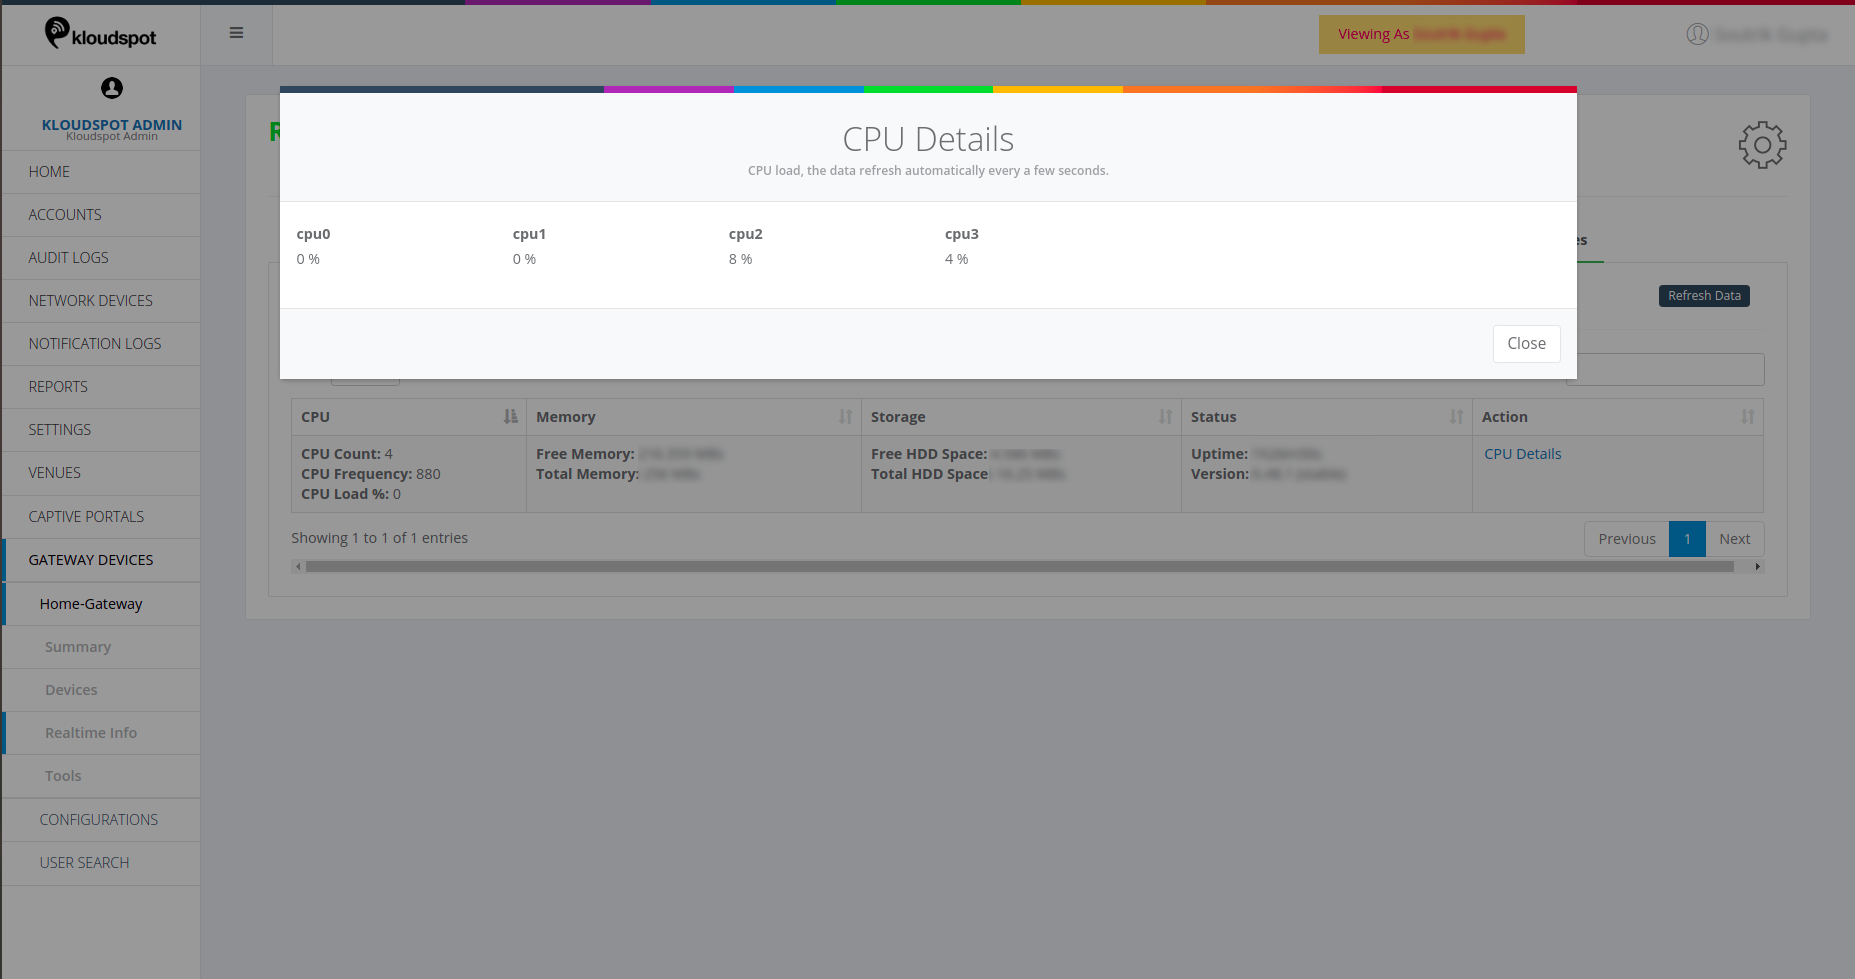
System Resources
This table shows the system information. This includes CPU details such as CPU
count, frequency, load percent. Memory details such as total & remaining
memory.
Storage Space information. Status shows version and up time indicates how long
the system has been up.
Clicking on CPU details gives load percent info as shown in below image.
Click on Tools from the left-hand side of the homepage options.
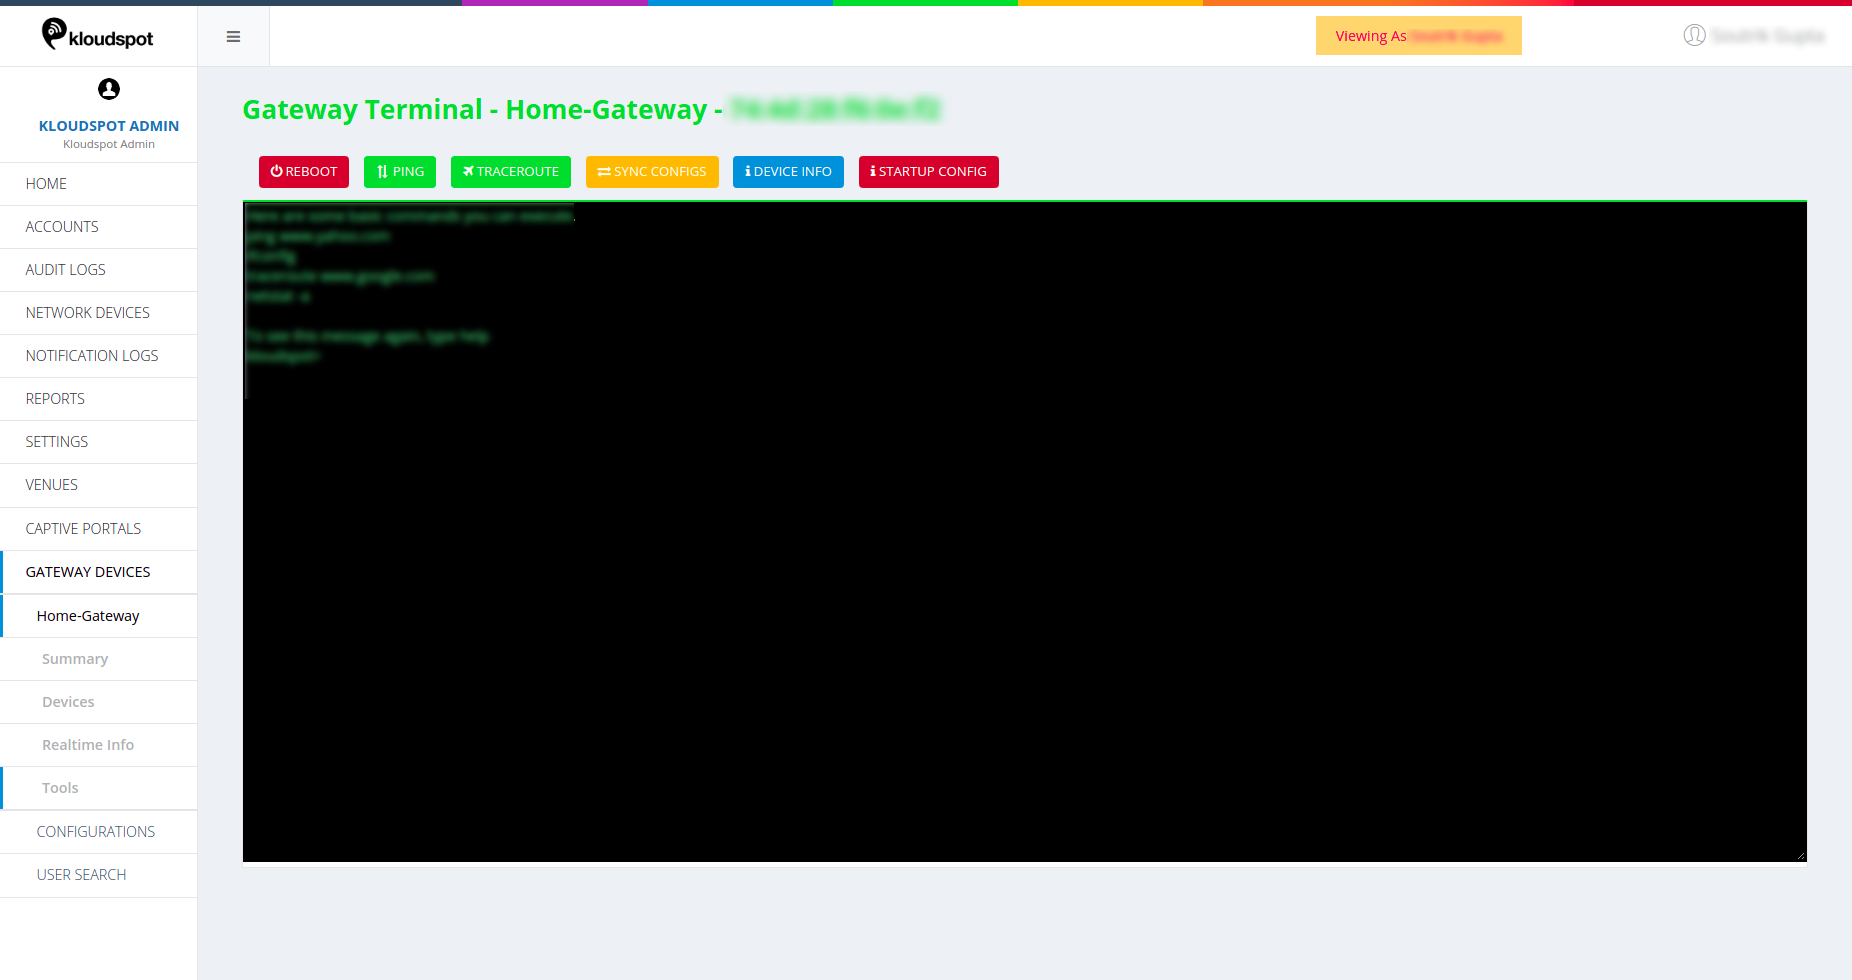 Figure 48-Tools page
- Reboot: Reboots/Restarts the device
- Ping: User can ping any ipaddress to get the details on the terminal. Clicking on Ping button shows the information of the current device.
- Trace Route: Click on this option or enter traceroute command to see the path details of the packet.
- Sync Config: Click on Sync Config to update the gateway configuration of the device.
On-Boarding Guide
Newly Procured Devices
Once you have your brand new Mikrotik Device, we need to first reset the configuration and remove any default configs.
Prerequisites:
Winbox Software – Download
[If you get a Prompt to allow the app through firewall, please select both
public and private network from the options]
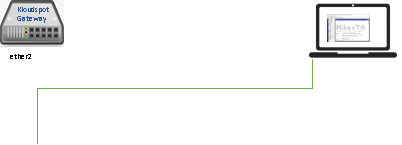
Connecting to Device for the first time:
Please connect the device to your PC in the following way –
Connect one end of Ethernet to Router port (ether2) and the other end to your
PC. Make sure your Ethernet configuration is set to obtain ip address
automatically.
 Once connected, open winbox software and click on the “Neighbours” tab. You
should be able to see a device. Click on the mac address of the device, Enter
username as “admin” and click on connect. The password on a new device is
usually empty.
Once connected, open winbox software and click on the “Neighbours” tab. You
should be able to see a device. Click on the mac address of the device, Enter
username as “admin” and click on connect. The password on a new device is
usually empty.
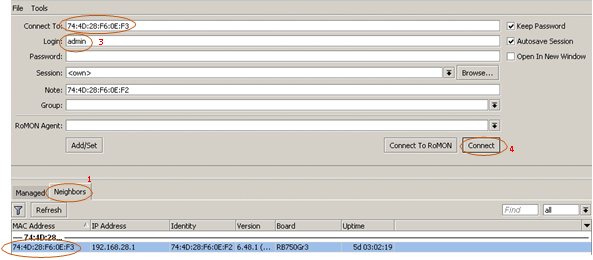
- Click on “Neighbors” Tab.
- You should see the device. Click on the mac address.
- Enter the username as “admin” you should be able to see the mac address on the connect to field.
- Click connect.
This should log you into the fresh Mikrotik Device. Please proceed to section
1.3 for Onboarding instruction.
Recovery of Existing Device
(We are going to reset the device to factory conditions. This will clean the
device and make it ready for installing Kloudspot software on the same.)
Warning
Please SKIP this section if you already have access to the device via winbox.
Follow this section in case your device is not responding, or the device is
stuck on an “Updating status” for a long time (more than 15 mins) and
Kloudspot Support is not able to access device.
It is recommended to have a Kloudspot Engineer on the call while performing
the steps as a link will be provided by the Engineer to activate device and
onboard to Kloudspot Platform.
Reset Gateway Device to Factory Condition :
- We will now reset the gateway in its factory condition. Please follow the instruction carefully:
- When router is powered on, press the reset button and hold for 30 seconds. (Use a paper clip or something sharp
- While holding the reset button pressed, unplug the power of the router and hold the reset button for 30 seconds
- While still holding the reset button down, turn on the power to the unit again and hold for another 30 seconds.
2. After performing this step, Please go to section 1.1 to see how to get
access to device using winbox for the first time.
3. After a reset is performed. The default IP (192.168.88.1) Should be
visible on the Winbox “Neighbors” tab and identity of the device should be
“Mikrotik”
4. If you see anything else, please try to reset the device once again.
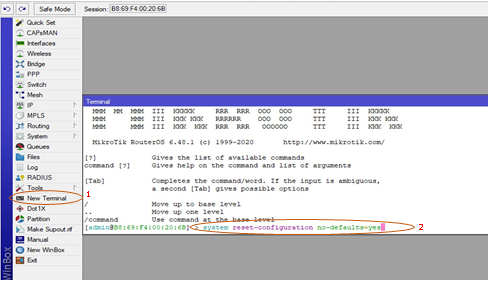
Removing Factory Default Configuration
- Once you are logged in through the winbox, please open the terminal window from the left menubar and execute the following command: “system reset-configuration no-default=yes”. It will ask you to confirm whether you are sure to reset. Press ‘y’ and then return/enter the key.
 2. The device will now reboot and remove all the default configuration. Once
device is booted, please log in back to the device using Winbox software.
(Please refer to. Section 1.1 on how to connect to the device via winbox. )
2. The device will now reboot and remove all the default configuration. Once
device is booted, please log in back to the device using Winbox software.
(Please refer to. Section 1.1 on how to connect to the device via winbox. )
Installing Kloudspot Software on Device
- Once the device is rebooted after cleaning and removing all existing configuration, we will now proceed to install the Kloudspot Software for Device management. For this step it is important to have a Kloudspot Support Engineer available so that he can enable the onboarding and help you with registration of the device on the License Server.
- Before Proceeding to this step, it is also recommended to add your device on the Kloudspot NMS with the WAN configuration and a basic LAN configuration. Make sure your device is assigned to a Gateway Configuration before you proceed with the next steps. Kloudspot Support Engineer might have already taken care of the configuration.
- Before we Proceed, we need to configure internet access on the Mikrotik Device for the first time. Please go through the steps below to configure internet access for the first time depending on the type of connection provided by your ISP.
Setting up WAN for the first time
Please use the correct configuration based on type of WAN provided by ISP:
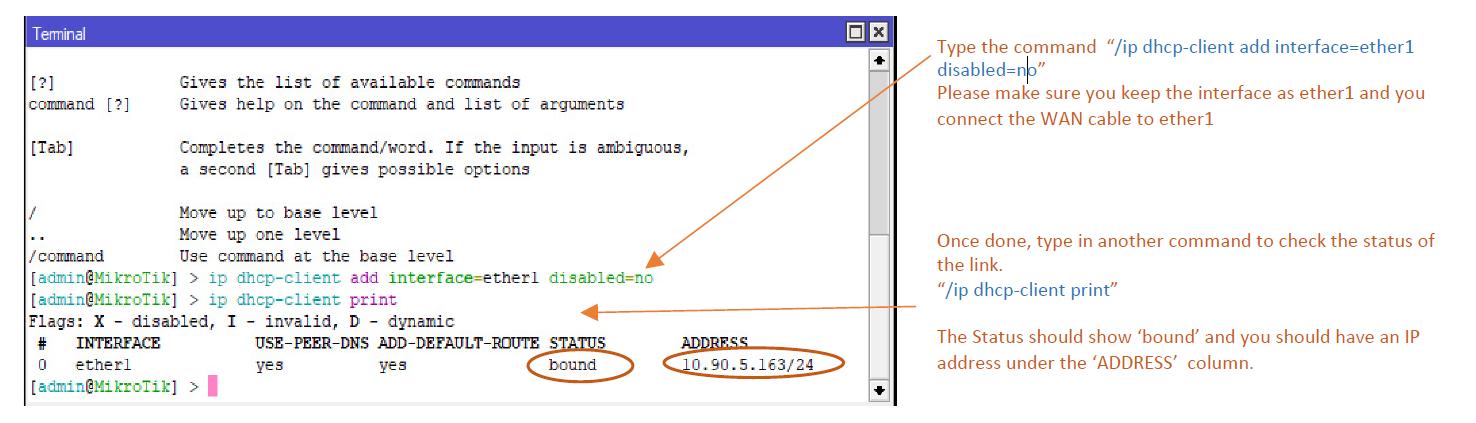
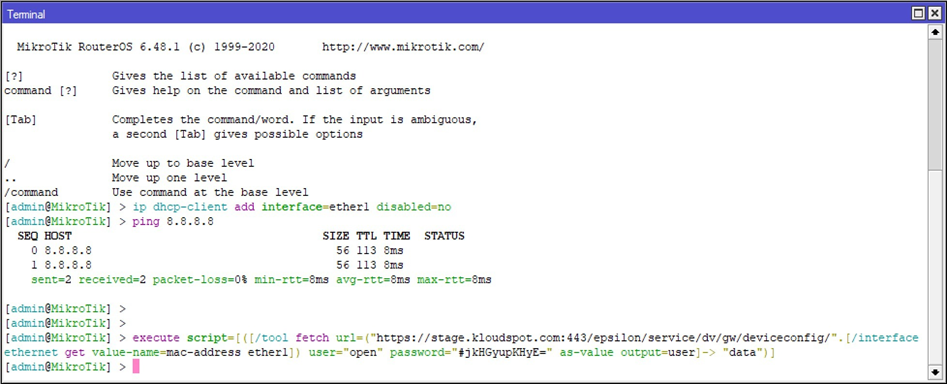
DHCP
- Use the following steps if your WAN connection type is DHCP.
- Connect to the device using winbox software. Click on ‘New Terminal’ and type the following command to add a dhcp-client.
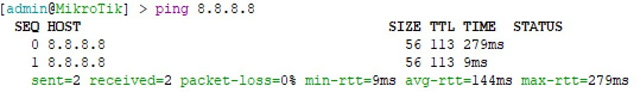
 3. You can check you have internet connection by typing “ping 8.8.8.8” and
see the reply. If you get replies like the following you should have internet
connectivity. Press ‘ctrl + c’ to stop the ping command.
3. You can check you have internet connection by typing “ping 8.8.8.8” and
see the reply. If you get replies like the following you should have internet
connectivity. Press ‘ctrl + c’ to stop the ping command.
 4. You can now proceed to 1.4.2 (Installing Kloudspot Software) to start
onboarding the device to Kloudspot Platform.
4. You can now proceed to 1.4.2 (Installing Kloudspot Software) to start
onboarding the device to Kloudspot Platform.
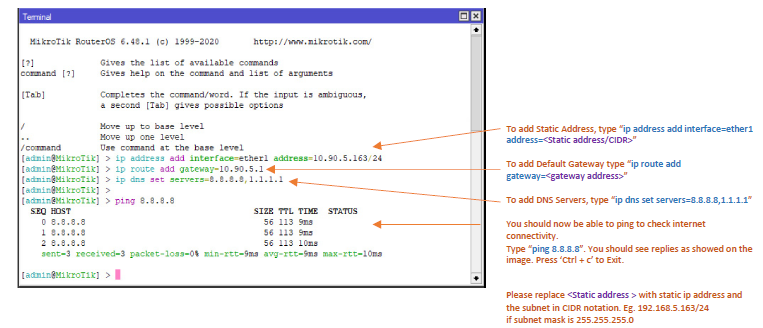
Static IP Address
- Use the following steps if your ISP has provided you with a Static IP Address, gateway and subnet-mask to get connectivity.
- Connect to the device using winbox software. Click on ‘New Terminal’ and type the following commands to add an address to the interface, set the DNS and have the default gateway configured.
 3. You can now proceed to 1.4.2 (Installing Kloudspot Software) to start
onboarding the device to Kloudspot Platform.
3. You can now proceed to 1.4.2 (Installing Kloudspot Software) to start
onboarding the device to Kloudspot Platform.
PPPoE Client
- Use the following steps if your ISP has provided you with a Static IP Address, gateway and subnet-mask to get connectivity.
- Connect to the device using winbox software. Click on ‘New Terminal’ and type the following commands to add an address to the interface, set the DNS and have the default gateway configured.
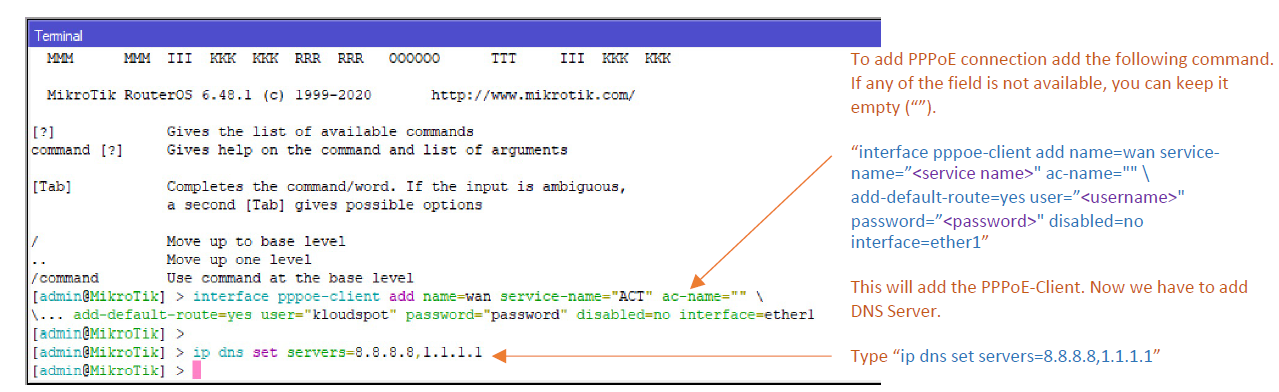 3. You can check you have internet connection by typing “ping 8.8.8.8” and
see the reply. If you get replies like the following you should have internet
connectivity. Press ‘ctrl + c’ to stop the ping command.
3. You can check you have internet connection by typing “ping 8.8.8.8” and
see the reply. If you get replies like the following you should have internet
connectivity. Press ‘ctrl + c’ to stop the ping command.
 4. You can now proceed to 1.4.2 (Installing Kloudspot Software) to start
onboarding the device to Kloudspot Platform
4. You can now proceed to 1.4.2 (Installing Kloudspot Software) to start
onboarding the device to Kloudspot Platform
Installing Kloudspot Files
- Once you have connectivity on your device, you should be able to start installing the Kloudspot Files on the Device. Please Get Activation Command from Kloudspot Support Engineer. We will use the activation command to start the installation.
- Open the terminal and enter the activation command on the terminal. It is recommended to Paste the command from Email.
 3. It should show nothing on the terminal. To Know the status, you need to
open log window from the left Menu Bar. Please refer to image below
3. It should show nothing on the terminal. To Know the status, you need to
open log window from the left Menu Bar. Please refer to image below
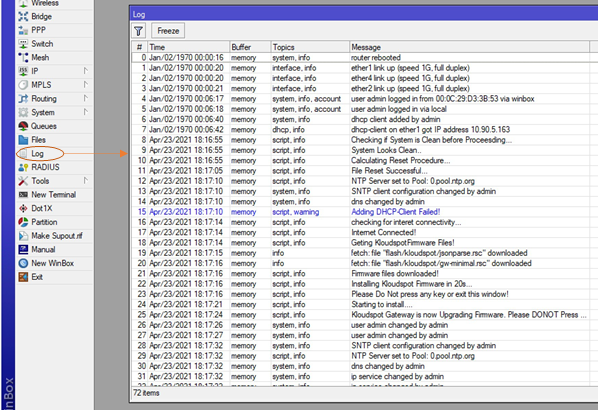 4. Please don’t press any Key. Once the files are downloaded, the device will
reboot automatically. You can then proceed to the NMS to check the device
status. It might take up to 10 Mins for the device to finish onboarding
process.
4. Please don’t press any Key. Once the files are downloaded, the device will
reboot automatically. You can then proceed to the NMS to check the device
status. It might take up to 10 Mins for the device to finish onboarding
process.
Verifying Onboarding
- Once the device reboots, you can go to the NMS and check the status of the added gateway device.
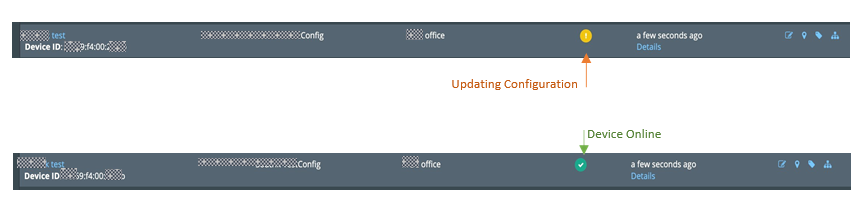 2. Once its green, Device will reboot once more to make sure all the settings
are applied correctly. Please wait for some more time.
2. Once its green, Device will reboot once more to make sure all the settings
are applied correctly. Please wait for some more time.
3. You can go to the device ‘real time‘ information tab to check if the
device is back online. Please wait for few seconds and try again in case you
get any error.
Gateway Alerting
This document gives detailed information and functionality of the alerts and
notifications feature incorporated in the Kloud Gateway.
Alerts: Alerts are tasks that continually monitor active queries to look
for and report on specific events or conditions depending on the criteria we
set. When the conditions of the alert are met, an alert notification is
triggered.
Notifications: Notifications are simple messages generated by the system
when certain events have occurred within.
Getting started
Log into the NMS portal with user credentials.
 Fig 1: NMS login page
Alerts
Following are the fundamentals to set up alerts. Alerts are generated at
constant intervals of time.
- Make certain prerequisites to enable alerts in the system.
- Define the threshold for the alerts.
- Specify contacts to send the alerts.
- Send the notification for the alerts.
How to set up alerts?
Steps
Referring to the figure below, set up the alerts.
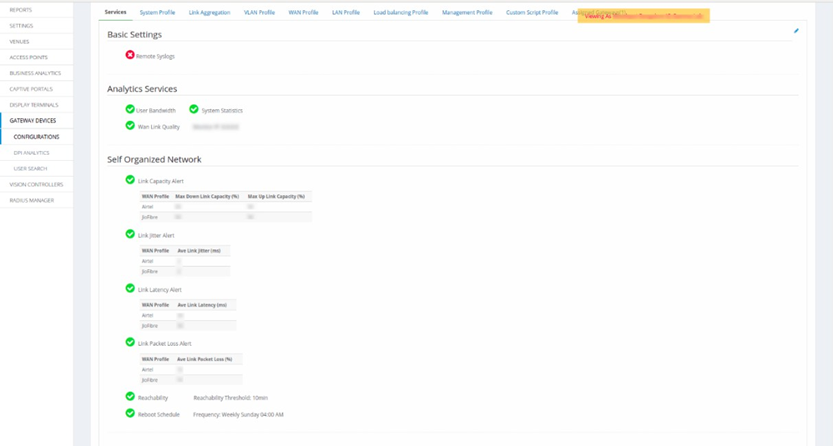 Fig 2: Gateway Configuration page
- Click on the Configurations option under Gateway Devices.
- Services tab will be open by default.
In Analytics Services, enable the ‘WAN Link Quality’ box to check the quality
of the specific WAN link and enter an IP address in the ‘Monitor IP’ box
to get alerts for the WAN.
3. Self-Organized Alerts:
a. Link Capacity Alert: Enable this option to get an alert on the capacity of
the link. Select a WAN profile and define the Uplink and Downlink capacity.
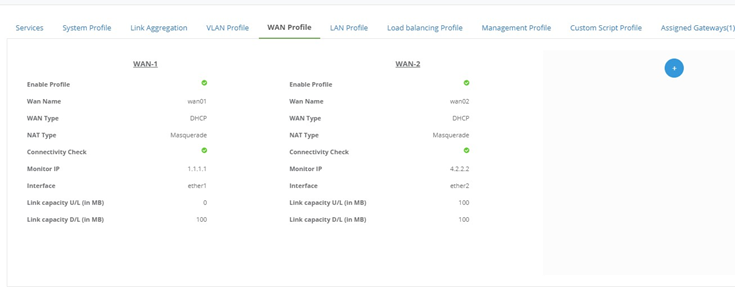 Fig 3: WAN profile page
b. Link Jitter Alert: Enable this option to get an alert on the Jitter on a
link. Select the WAN profile and define the average jitter in milliseconds.
c. Link Latency Alert: Enable this option to get an alert on the latency of
the link. Select a WAN profile and define the average link latency in
milliseconds.
d. Link Packet Loss Alert: Enable this option to get an alert for a link in
case of packet loss. Select the WAN profile and define the average percentage
of packet loss on the link.
e. Reachability: Enable the option to send an alert in case the device is not
active for the pre-defined threshold time.
f. Reboot Schedule: Enable this option and set a frequency to send an alert if
a reboot on the device is to happen at the pre-defined time and day.
Alerts are available at different levels within the portal.
- Audit logs: Alerts can be seen on the left-hand side of the homepage, in the Audit Logs option in Alert logs.
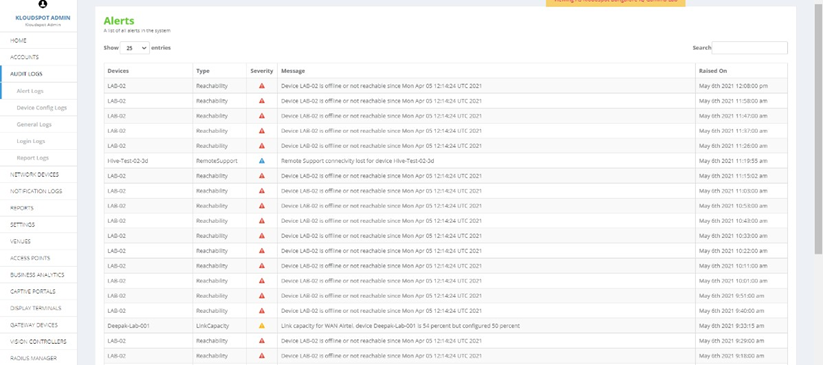 Fig 4: Alerts Logs Page
2. Venues: Alerts are also seen in the VENUES option. To see the alerts,
on the left side of the homepage, click on VENUES and select the desired venue
(for example: BangaloreLab) and click on the Alerts option below.
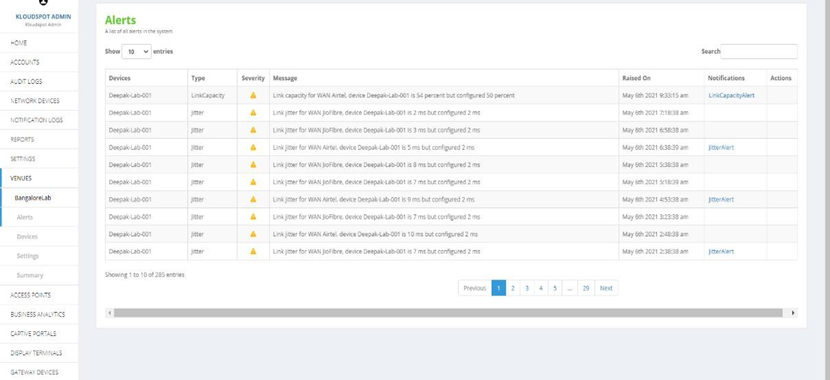 Fig 5: Alerts Page in VENUES
3. Gateway Devices: Alerts can also be seen on individual device level.
On the left side of the homepage, click on GATEWAY DEVICES, select and click
on the desired device and click on the Alerts option below.
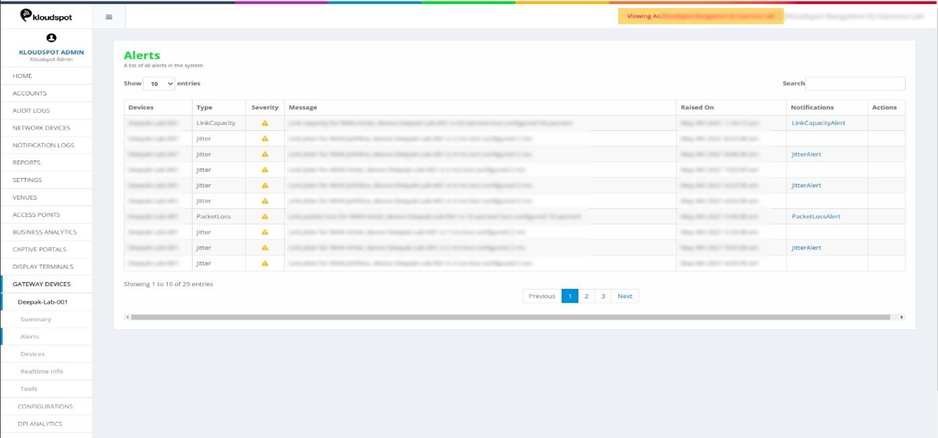 Fig 6: Alerts page in GATEWAY DEVICES
Notifications
Notifications are the messages sent out of the NMS to the respective contacts
in case of any action takes place within the system.
Set up Alert Notifications:
- In the Settings tab, go on to Alert Notifications. Click on +Add notification to add notifications as shown in fig below.
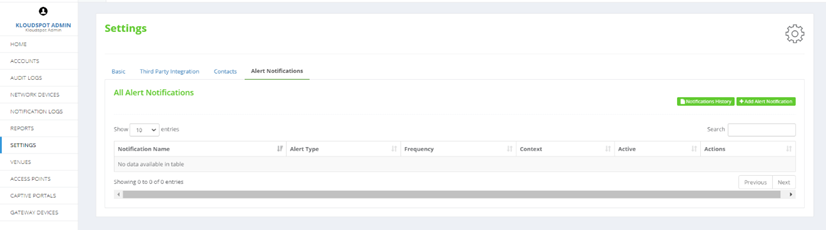 Fig 9: Alerts notifications page
2. In the Alert Notification tab, fill in the required information.
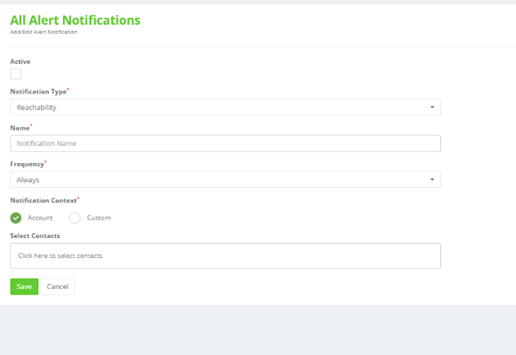 Fig 10: Adding Alert Notification
a. Active: Enable this option to activate the notifications.
b. Notification type: Select the alert type you want the notification message
for.
c. Name: Enter a name for the Notification type.
d. Frequency: Define the time intervals for which the notifications will be
sent out.
e. Notification Context: Choose Account option or click on Custom option to
choose from multiple venues and floors.
f. Select Contacts: Choose from the contacts added to the system to which the
notifications will be sent.
g. Click Save.
3. Added notifications can be edited by clicking on
 shown in figure below.
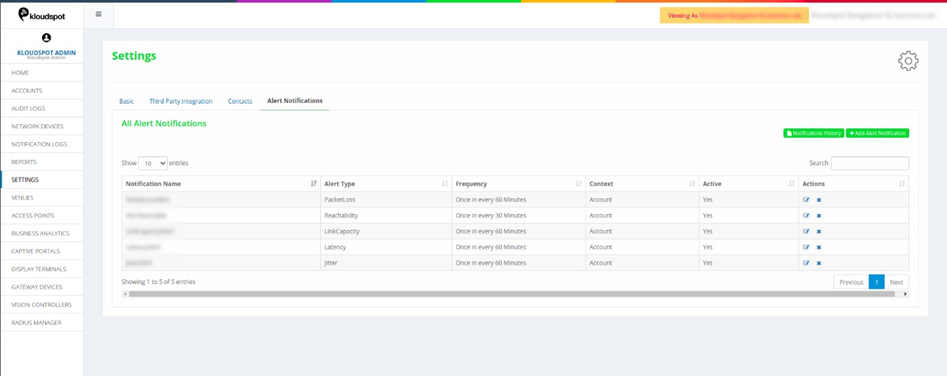 Fig 11: Edit/Delete Alert notification
Types of Notifications available:
Notifications can be seen in the Notifications logs on the left-hand side of
the Homepage.
The figure below shows,
Alert Notification: Total number of alert notifications generated.
Email: Number of notifications received via email.
SFTP: Number of SFTP notifications received.
Slack: Number of Slack notifications received.
SMS: Number of notifications received via SMS.
Graphs: Graphical representation of the statistics of notifications
received.
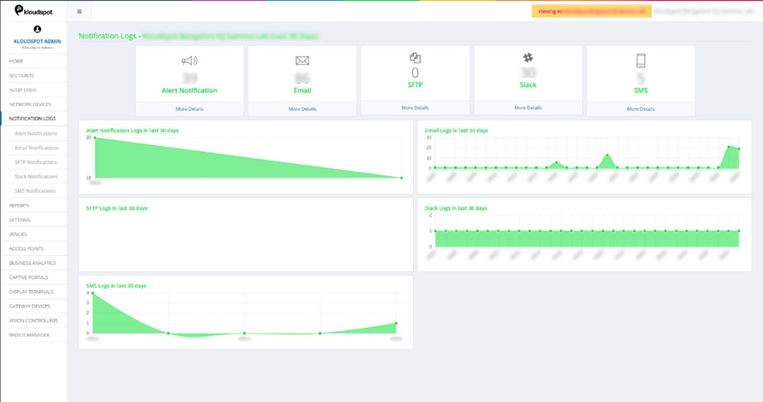 Fig 12: Notifications Summary
Notification Logs
- Alert Notifications: This lists the details of all the alert notifications sent. It covers all the details like the Name of the device for which the alert is sent, the type of alert notification, name assigned to that notification, Last updated time, contact the notification is sent to and status of the notification.
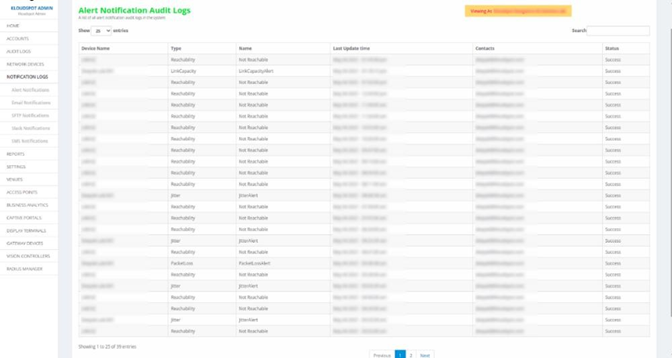 Fig 13: Notifications Logs page
2. Email Audit Logs: This table lists the notifications sent via Email.
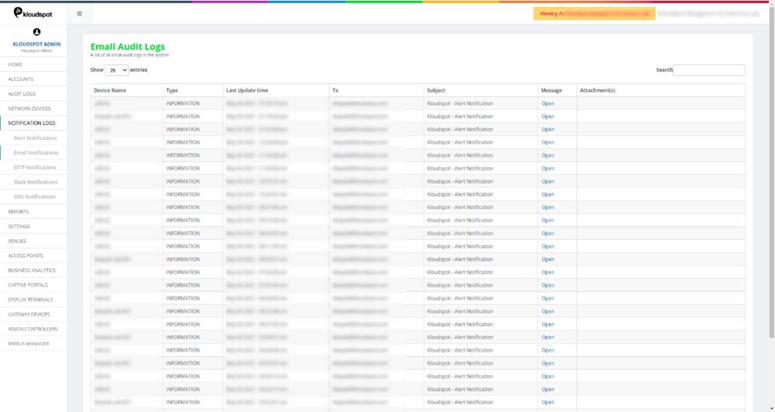 Fig 14: Email Notification page
3. Click on open for more details about individual notifications. Details
will be shown in the figure below.
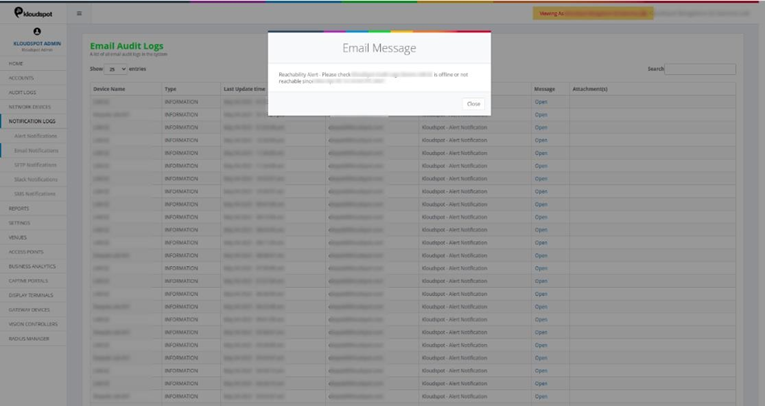 Fig 15: Details of email notifications
4. SFTP Notifications: Lists all the SFTP notifications.
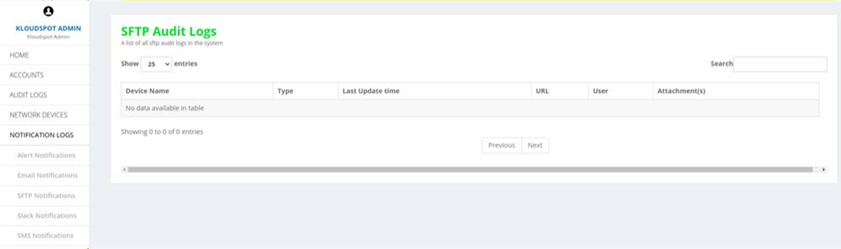 Fig 16: SFTP Notifications page
5. Slack Notifications: Lists all the Slack notifications.
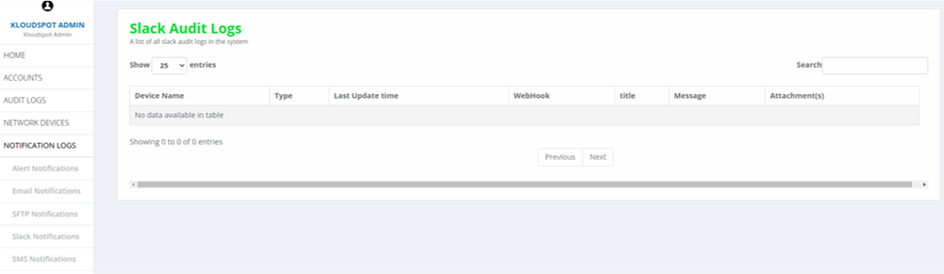 Fig 17: Slack Notifications page
6. SMS Notifications: Lists all the notifications sent via SMS.
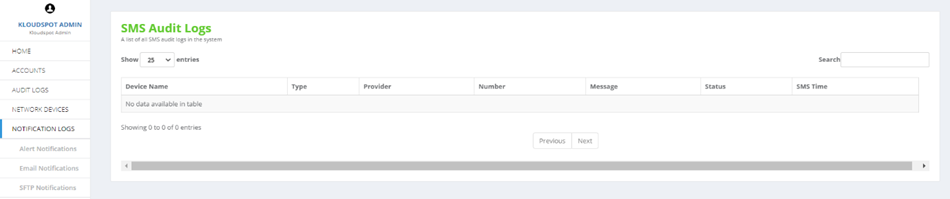 Fig 18: SMS Notifications page